
Introduction
As part of our ongoing commitment to creating and fostering a diverse and inclusive innovation ecosystem, Innovate UK collects diversity data on the personal characteristics of individuals applying for funding on behalf of a business. Transparency is a key part of delivering against our goals for promoting and strengthening equality, diversity and inclusion, and as such we have committed to publish results from our data collection annually.
This report draws on data from over 36,000 applications submitted to Innovate UK across a two-year period between April 2023 and March 2025. The two reporting years are covered separately. The main body presents results from the most recent year (April 2024 to March 2025), and the results from the previous year (April 2023 to March 2024) covered in Annex B.
Since our previous applicant diversity data report covering applications between April 2022 to March 2023, we have expanded the range of characteristics we report on. These now include:
- age
- conditions
- illnesses and disabilities
- educational background
- ethnicity
- gender
- socioeconomic background
By broadening the range of characteristics, we aim to strengthen transparency and deliver a richer picture of those applying for and receiving Innovate UK funding.
This report does not attempt to compare results with previous years. There are not enough years’ data available to draw robust year-on-year comparisons at this point.
The data analysed in this report is collected from the lead applicant on submission of an application to Innovate UK. An applicant’s diversity data is represented in the data each time they apply. This means that if multiple applications are submitted by the same lead project contact, they will appear more than once in the data. We do not currently collect data on the role of this individual within the business. Project partners and collaborators are excluded from the analysis.
A detailed explanation of the methodology is provided in Annex A.
What do we report on?
Applicants and successful applicants
The number of ‘applicants’ reported includes all applications submitted by the lead project contact via Innovate Funding Service (IFS) during the reporting period. This figure represents all applications that were submitted but were not subject to onward assessment. This includes those that did not meet competition eligibility criteria, or those submitted in response to Expression of Interest competitions where no funding was awarded.
The term ‘successful applicants’ refers to applications that went on to be awarded Innovate UK funding.
Award rate
The award rate is a calculation reporting the number of successful applications as a proportion of all assessed applications. It is presented as a percentage. The calculation excludes applications that failed eligibility or were not subject to Innovate UK’s funding assessment process.
A number of factors can impact award rates such as sector focus, demand and available budget. This is discussed in more detail in the relevant results section.
Targeted programmes to promote diversity and inclusion
Innovate UK has a strong focus on inclusive innovation. This includes running targeted programmes such as Women in Innovation and Unlocking Potential. Where appropriate this report presents results both including and excluding applications from Innovate UK’s diversity-focused programmes, to present the most accurate picture possible of our applicant make-up.
Contextual data
Wherever possible, we have referenced additional data sources to provide context for our results, including the:
- UK Working Age statistics
- UK Labour Force statistics
- Research and Innovation workforce statistics
While not offering an exact ‘like for like’ comparison with our diversity data, these additional data sources contribute to a broader understanding of the context in which Innovate UK applicants operate.
Results 2024 to 2025
This section of the report represents diversity data from over 17,100 applications in the period between 1 April 2024 and 31 March 2025. Results represent the lead applicant of an application.
Age
Survey respondents are asked their date of birth, from which their age is calculated based on the application submission date. Respondents are then grouped into age bands of:
- 18 to 24
- 25 to 34
- 35 to 49
- 50 to 64
- 65 and over
Figure 1: Applicants by Age Group 2024 to 2025
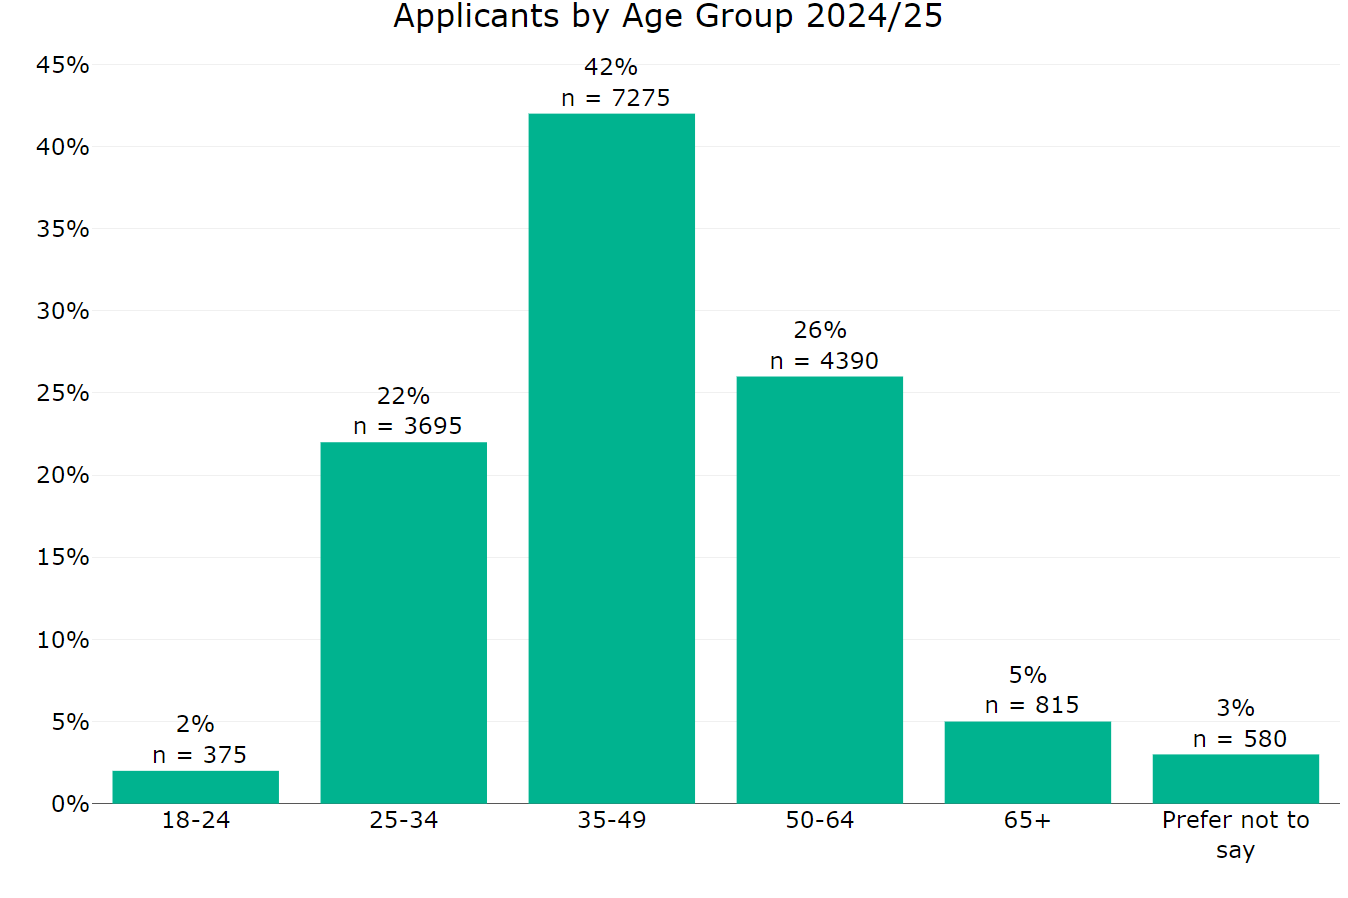
Figure 1: Applicants by Age Group 2024 to 2025
The graph shows that:
- 42% are aged 35 to 49
- 26% are aged 50 to 64
- 22% are aged 25 to 34
- 5% are aged 65 and over
- 2% are aged 18 to 24
- 3% did not disclose their date of birth
Figure 2: Successful applicants by age group 2024 to 2025
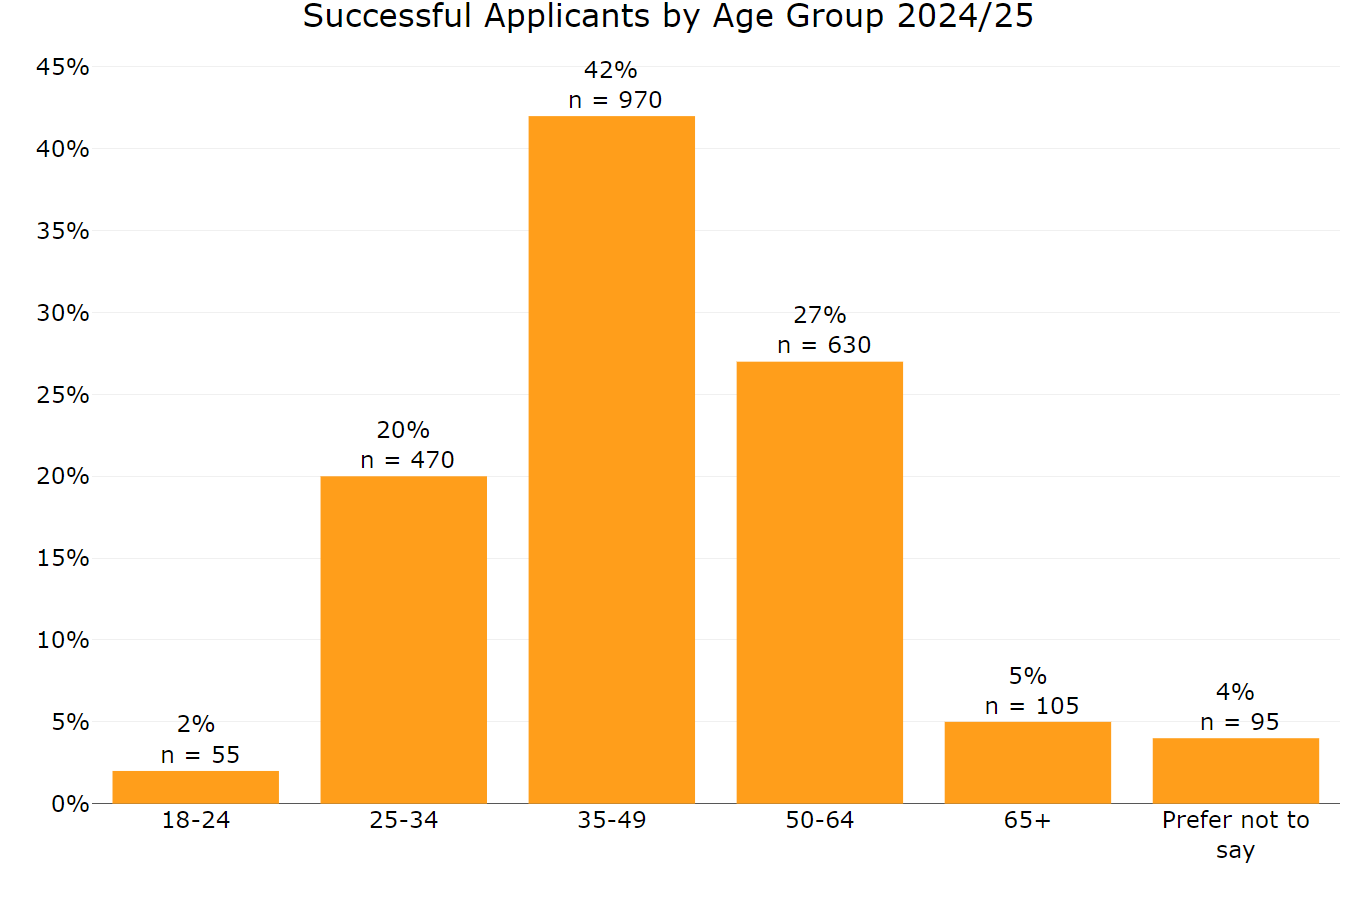
Figure 2 Successful applicants by age group 2024 to 2025
The pattern for successful applicants is consistent with that of all applicants, where:
- 42% are aged 35 to 49
- 27% are aged 50 to 64
- 20% are aged 25 to 34
- 5% are aged 65 and over
- 2% are aged 18 to 24
- 4% did not disclose their date of birth
For context, according to ONS employment data from July 2024, of those in employment and aged over 18:
- 10% were aged 18 to 24
- 23% were aged 25 to 34
- 34% were aged 35 to 49
- 28% were aged 50 to 64
- 5% were aged over 65
Figure 3: Application award rate by age group 2024 to 2025
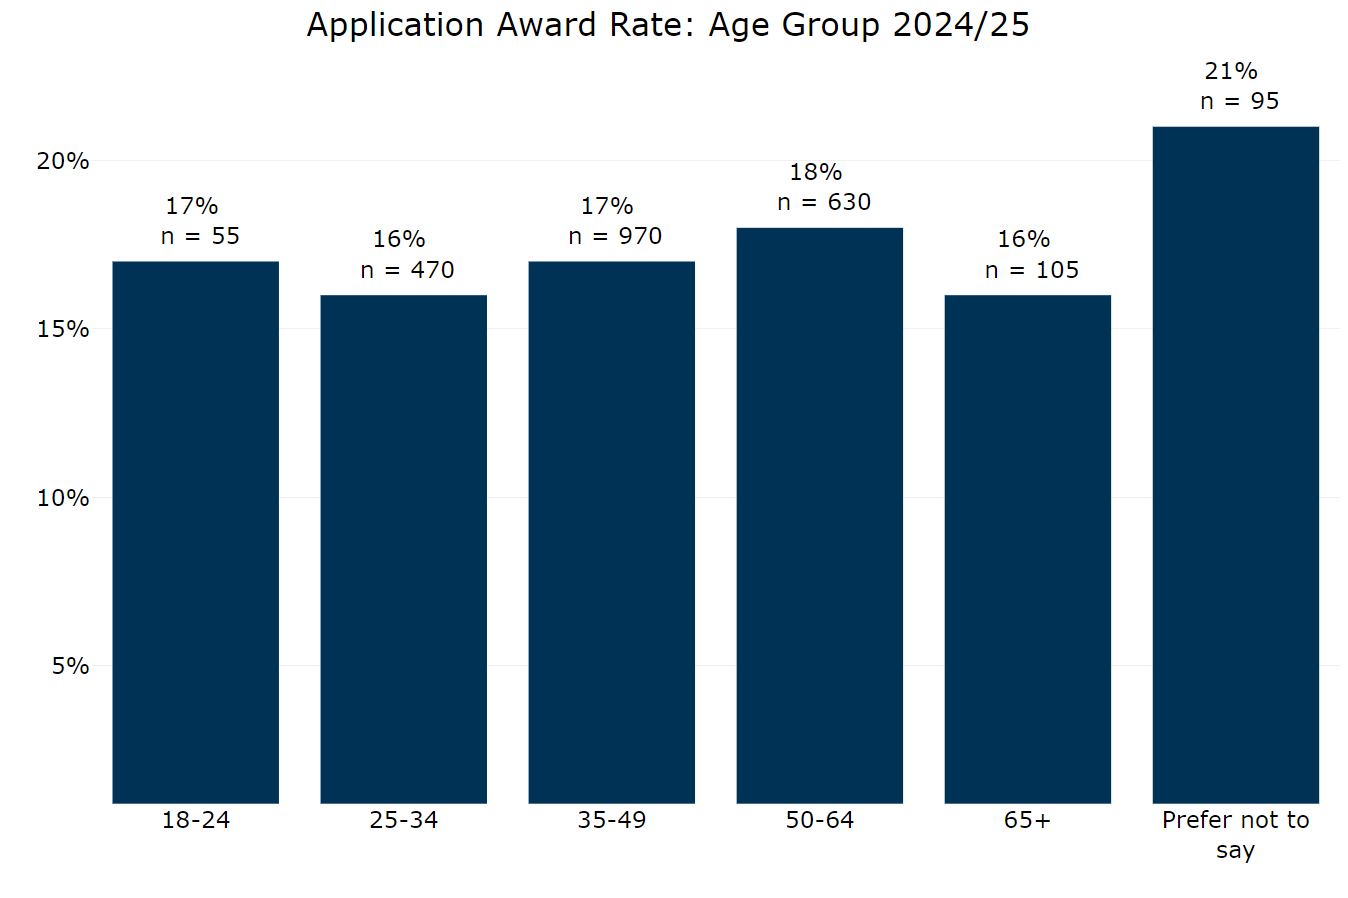
Figure 3 Application award rate by age group 2024 to 2025
Application award rates are broadly consistent across the different age groups, all of which are between 16 and 18%. Prefer not to say was slightly higher at 21%.
Conditions, illnesses or disabilities
Survey respondents were asked whether they considered themselves to have any conditions, illnesses or disabilities that act as a substantial or long-term barrier to carrying out day-to-day activities. The available responses were No, Yes and Prefer not to say.
Figure 4: Applicants by conditions, illnesses or disabilities 2024 to 2025
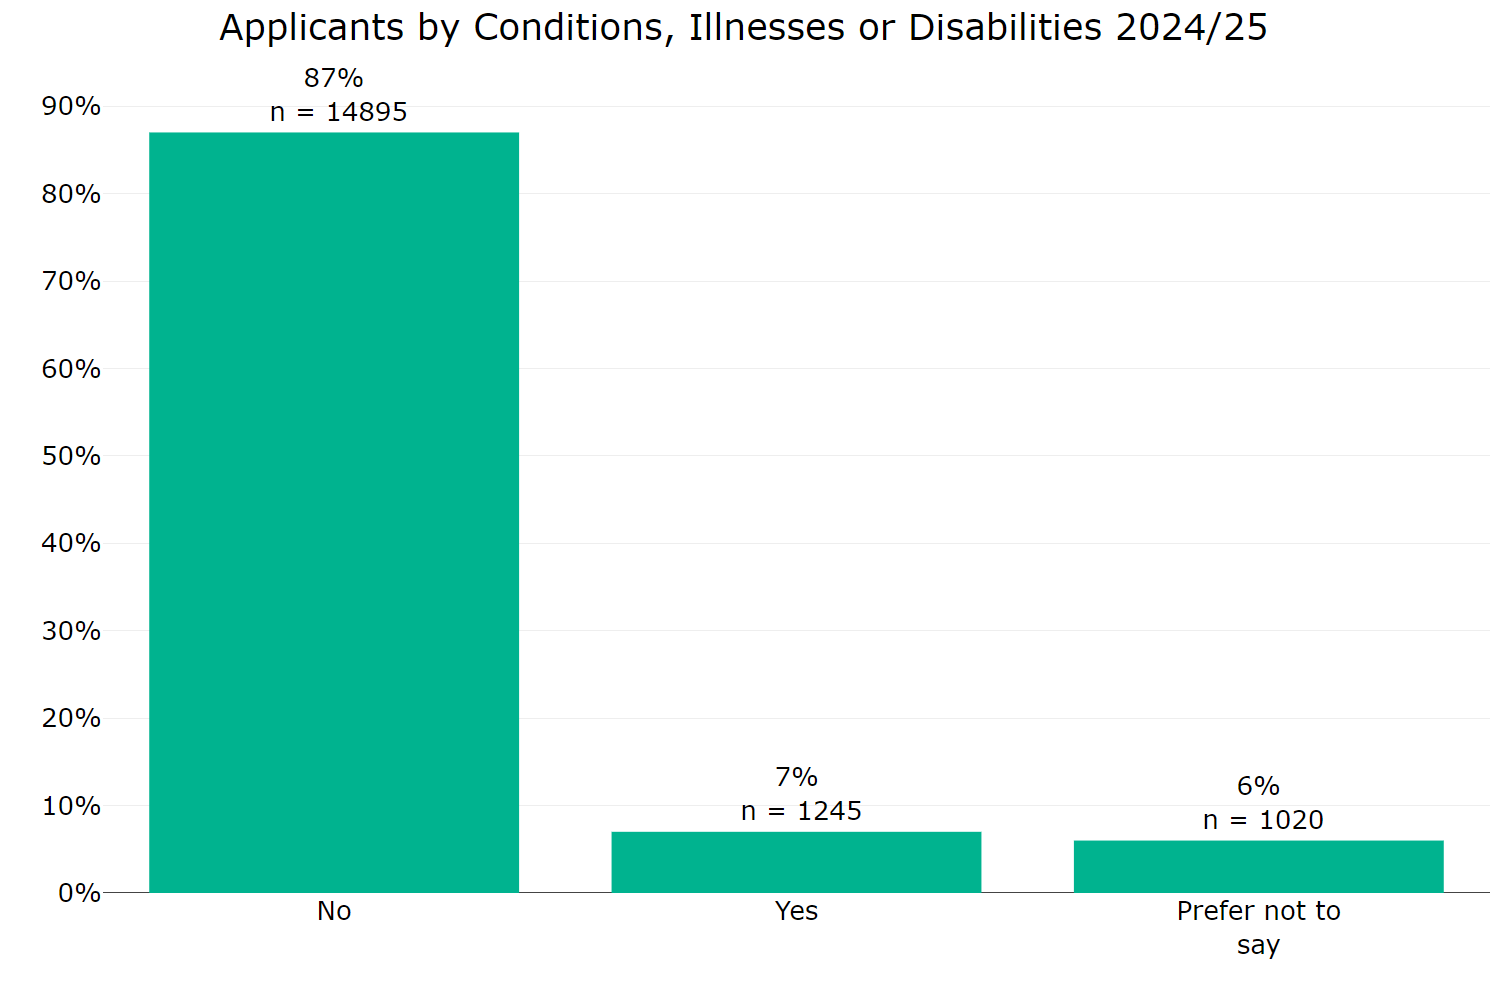
Figure 4 Applicants by conditions, illnesses or disabilities 2024 to 2025
87% of applicants responded ‘No’ to this question, 7% reported ‘Yes’ and 6% preferred not to say.
Figure 5: Successful applicants by conditions, illnesses or disabilities 2024 to 2025
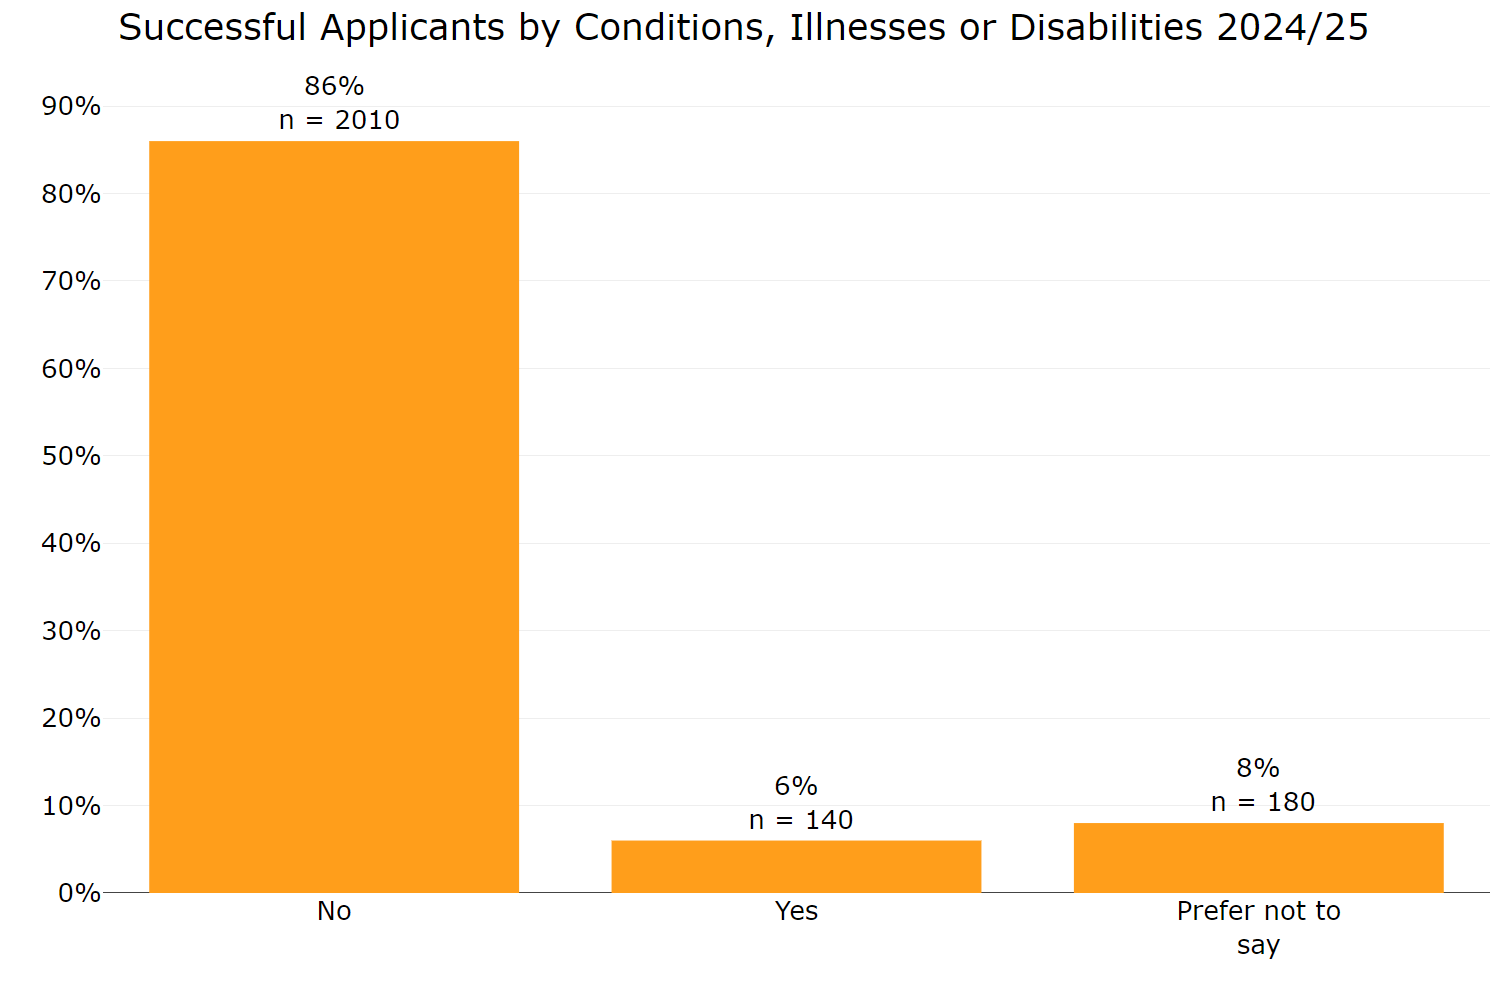
Figure 5 Successful applicants by conditions, illnesses or disabilities 2024 to 2025
For successful applicants the distribution was similar, with 86% reporting ‘No’, 6% reporting ‘Yes’ and 8% reporting ‘Prefer not to say’.
The latest data from the Department of Work and Pensions shows that nearly one in four (23%) of the working-age population (aged 16 to 64) are classed as disabled and just over one in three (36%) report having a long-term health condition.
The most recent Longitudinal Small Business Survey found that around 2% of small and medium enterprise (SME) employers were led by disabled people. This is defined in the survey as having either a sole leader with a disability or a management team where more than half of the members have disabilities). In addition, 9% of SME employers reported that at least one of their owners, directors, or partners was disabled.
Figure 6: Award rate by conditions, illnesses or disabilities 2024 to 2025
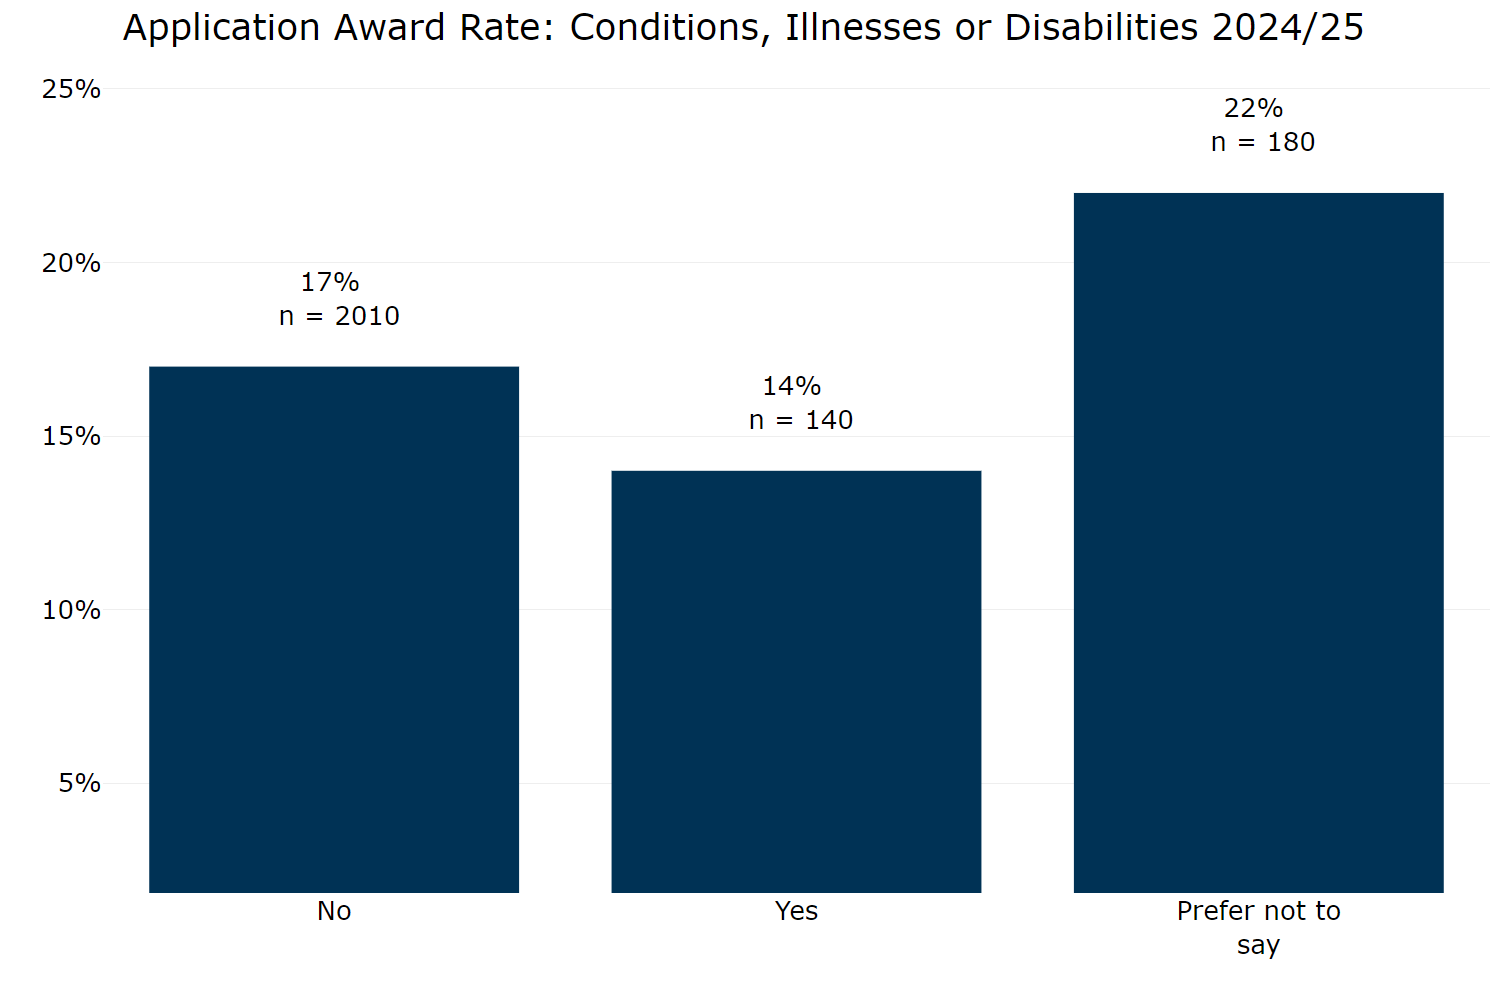
Figure 6 Award rate by conditions, illnesses or disabilities 2024 to 2025
The award rate for applicants reporting conditions, illnesses and disabilities is slightly lower at 14% than those who did not, at 17%. Applicants who preferred not to say had an award rate of 22%.
Educational background
Survey respondents were asked: ‘What is the highest educational qualification you have obtained?’ Response options include:
- no formal qualifications
- GCSEs or equivalent
- A-levels or equivalent
- NVQ or equivalent
- apprenticeship
- bachelor’s degree
- master’s degree
- doctoral degree
- professional qualification
- prefer to self-describe
- prefer not to say
Figure 7: Applicants by educational background 2024 to 2025
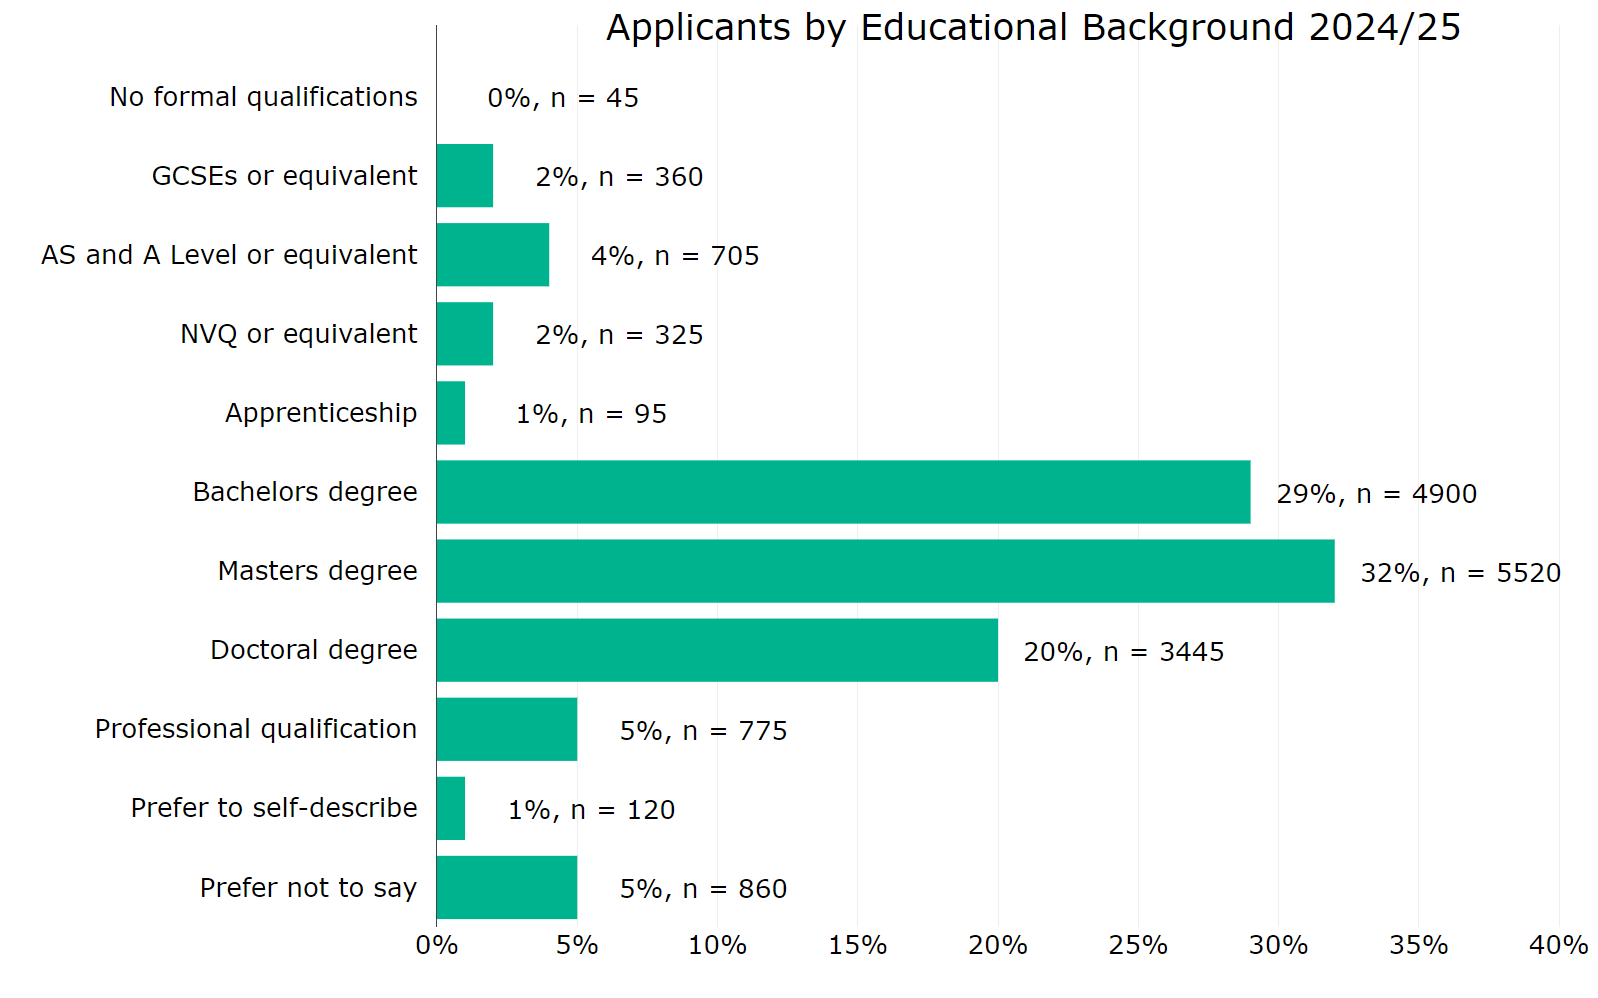
Figure 7 Applicants by educational background 2024 to 2025
Figure 7 Applicants by educational background 2024 to 2025
The majority of Innovate UK applicants (81%) reported a bachelor’s degree-level qualification or higher, with 32% reporting a master’s degree, 29% a bachelor’s degree and 20% a doctoral degree. Following this:
- 5% of applicants reported a professional qualification
- 4% reported an AS and A level (or equivalent) qualification
- 2% reported a GCSE or NVQ (or equivalent) qualifications
- 1% reported an apprenticeship
- fewer than 1% reported having no formal qualifications
- around 1% of applicants preferred to self-describe
- 5% preferred not to say
Figure 8: Successful applicants by educational background 2024 to 2025
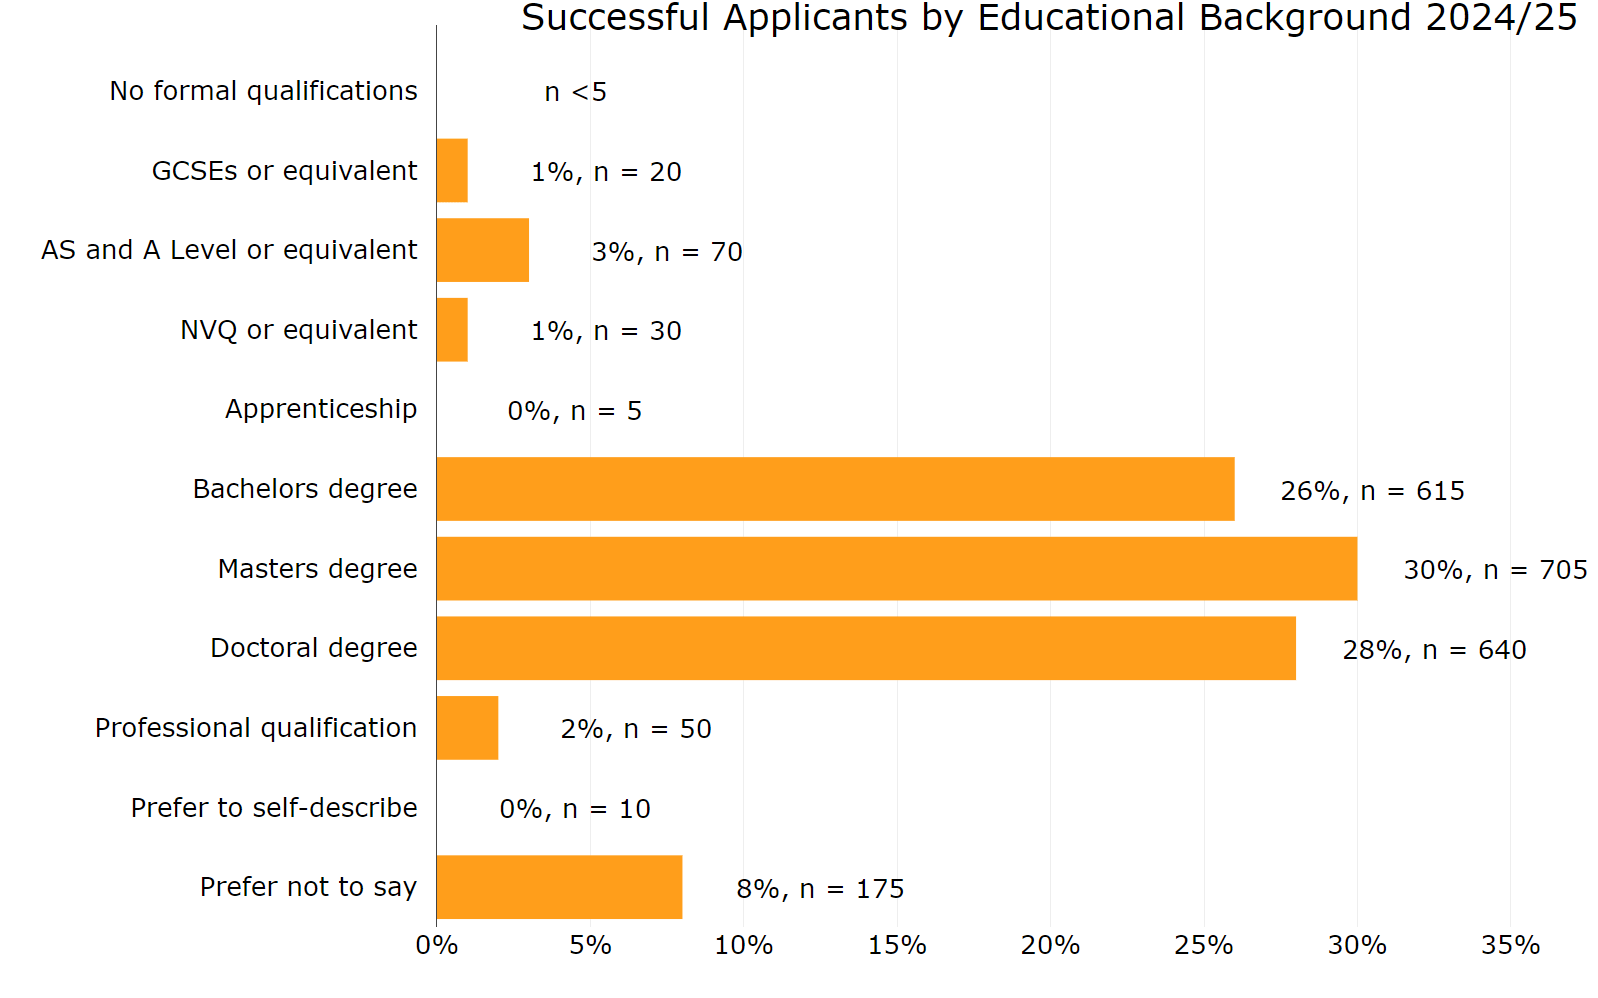
Figure 8 Successful applicants by educational background 2024 to 2025
Figure 8 Successful applicants by educational background 2024 to 2025
For funded applicants the pattern is similar, where the vast majority (84%) reported a bachelor’s degree-level qualification or higher. Around 26% of funded applicants had a bachelor’s degree, 30% had a master’s degree and 28% had a doctoral degree.
In addition:
- 3% reported an AS and A Level (or equivalent) qualification
- 2% reported a professional qualification
- 1% reported a GSCE or NVQ (or equivalent) qualification
- fewer than 1% reported an apprenticeship or no formal qualifications
- fewer than 1% preferred to self-describe
- 8% preferred not to say
Figure 9: Application award rate by educational background 2024 to 2025
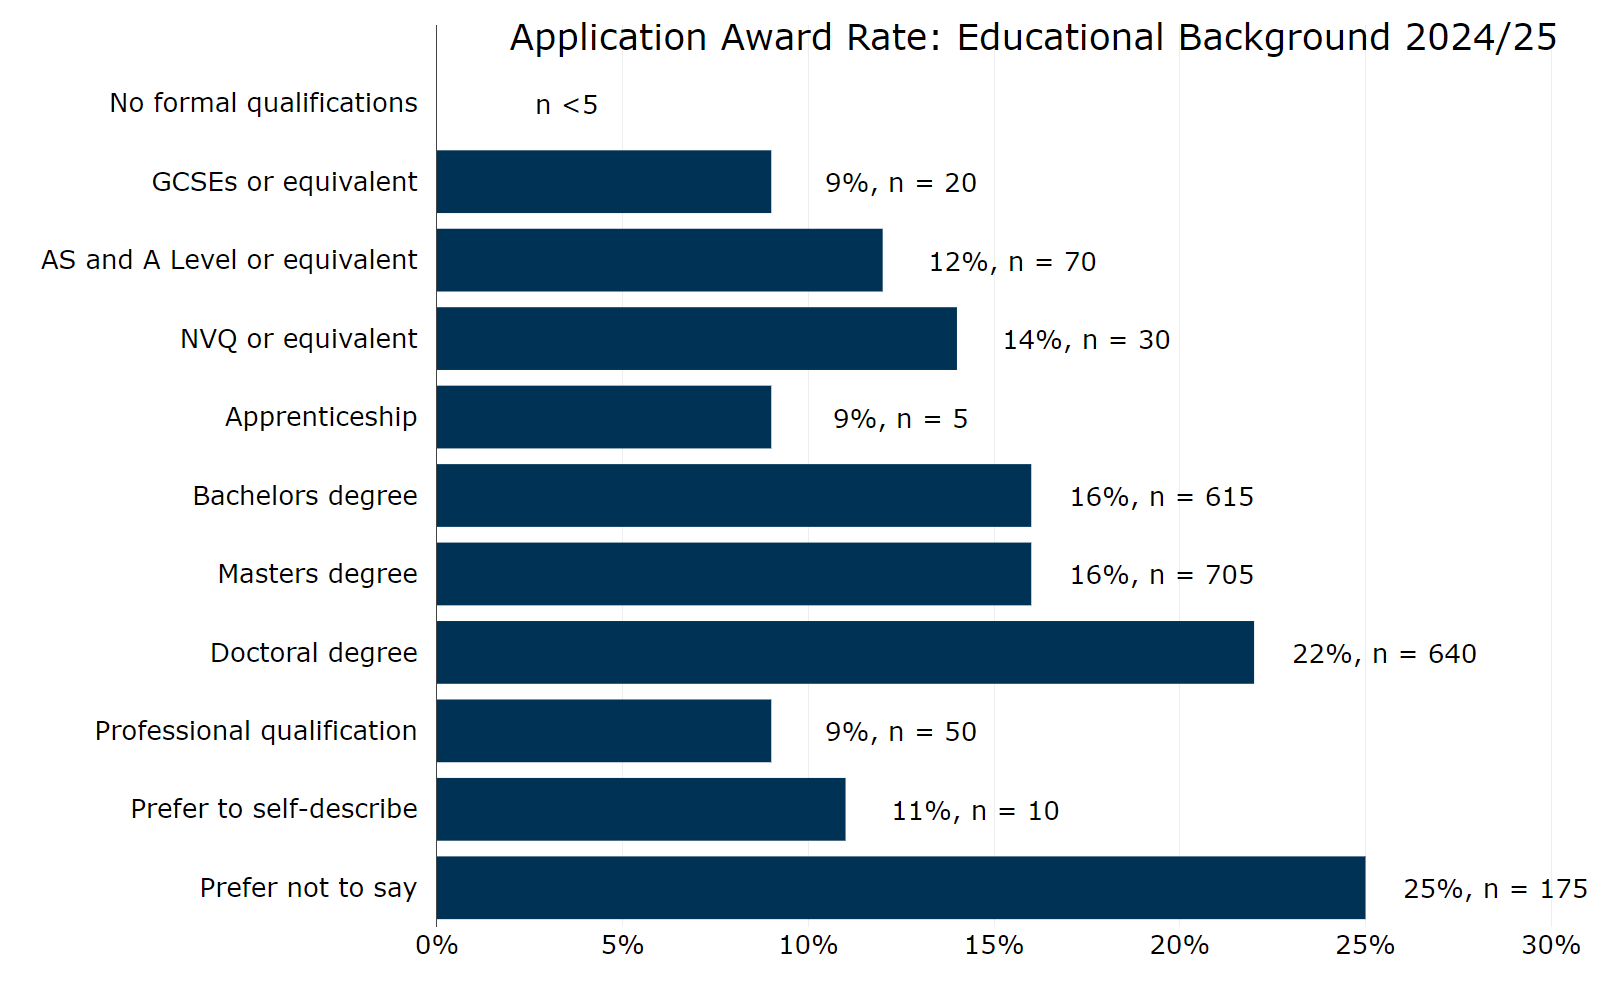
Figure 9 Application award rate by educational background 2024 to 2025
Figure 9 Application award rate by educational background 2024 to 2025
Award rates for each qualification level show that applicants who preferred not to say had the highest award rate at 25%, followed by applicants with:
- doctoral degrees at 22%
- bachelor’s and master’s degrees at 16%
- NVQ (or equivalent) at 14%
- AS and A level (or equivalent) at 12%
- prefer to self-describe at 11%
- 9% for GCSEs (or equivalent), apprenticeships and professional qualifications
There were too few successful applicants with no formal qualifications to calculate an award rate.
Census 2021 data for England and Wales shows that four in 10 workers (and jobseekers) hold a higher education qualification (Level 4 or above), such as a bachelor’s degree, master’s degree or NVQ. However, notable sector variation exists. Evidence shows that the educational attainment of the general R&D sector (including both business and higher education employees) is high when compared to the broader UK workforce, given the degree of specialisation required. In 2019, 79% of workers in R&D occupations were qualified to NVQ Level 4 or higher.
Ethnicity
Applicants were asked how they would describe their ethnic background and offered the following options to select:
- Arab
- Asian (including Asian British)
- Black (including Black British)
- Latino Hispanic
- Mixed or Multiple ethnic groups
- White
- prefer to self-describe
- prefer not to say
Figure 10: Applicants by ethnicity 2024 to 2025
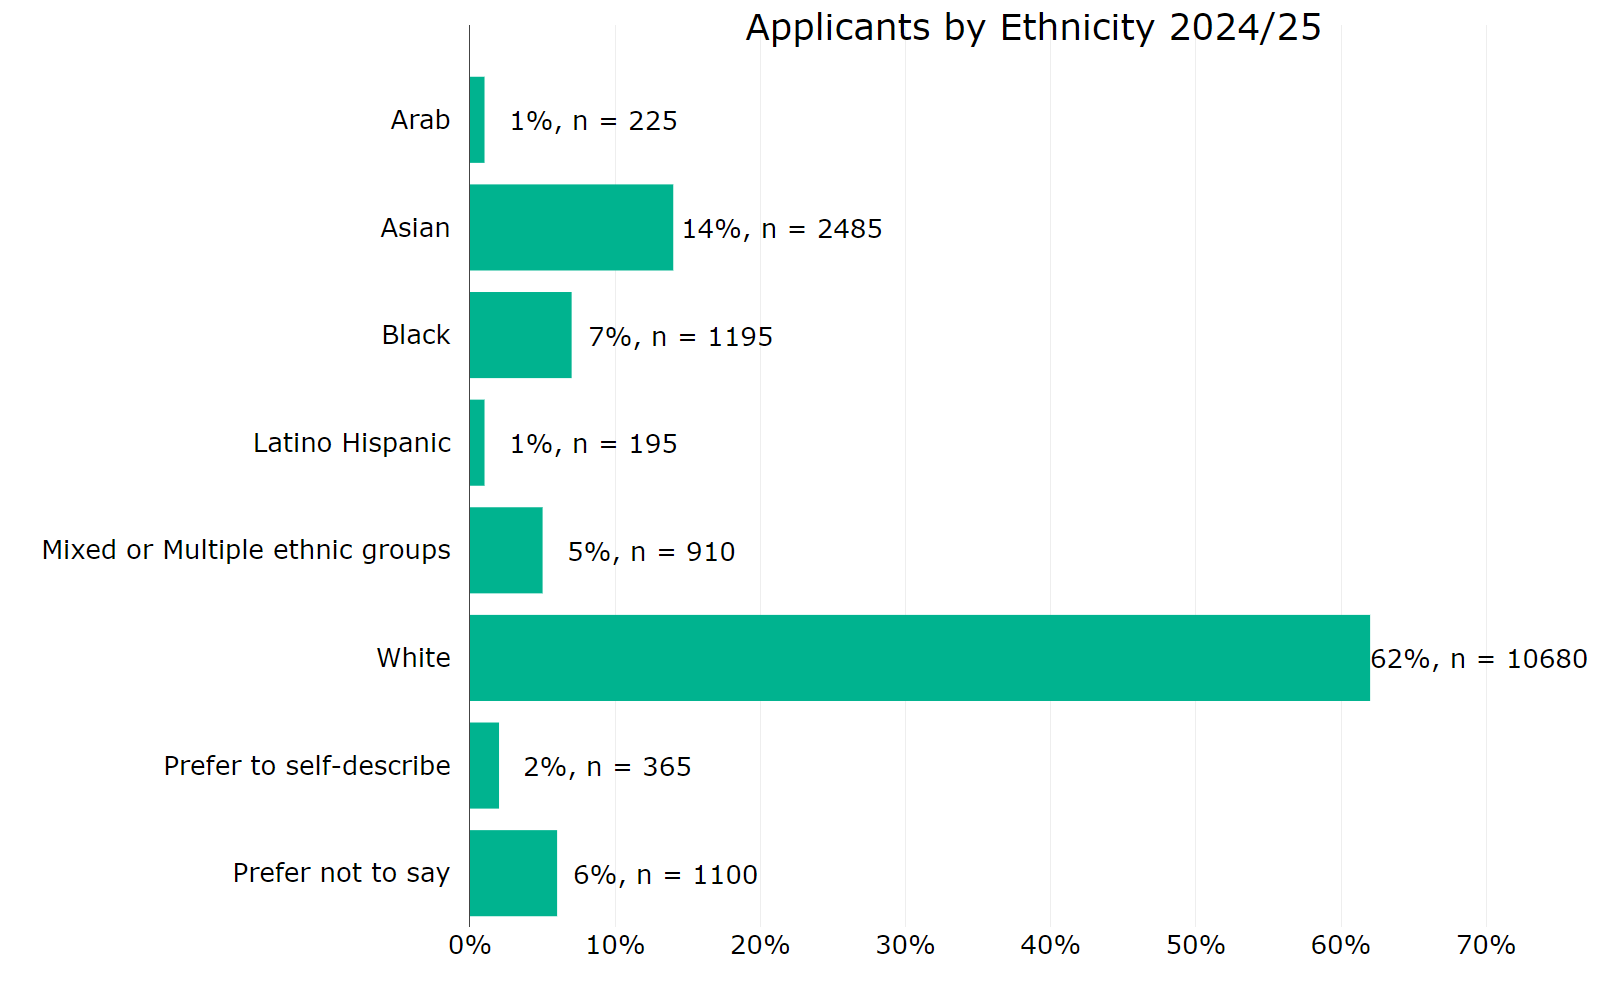
Figure 10 Applicants by ethnicity 2024 to 2025
Results show that the of the total number of applicants:
- 62% identified as White
- 14% identified as Asian
- 7% identified as Black
- 5% identified as Mixed or having multiple ethnic groups
- 1% identified as Arab or Latino Hispanic
- 2% preferred to self-describe
- 6% preferred not to say
Figure 11: Successful applicants by ethnicity 2024 to 2025
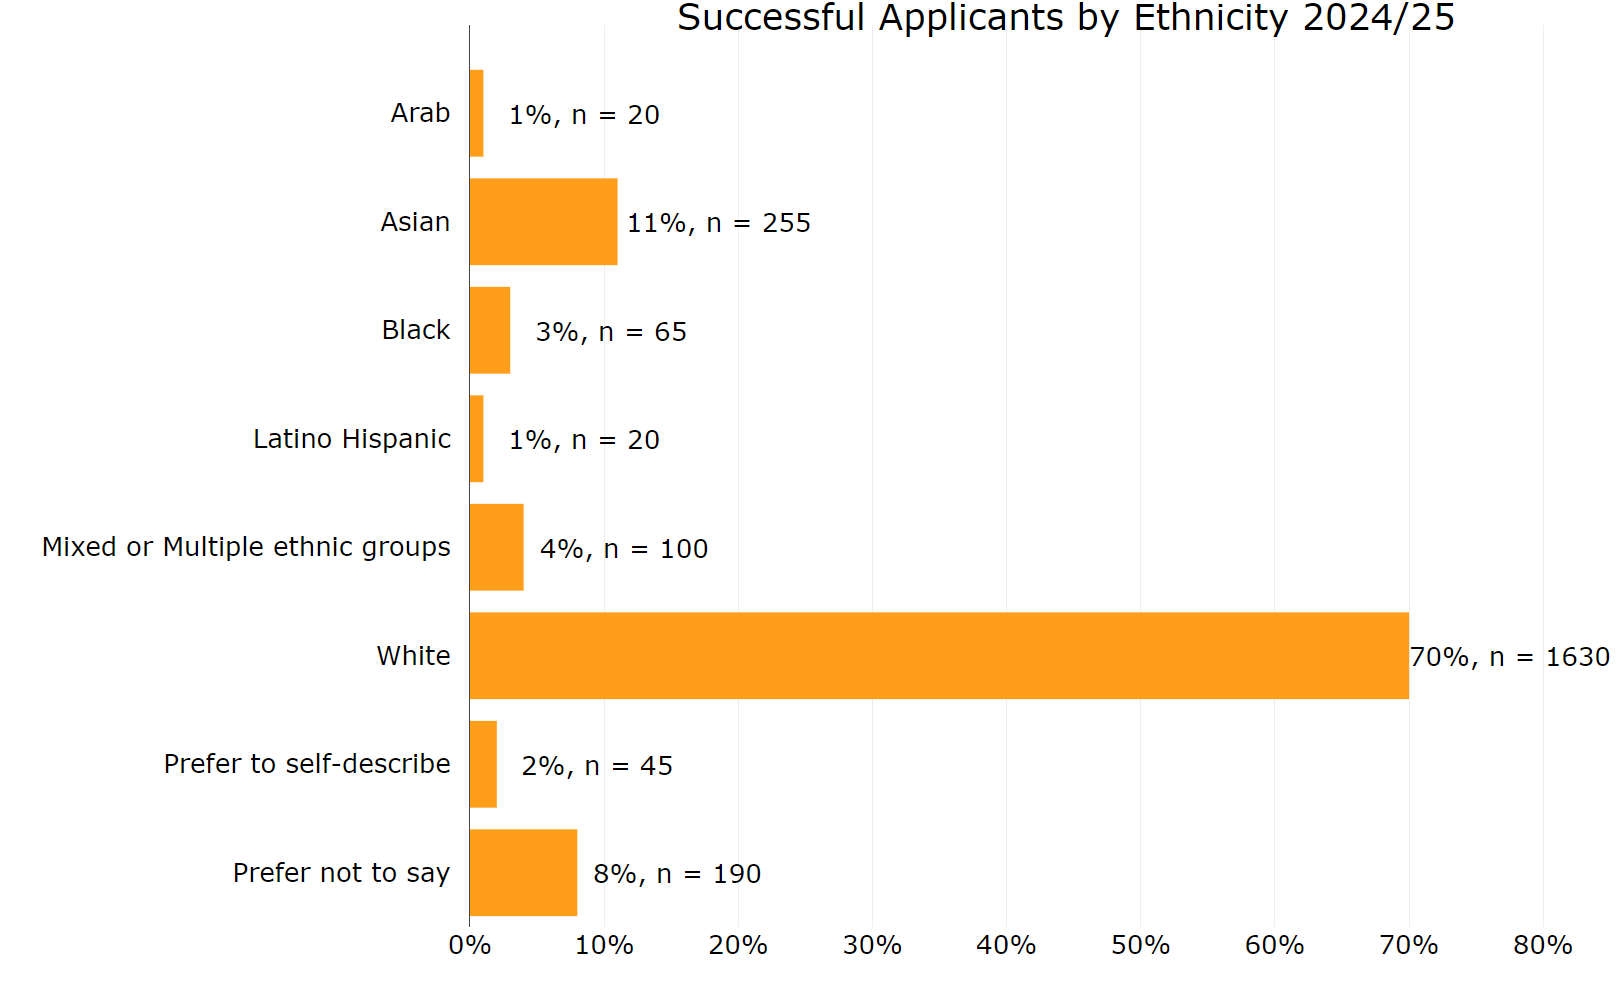
Figure 11 Successful applicants by ethnicity 2024 to 2025
When looking at successful applicants:
- 70% identified as White
- 11% identified as Asian
- 4% identified as having Mixed or multiple ethnic groups
- 3% identified as Black
- 1% identified as Arab or Latino Hispanic
- 2% preferred to self-describe
- 8% preferred not to say
For context, according to the 2021 census, of the working-age population in England and Wales 81% were White, 10% were Asian and 4% were Black. In the Longitudinal Small Business Survey, about 6% of SME employers were minority ethnic group led. This is defined as having a person from an ethnic minority in sole control of the business or having a management team with at least half of its members from minority ethnic groups.
Figure 12: Award rate by ethnicity 2024 to 2025

Figure 12 Award rate by ethnicity 2024 to 2025
Applicants who preferred not to say had the highest award rate at 22%, followed by:
- White applicants at 18%
- prefer to self-describe at 16%
- Latino Hispanic applicants and applicants with mixed or multiple ethnicities at 14%,
- Asian applicants at 13%
- Arab applicants at 11%
- Black applicants at 8%
Gender
Survey respondents were asked to describe their gender, which may reflect a combination of gender identity, expression or experience. By ‘gender’ we refer to respondents’ current gender, which may correspond or differ from assigned or registered sex. Response options were:
- man
- non-binary
- questioning or unsure of gender identity
- woman
- prefer to self-describe
- prefer not to say
When reporting gender, we see an impact on results when data from diversity-focused programmes (such as Women in Innovation) are included or excluded from the analysis. In this section we compare results for applicants, successful applicants and award rates where these targeted programmes are both included and excluded.
In terms of contextual insights, the Department for Science, Innovation and Technology’s Research and Innovation Workforce Survey estimates that 25% of the UK R&D workforce are women and 74% are men. This represents a significant participation gap. By contrast, the broader UK workforce shows a much smaller difference: the female employment rate is 71.8% compared with 78.2% for men.
Representation among business leaders shows similar disparities. According to the latest Longitudinal Small Business Survey, around 14% of SME employers are women-led.
It is important to note that while these contextual statistics report on a mix of sex and gender, Innovate UK only reports on the gender of lead applicants.
Figure 13: Applicants by gender (including diversity-focused competitions) 2024 to 2025
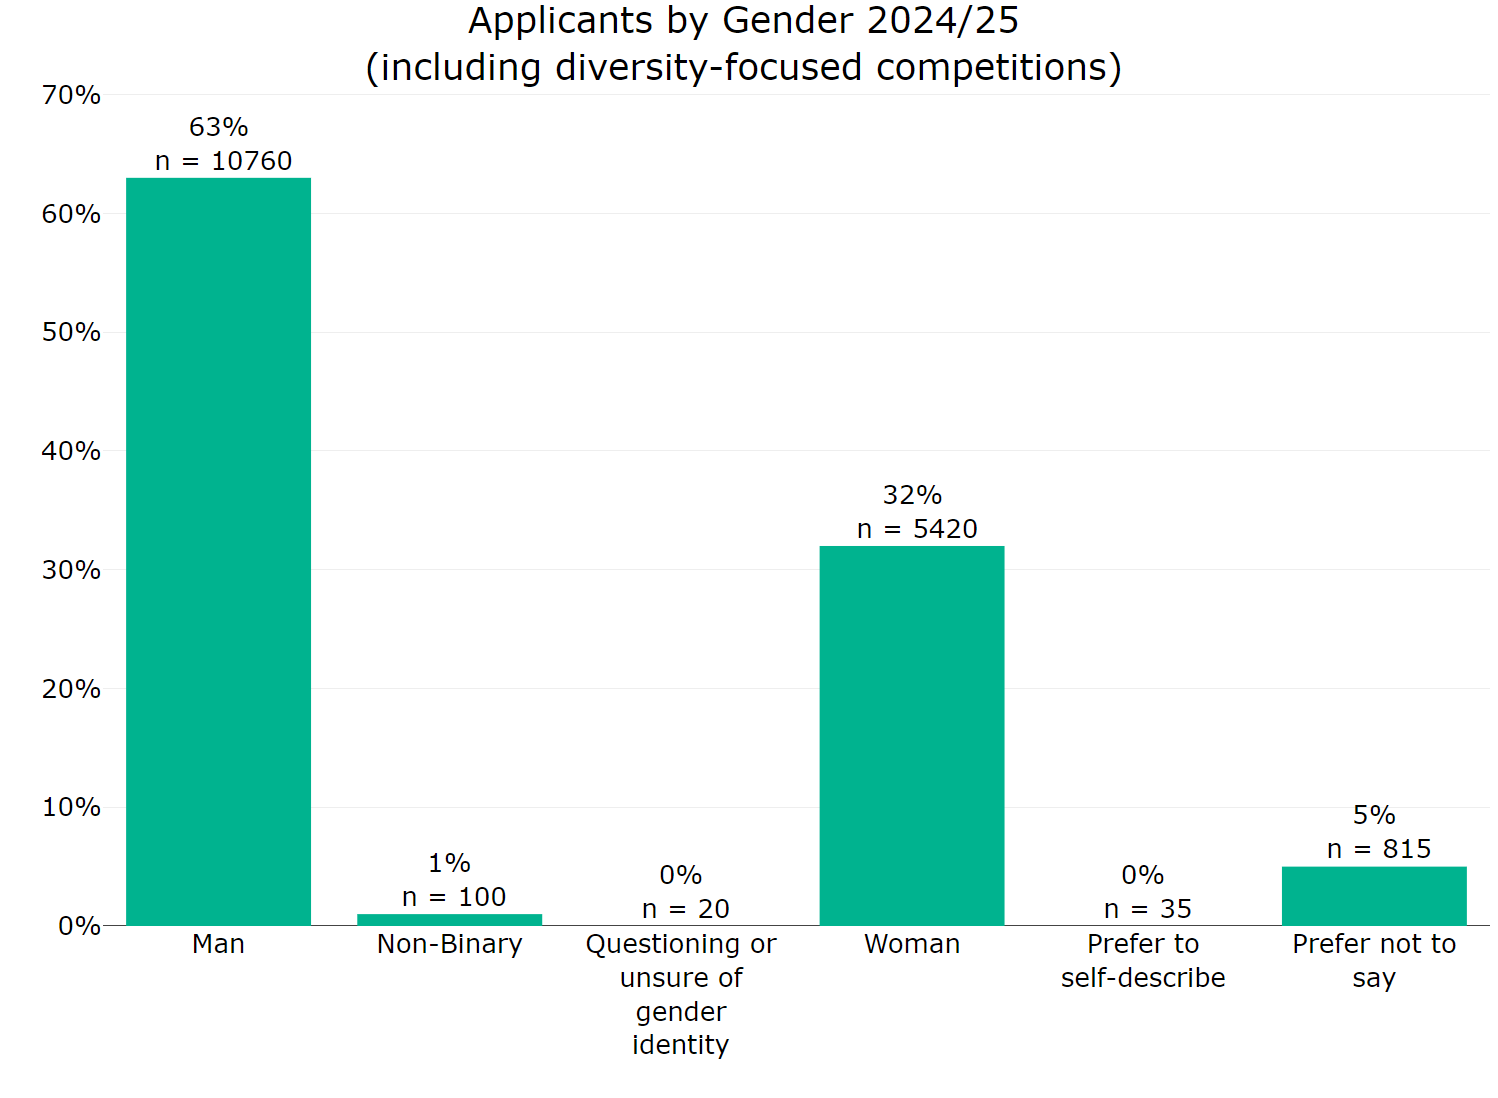
Figure 13 Applicants by gender (including diversity-focused competitions) 2024 to 2025
Results show that when applications from diversity-focused competitions were included:
- 63% of applicants were men
- 32% were women
- 1% identified as non-binary
- fewer than 1% identified as questioning or unsure of their gender identity
- fewer than 1% preferred to self-describe
- 5% preferred not to say
Figure 14: Applicants by gender (excluding diversity-focused competitions) 2024 to 2025
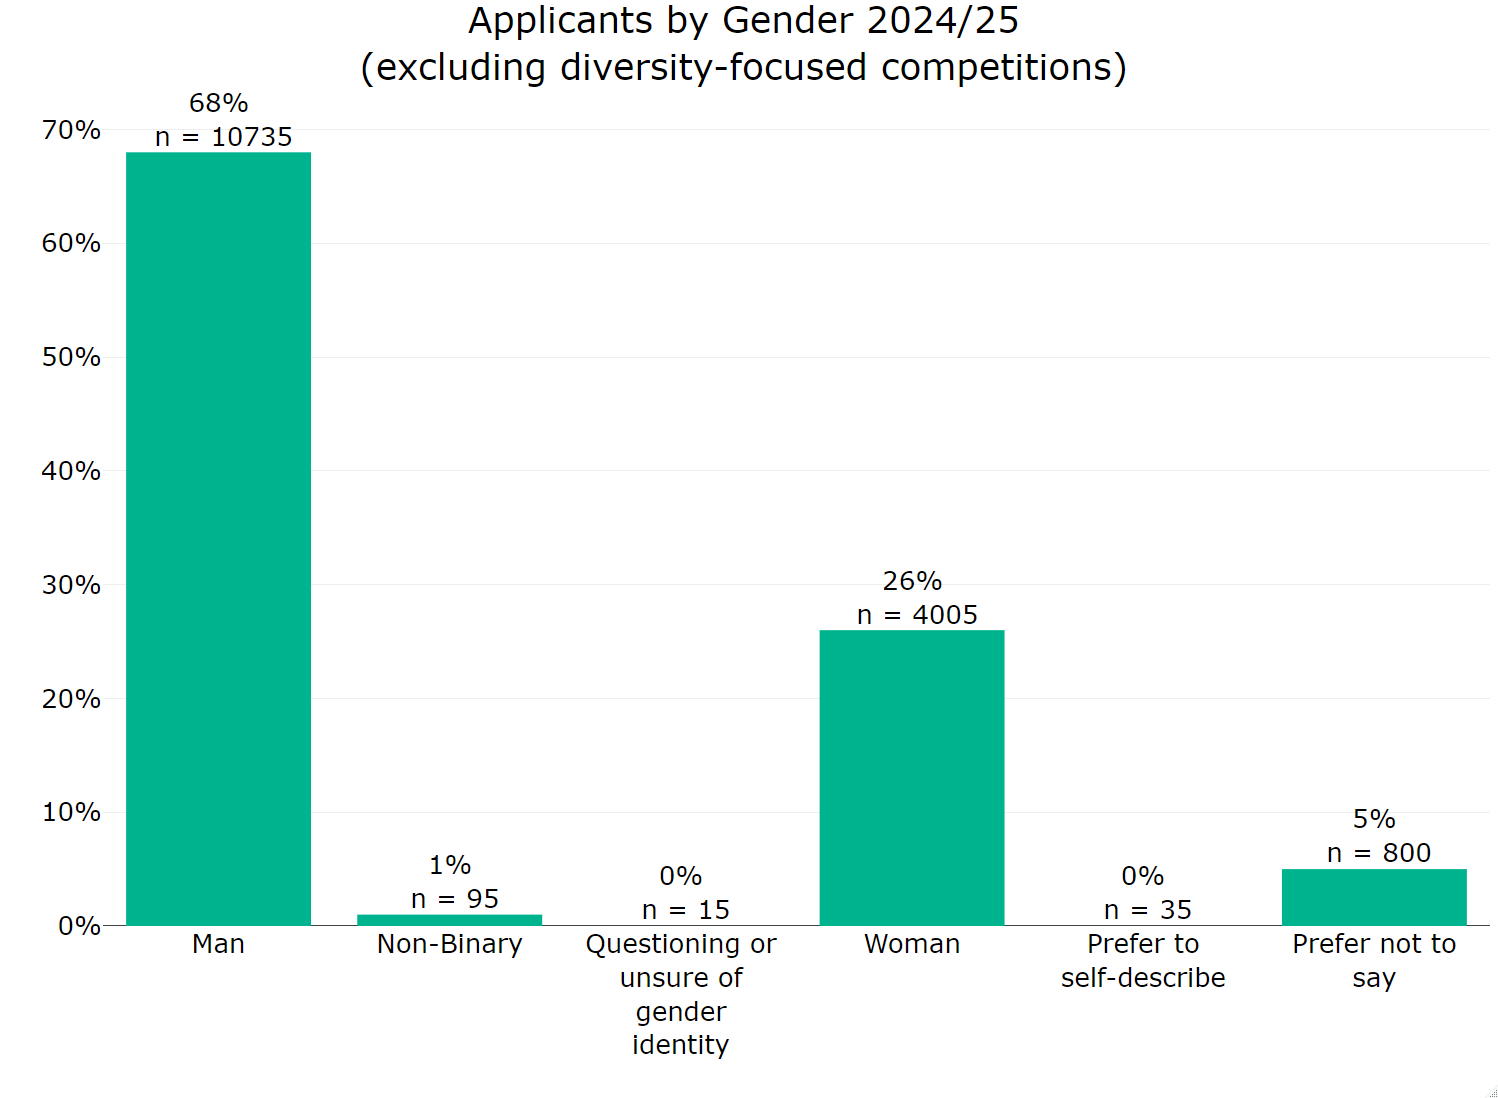
Figure 14 Applicants by gender (excluding diversity-focused competitions) 2024 to 2025
When compared to results excluding diversity-focused competitions, the proportion of applicants that were men increases to 68% and the proportion of applicants that were women decreases to 26%. This difference reflects the popularity of the Women in Innovation programme run during this period that attracts up to 1500 applications per competition.
Figure 15: Successful applicants by gender (including diversity-focused competitions) 2024 to 2025
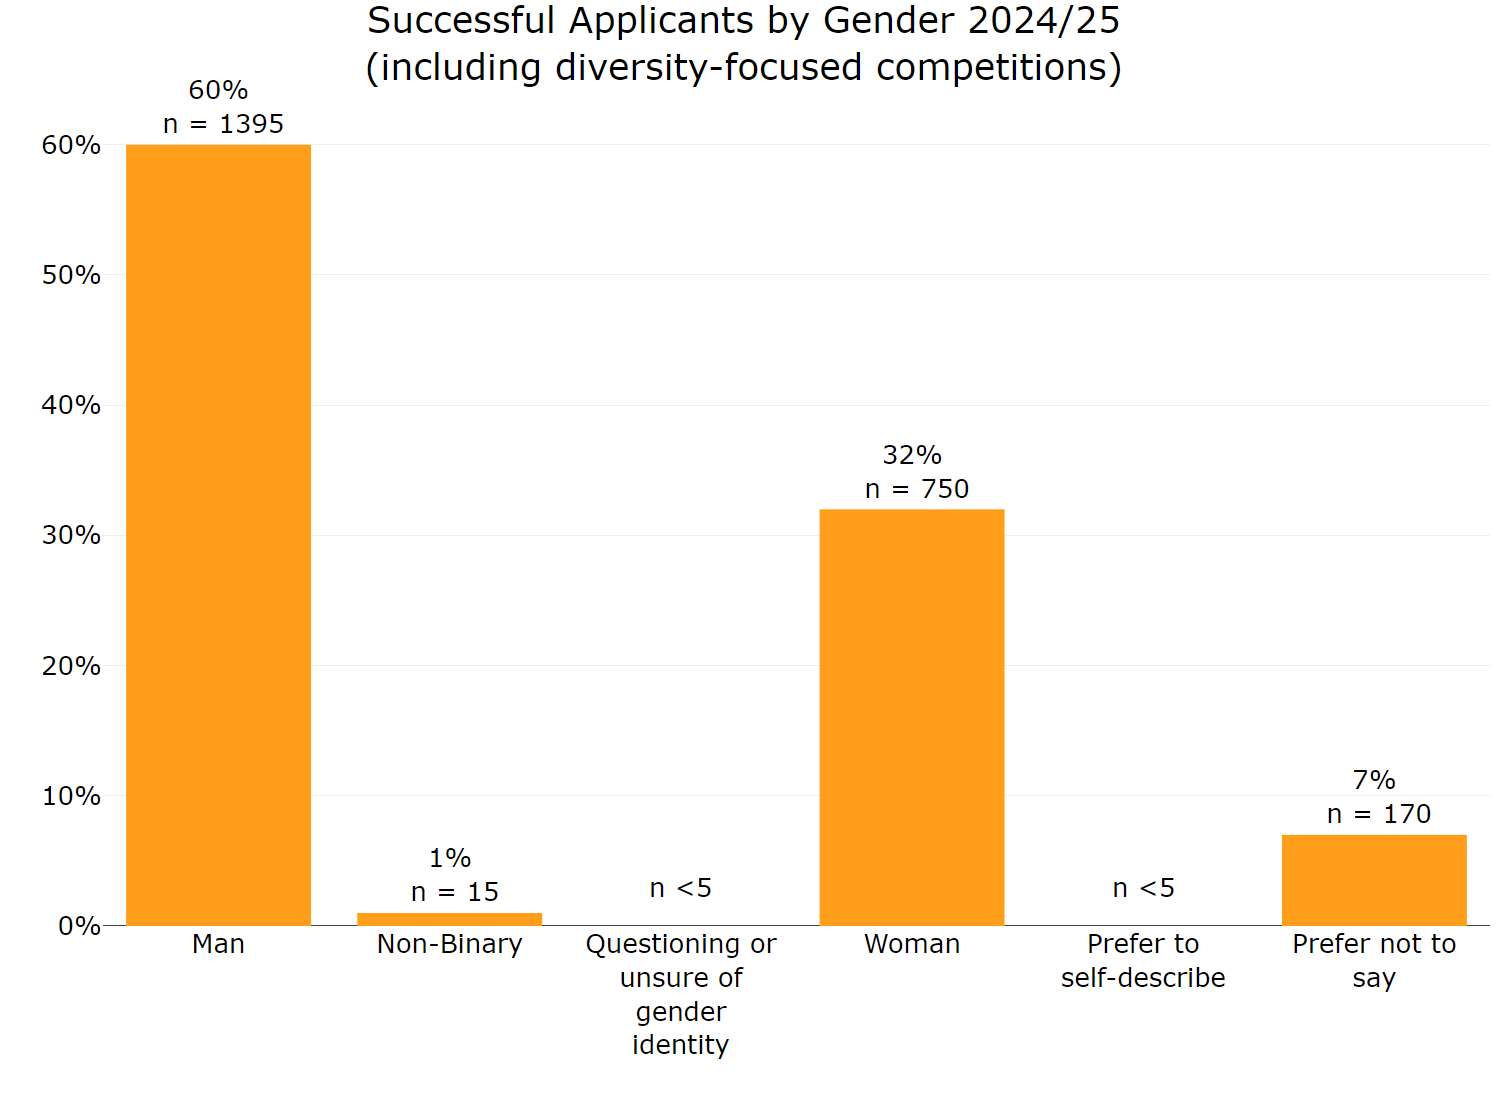
Figure 15 Successful applicants by gender (including diversity-focused competitions) 2024 to 2025
Looking at results for successful applicants, these are broadly consistent with the applicant data. When diversity-focused programmes are included:
- 60% of successful applicants are men
- 32% of successful applicants are women
- 1% of successful applicants are non-binary
- 7% of successful applicants preferred not to say
- fewer than five successful applicants identify as questioning their gender or prefer to self-describe
Figure 16: Successful applicants by gender (excluding diversity-focused competitions) 2024 to 2025
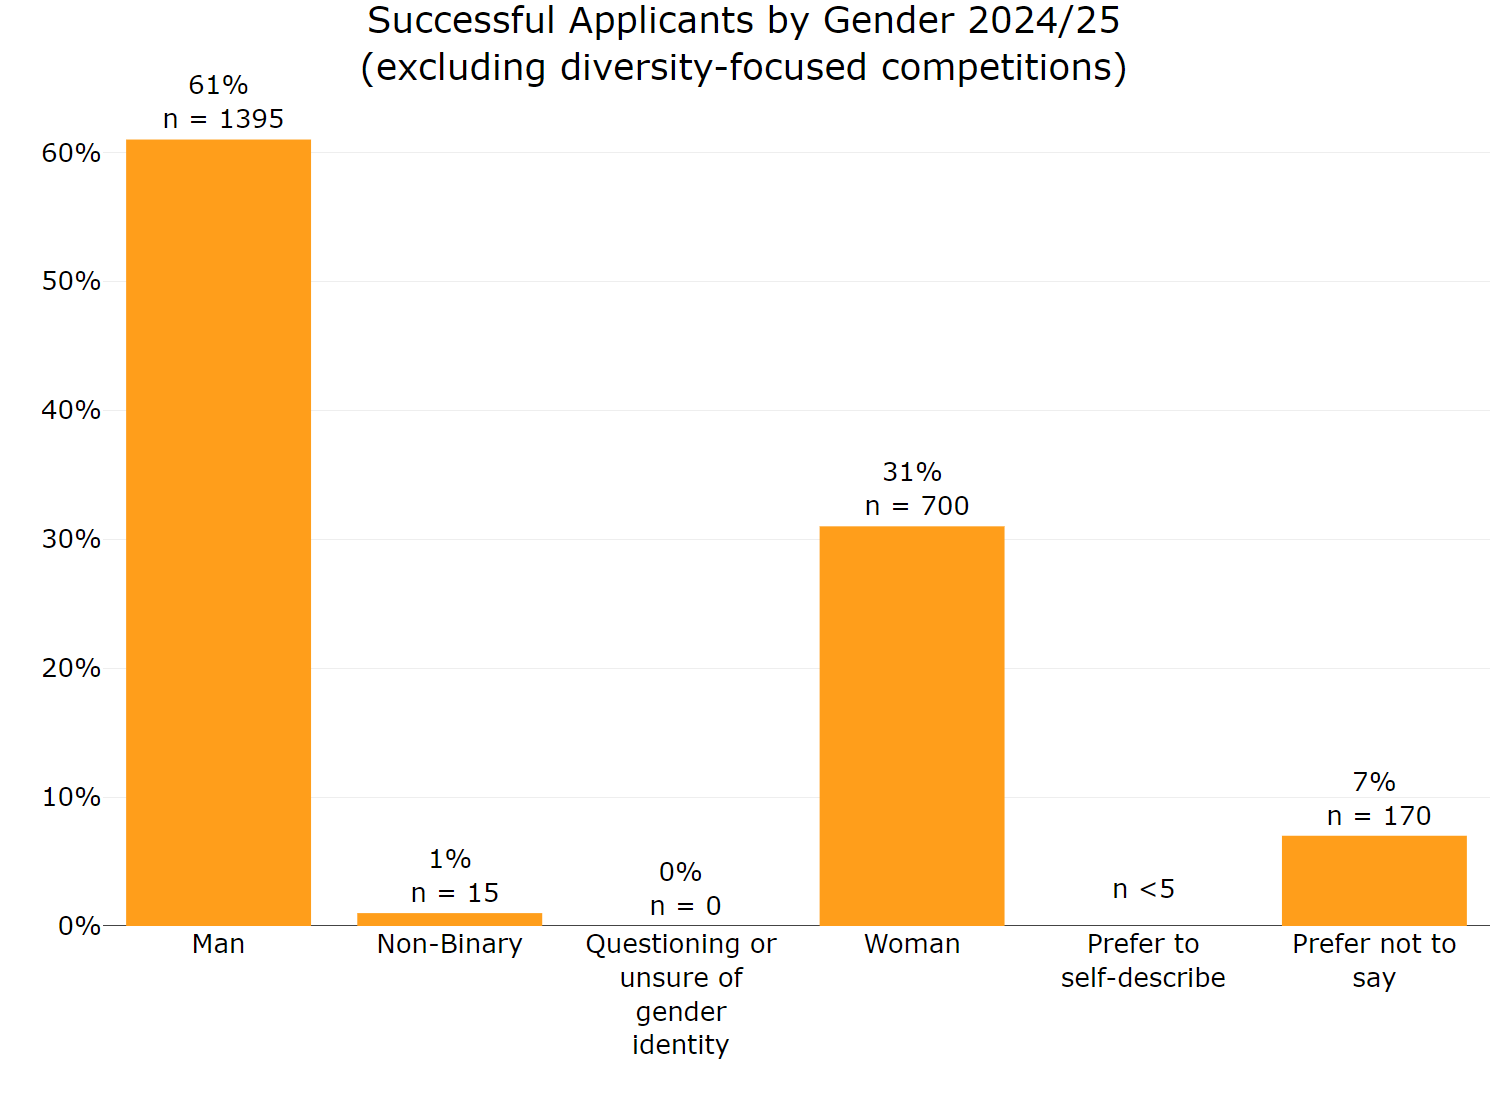
Figure 16 Successful applicants by gender (excluding diversity-focused competitions) 2024 to 2025
When diversity-focused competitions are excluded the proportions of successful applicants are broadly the same, with 31% being women. This shows that these programmes did not have a notable effect on the overall results.
Funding data collected by Innovate UK between April 2024 and March 2025 shows that the 32% of successful applications led by women represent 25% of the total investment (around £146 million). This is compared to 66% (£386 million) of the total investment to applications led by men, and 8% (£48 million) to those who preferred not to say.
It should be noted that as this data represents funding awarded to the lead applicant only, it does not reflect total funding awarded by Innovate UK. For example, where projects have more than one participant, as collaborators are omitted from this analysis).
Figure 17: Application award rate by gender (including diversity-focused competitions) 2024 to 2025
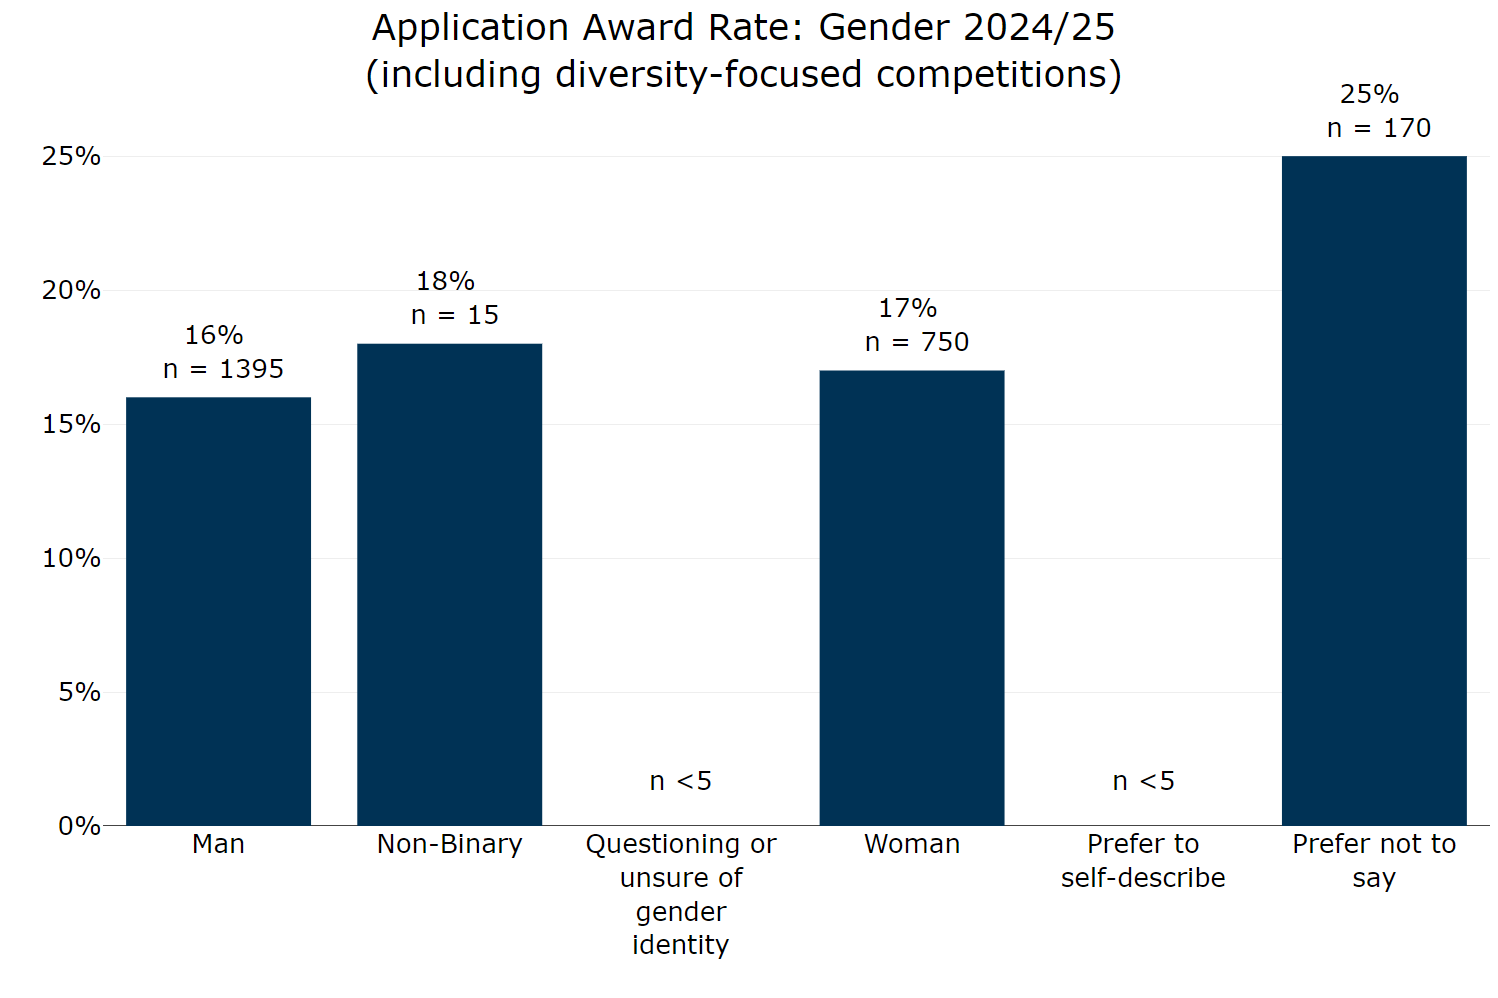
Figure 17 Application award rate by gender (including diversity-focused competitions) 2024 to 2025
Where diversity-focused competitions are included in the analysis, the application award rate is largely consistent between men (16%), women (17%) and non-binary (18%) applicants. Prefer not to say had the highest award rate at 25%.
For those reporting they were questioning or unsure of their gender identity and those preferring to self-describe there were too few successful applicants to calculate a meaningful award rate.
Figure 18: Application award rate by gender (excluding diversity-focused competitions) 2024 to 2025
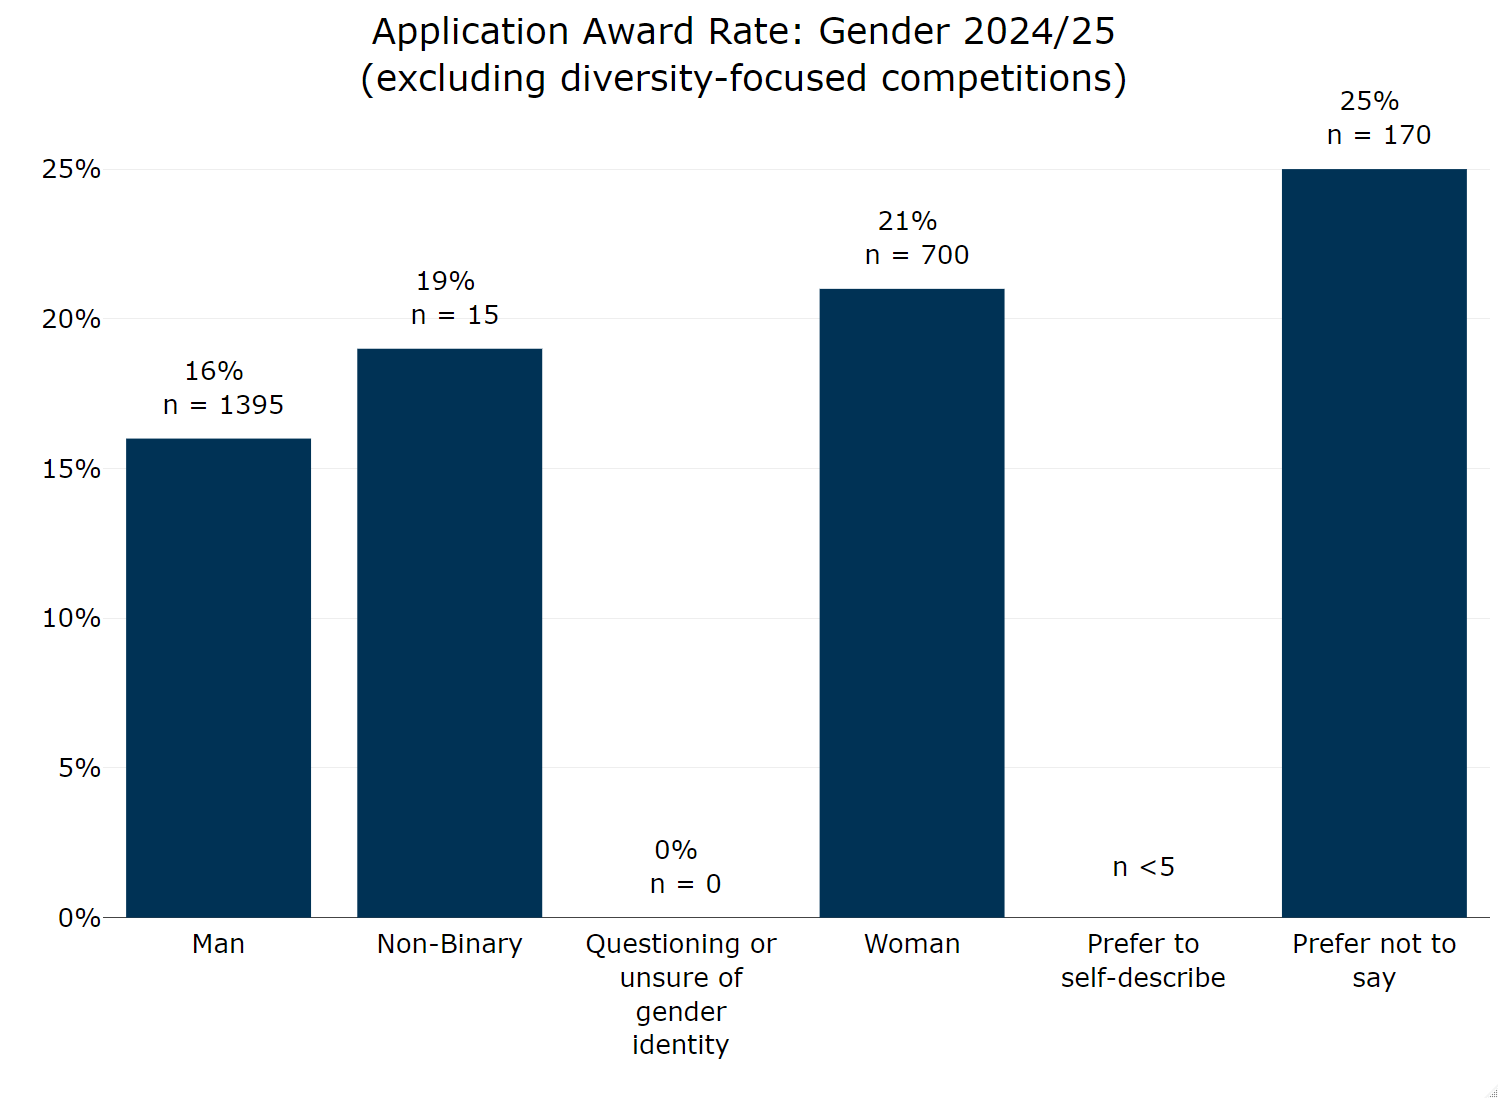
Figure 18 Application award rate by gender (excluding diversity-focused competitions) 2024 to 2025
When diversity-related competitions are excluded from the analysis, the award rate for women applicants increases from 17% to 21%, and non-binary applicants from 18% to 19%. This increase shows the effect of the highly popular Women in Innovation competition run during this reporting period, which attracted over 1400 applications and awarded funding to 50 successful applicants.
Socioeconomic background
Our diversity questionnaire asks about the occupation of the main household earner when the applicant was 14 years old. This is used as a proxy for measuring socioeconomic background, following guidance issued by the Social Mobility Commission.
Terminology to describe socioeconomic background is complex and we recognise that this can be an emotive topic. There are many different terms being used by different organisations across the UK. Innovate UK has adopted terminology approved by the government’s socioeconomic diversity and inclusion employer’s toolkit, and refers to socioeconomic background using three categories: Professional, Intermediate or Working-Class.
Within the survey, example occupations are provided which are then categorised into these three top-level groups. We recognise that a single question cannot capture the breadth and experiences of a person’s socioeconomic background, but capturing this data provides an indication that is important to inform actions relating to social mobility and inclusion.
The Social Mobility Commission has published a national benchmark for socioeconomic background, which reports the percentages of each of the three categories found in the working age population (16 years and over). According to the benchmark, 37% of the workforce are from a professional background, 24% from an intermediate background, and 39% from a working-class background.
Figure 19: Applicants by socioeconomic background 2024 to 2025
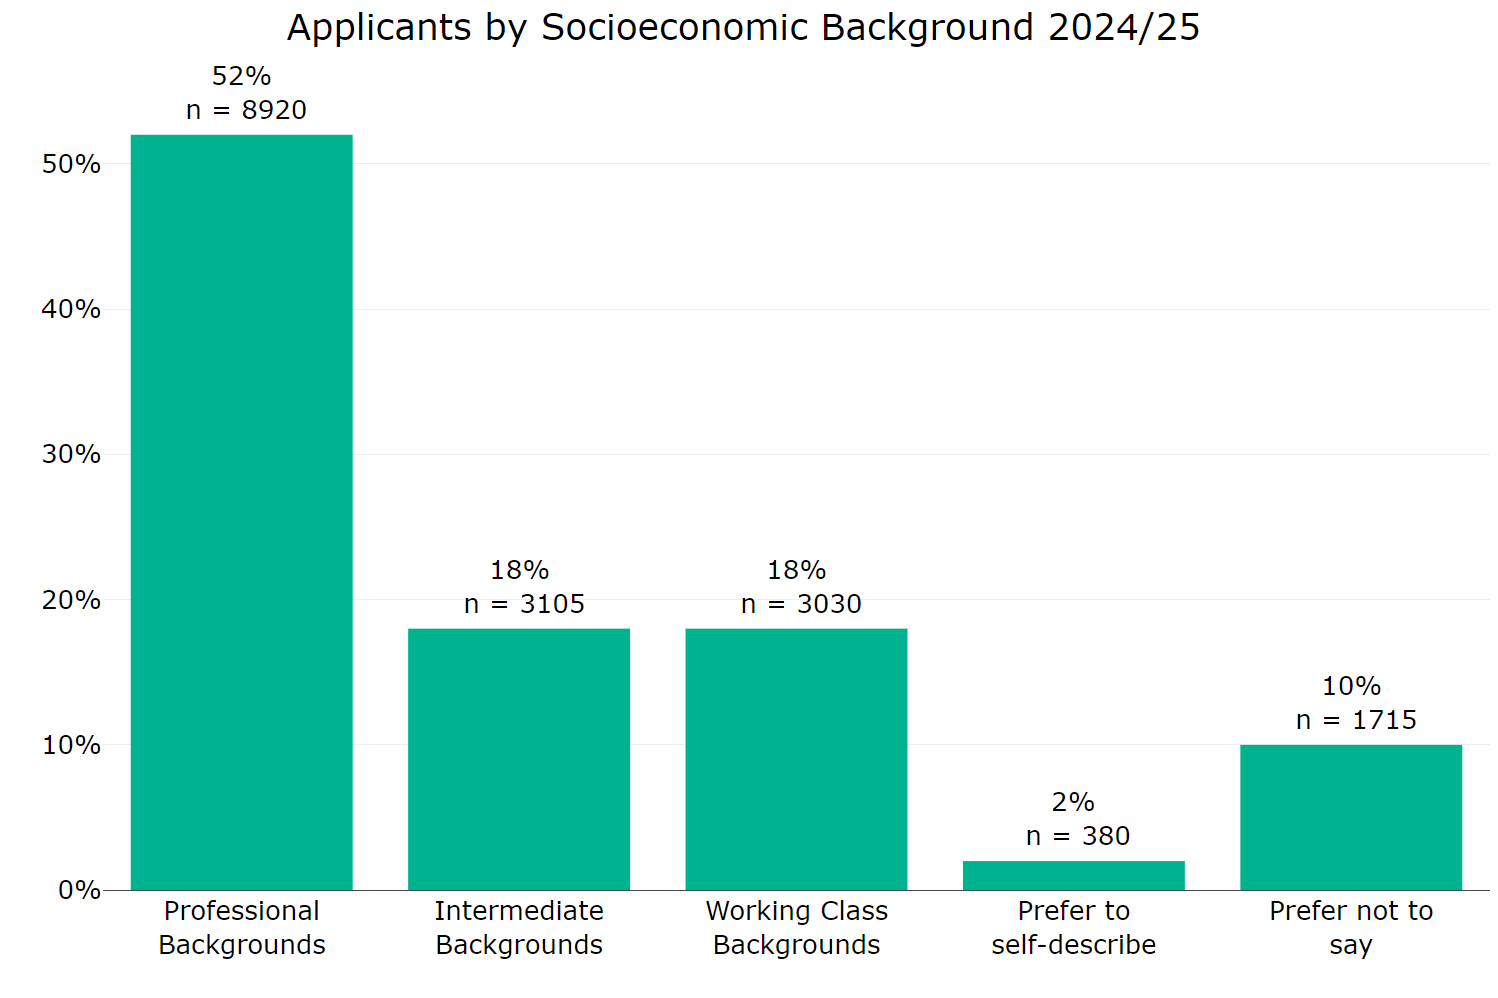
Figure 19 Applicants by socioeconomic background 2024 to 2025
Survey results reveal that 52% of applicants are from professional backgrounds, with 18% from intermediate backgrounds and 18% from working-class backgrounds. Around 2% preferred to self-describe and 10% preferred not to say.
Figure 20: Successful applicants by socioeconomic background 2024 to 2025
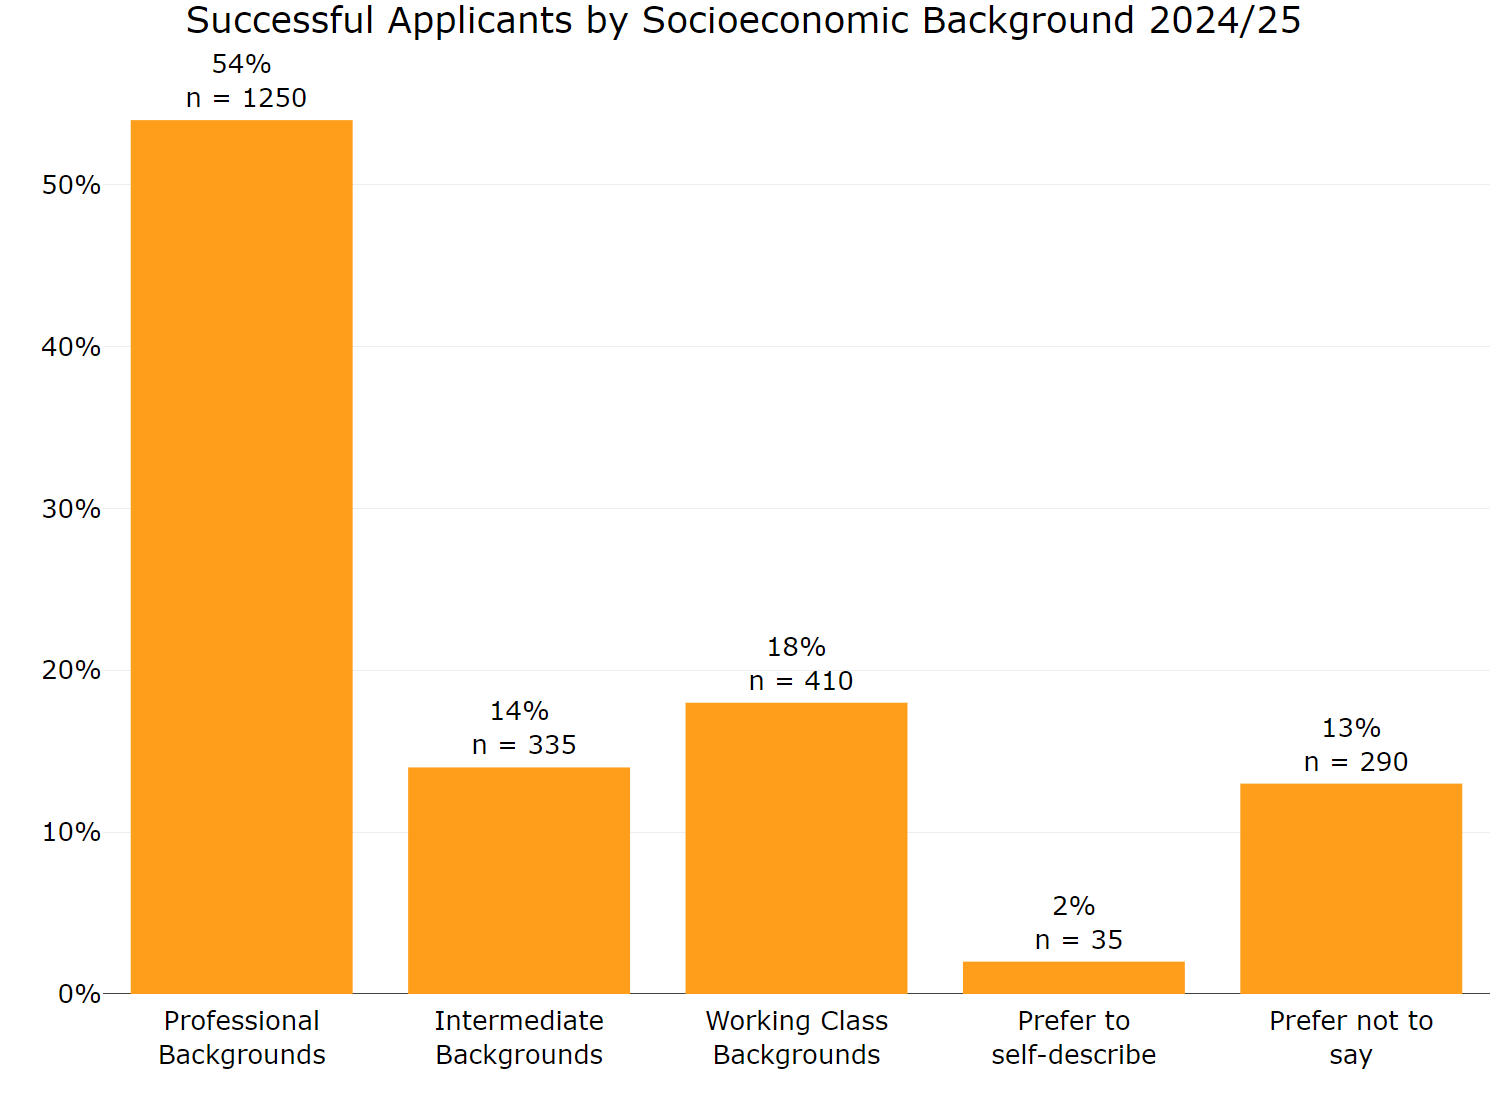
Figure 20 Successful applicants by socioeconomic background 2024 to 2025
Results from successful applicants reveal a similar breakdown, with 54% from professional backgrounds, 14% from intermediate backgrounds and 18% from working-class backgrounds. Of the successful applicants, 2% preferred to self-describe, and 13% preferred not to say.
The proportion of ‘prefer not to say’ responses (10 to 13%) is higher for this survey question compared with others (which are typically around five to 7%). This means that while these results may be broadly indicative of the applicant population, the extent of unknown data limits the strength of the conclusions we can make on socioeconomic background.
Figure 21: Application award rate by socioeconomic background 2024 to 2025
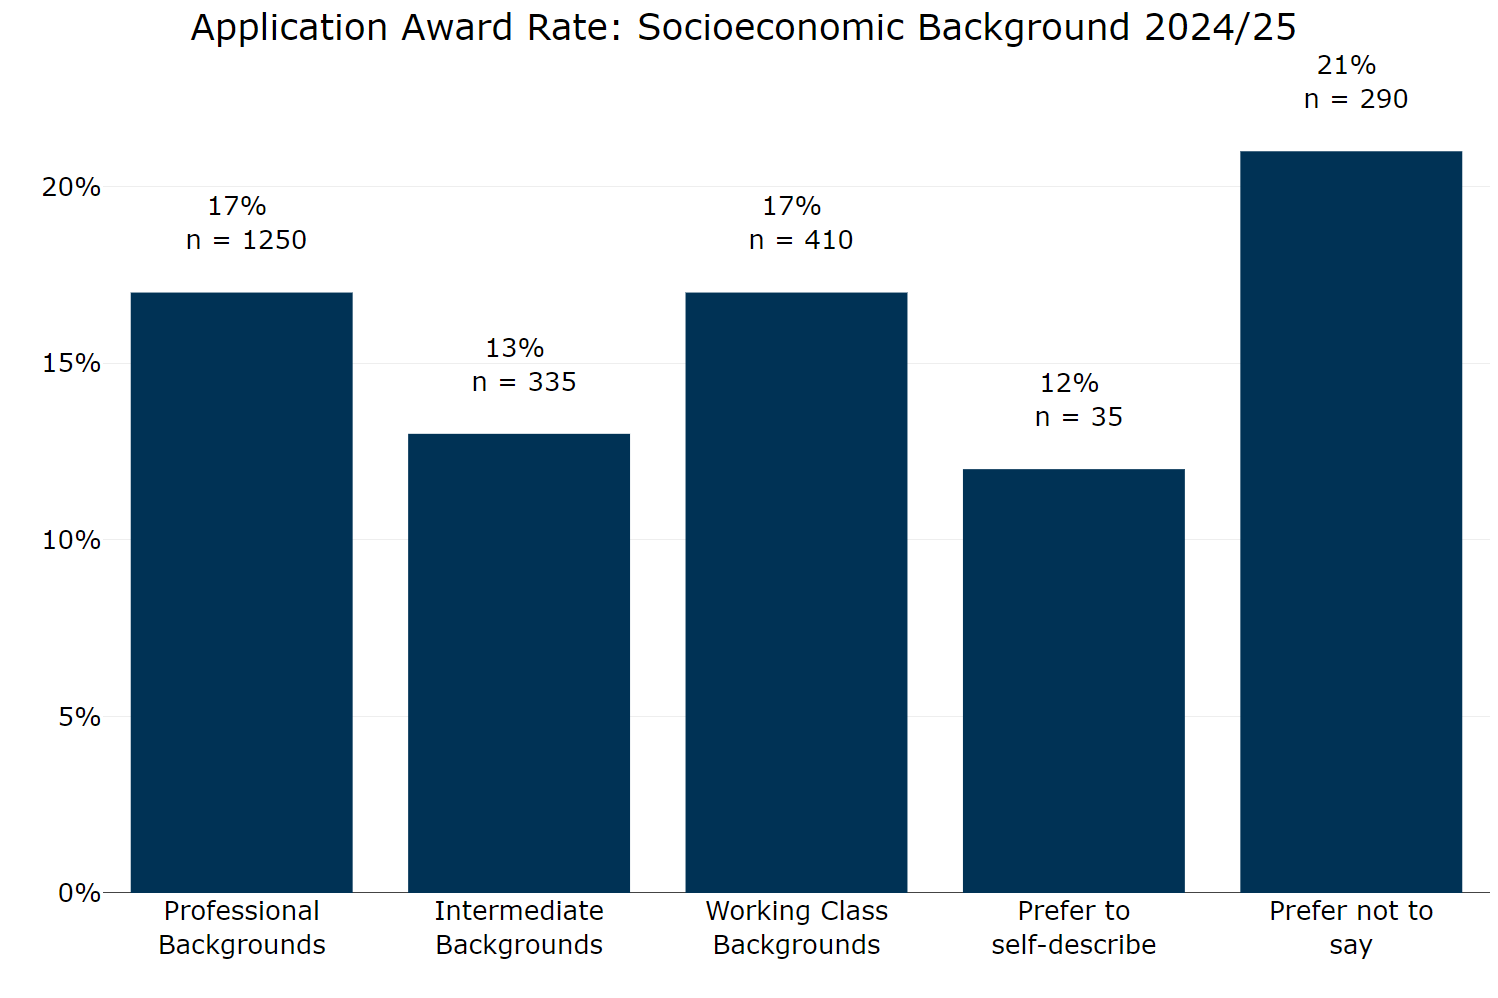
Figure 21 Application award rate by socioeconomic background 2024 to 2025
The calculated award rates for each group are 17% for professional and working-class backgrounds and 13% for intermediate backgrounds. Respondents who preferred to self-describe had an award rate of 12%, and those who preferred not to say had an award rate of 21%.
Annex A: Methodology
Glossary and definitions
Application
Any proposal submitted to Innovate UK via the Innovation Funding Service (IFS). All applications are submitted and managed by a lead participant (or lead partner) organisation.
Some applications can represent more than one organisation, where there are multiple partners applying as part of a consortium.
Applicant
Unless otherwise stated, the term ‘applicant’ used in this report refers to the individual fulfilling the lead contact role within the lead partner organisation.
As only data from the lead contact is represented in this report, this individual represents an entire application.
Eligibility assessment
Applications are mostly (but not always) subject to eligibility assessment to confirm that they comply with the acceptance criteria of the competition. For example within minimum and maximum funding limits per project, timescales and company size).
Applications that are non-compliant with the eligibility criteria are not subject to further assessment and the applicant informed.
Application assessment
Applications that pass relevant eligibility checks are then subject to the Innovate UK application assessment process, where applications are reviewed and scored by expert assessors.
Successful applications are those that are selected for funding. Due to high demand for some Innovate UK competitions, there are often a number of applications that are high scoring but do not go on to receive funding.
Read more about application and assessment.
Innovation Funding Service
Innovate UK’s online application and grant management platform. Diversity data is collected in IFS via a survey which is separate from the application.
Lead contact
A nominated individual within the lead participant organisation that submits and manages the Innovate UK project application. This individual is required to complete the diversity survey.
All other individuals involved in the project are encouraged, but not required to complete the survey. Results presented in this report represent data from the lead contact only.
Lead participant and partner organisation
The organisation leading the application process, for collaborative projects the lead participant coordinates the application preparation and submission process on behalf of the project consortium.
Collaborator or partner organisations
The organisations partnering on and co-delivering an Innovate UK project. Currently partner organisations are encouraged but not required to complete a diversity survey.
Methodology and technical notes
What we report on
The data analysed in this report is associated with the lead applicant for an application to Innovate UK. The report covers applications submitted to Innovate UK’s funding platform, the IFS between 1 April 2023 to 31 March 2025. We cover two years of application data in this report. The main body covers the period from April 2024 to March 2025, the period from April 2023 to March 2024 is covered in Annex B.
Survey data is included in a reporting year period based on the date at which application assessment was completed. This is to ensure that all applications relating to a competition are captured within the same reporting year. If an application was not subject to onward assessment the competition close date is used to determine the financial year period.
This report aims to capture as much data as possible about applicants and successful applicants to Innovate UK:
Applicants
We report diversity characteristics of all lead applicants, this includes those that did not pass eligibility assessment and those that were not subject to onward assessment. This expands the sample used compared with the 2022 to 2023 report.
Successful applicants
Successful applicants are those that went on to receive funding from Innovate UK, having passed eligibility and quality assessment and where sufficient budget was available.
Award rate
A percentage calculated by dividing the number of funded applicants by the total number that were subject to eligibility and quality assessment.
Any applications that failed eligibility assessment or were not subject to application assessment are omitted from the award rate calculations.
An individual’s data is captured every time an application is submitted, meaning that if they submit multiple applications within the year, they appear multiple times in the data. As an individual’s diversity characteristics are linked to an application, the result of each application they submit is of interest. Additionally, it can be expected that some diversity characteristics may change with time, therefore reporting as many data points as are available is important.
Currently Innovate UK collects data on at least one individual per application, representing as a minimum the lead contact within the lead partner organisation. Other individuals (within both the lead and partner organisations, where applicable) are encouraged, but not required to submit the survey. This means that survey coverage is complete for the lead contact, but incomplete for all other profiles.
Innovate UK does not currently collect data on the roles of individuals within organisations applying for innovation projects and therefore the data presented is not reflective of a particular role within a business (such as the founder or CEO).
Rounding and suppression
Results for groups between one and four individuals are supressed. Counts of five or more are rounded to the nearest multiple of five. Counts of zero are shown.
Percentages are calculated based on unrounded numbers and then rounded to the nearest whole number.
Other exclusions
Other exclusions within the data include:
- applications to any programmes that did not use IFS
- any competition which did not hold its funding decision meeting within the specified financial years of 2023 to 2024 or 2024 to 2025
- applications relating to Horizon Europe Guarantee funding, as the funding decision had been pre-approved prior to using IFS
- applications relating to Investor Selection as part of the Investor Partnerships programme. These applications reflect investors, not innovators.
Description of variables
Age
Applicants are asked: What is your date of birth?
Results are based on the applicant’s date of birth and the date of application submission. They are presented as:
- 18 to 24
- 25 to 34
- 35 to 49
- 50 to 64
- 65+
- Prefer not to say (where date of birth was not provided)
Innovate UK applicants must be 18 years old or over to apply for support. There are a number of cases where the submitted date of birth is implausible or impossible (for example more than 100 years ago, or a date in the future). To avoid the case where the wrong date has been entered, we only include those between 18 and 100 years.
Condition, illness or disability
Applicants are asked: Do you consider yourself to have any conditions, illnesses or disabilities that act as a substantial or long-term barrier to carrying out day-to-day activities?
Applicant guidance: A ‘substantial or long-term barrier’ is legally defined as ‘12 months or more’.
Day-to-day activities could include:
- travelling for work
- using computers
- stakeholder interactions
- time management
- other relevant activities
The conditions, illnesses or disabilities do not need to be medically diagnosed.
Responses are presented as:
- Yes
- No
- Prefer not to say
Respondents may choose to provide additional details about any conditions, illnesses or disabilities if they wish.
Educational background
Applicants are asked: What is the highest educational qualification you have obtained?
Applicant guidance: Select the most advanced of the highest academic or professional award that you have received.
Responses are presented as:
- No formal qualifications
- GCSEs or equivalent
- AS and A level or equivalent
- NVQ or equivalent
- Apprenticeship
- Bachelor’s degree
- Master’s degree
- Doctoral degree
- Professional qualification
- Prefer to self-describe
- Prefer not to say
Ethnicity
Applicants are asked: What is your ethnicity or ethnic group?
Applicant guidance: Your ethnic group could be your cultural or family background and should be the option you most closely identify with.
Responses are presented as follows:
- Arab
- Asian (including Asian British)
- Black (including Black British)
- Latino Hispanic
- Mixed or Multiple Ethnic groups
- White
- Prefer to self-describe
- Prefer not to say
Respondents may choose to provide additional details about their ethnic background within each group, if they wish.
Gender
Applicants are asked the following: What is your gender?
Applicants are provided with the following guidance: For this question you are asked about your gender, which may reflect a combination of gender identity, expression or experience. Gender refers to your current gender, which may be different to sex recorded at birth and may be different to what is indicated on legal documents.
Responses are presented as:
- Man
- Non-binary
- Questioning or unsure of gender identity
- Woman
- Prefer to self-describe
- Prefer not to say
The ‘Questioning’ response option was added part way through the 2023 to 2024 period, in November 2023, so only reflects six months of application data for this year.
Socioeconomic background
Applicants are asked: What was the occupation of the main earner in your householder when you were aged 14?
Respondents selected the most appropriate option from the occupation types listed below. Innovate UK has adopted terminology approved by the government’s socioeconomic diversity and inclusion employer’s toolkit, and groups example occupations into three top-level categories.
Professional background
Modern professional and traditional professional occupations, for example:
- teacher
- nurse
- social worker
- musician
- police sergeant
- software designer
- accountant
- solicitor
- medical practitioner
- scientist
- engineer
Managers or administrators, including senior, middle or junior managers, for example:
- finance manager
- chief executive
- large business owner
- office manager
- retail manager
- bank manager
- Intermediate background
Intermediate background
Small business owners who employed less than 25 people, for example:
- corner shop owners
- small plumbing companies
- retail shop owner
- single restaurant or cafe owner
- taxi owner
- garage owner
Clerical and intermediate occupations, for example:
- secretary
- personal assistant
- call centre agent
- clerical worker
- nursery nurse
Working class background
Manual and service occupations, including routine or semi-routine occupations, for example:
- postal worker
- machine operative
- security guard
- caretaker
- farmworker
- sales assistant
- HGV driver
- cleaner
- hairdresser
- waiter or waitress
Technical and craft occupations, for example:
- motor mechanic
- plumber
- printer
- electrician
- gardener
- train driver
Long-term unemployed (claimed Jobseeker’s Allowance or earlier unemployment benefit for more than a year).
Respondents could also elect to prefer to self-describe, for example where occupations were:
- retired
- student
- this question does not apply to me
- I don’t know
Additionally, respondents could elect to prefer not to say.
Annex B: Results 2023 to 2024
This section of the report represents diversity data from over 19,000 applicants in the period between 1 April 2023 and 31 March 2024.
Age
Figure 1 Annex B: Applicants by age group 2023 to 2024
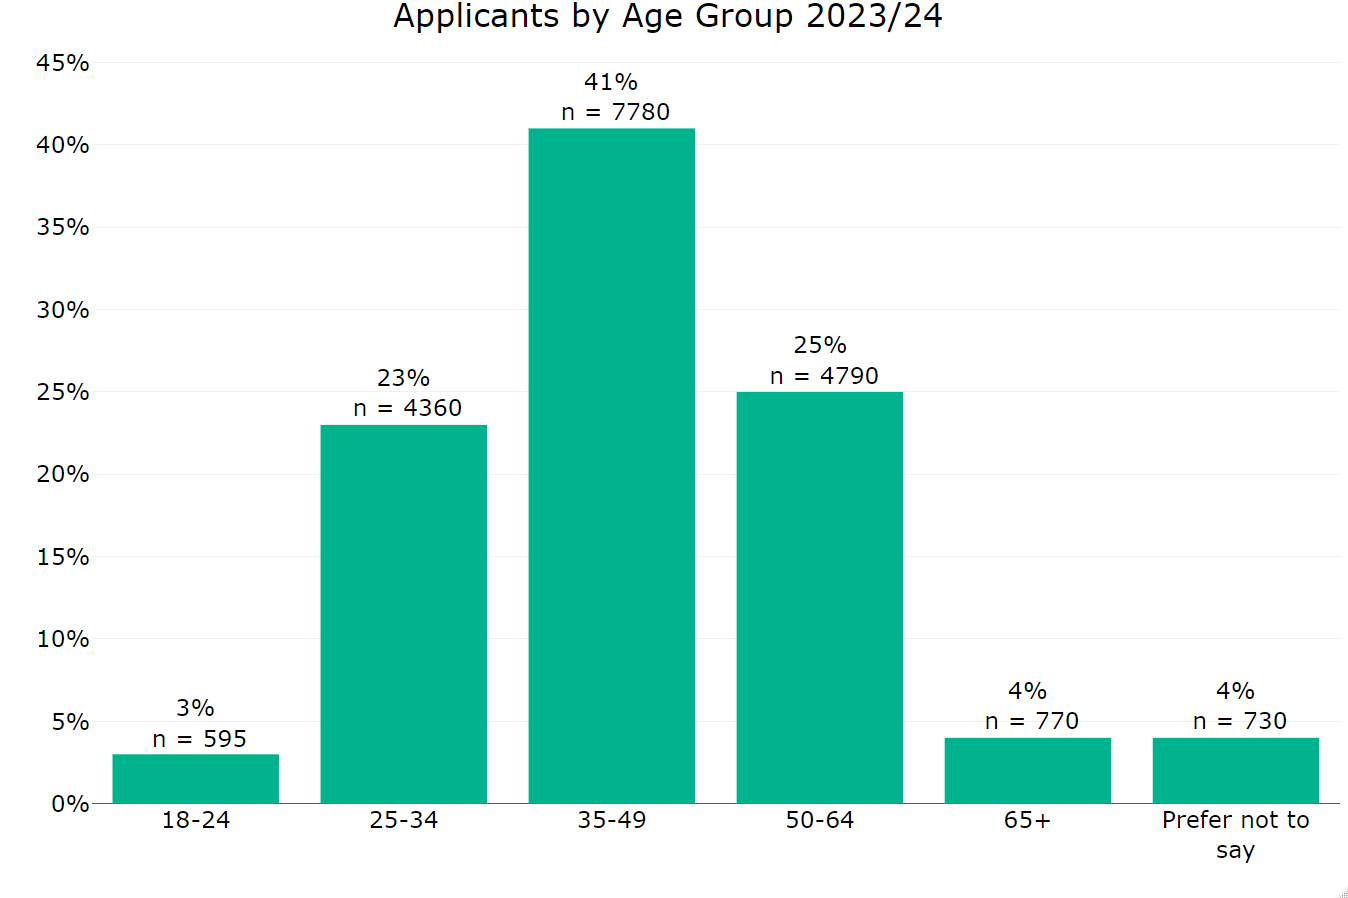
Figure 1 Annex B: Applicants by age group 2023 to 2024
The graph shows that the highest proportion of applicants are aged 35 to 49, with 41%. This is followed by:
- 25% aged 50 to 64
- 23% aged 25 to 34
- 4% aged 65 and over
- 3% aged 18 to 24
- 4% that did not disclose their date of birth
Figure 2 Annex B: Successful applicants by age group 2023 to 2024
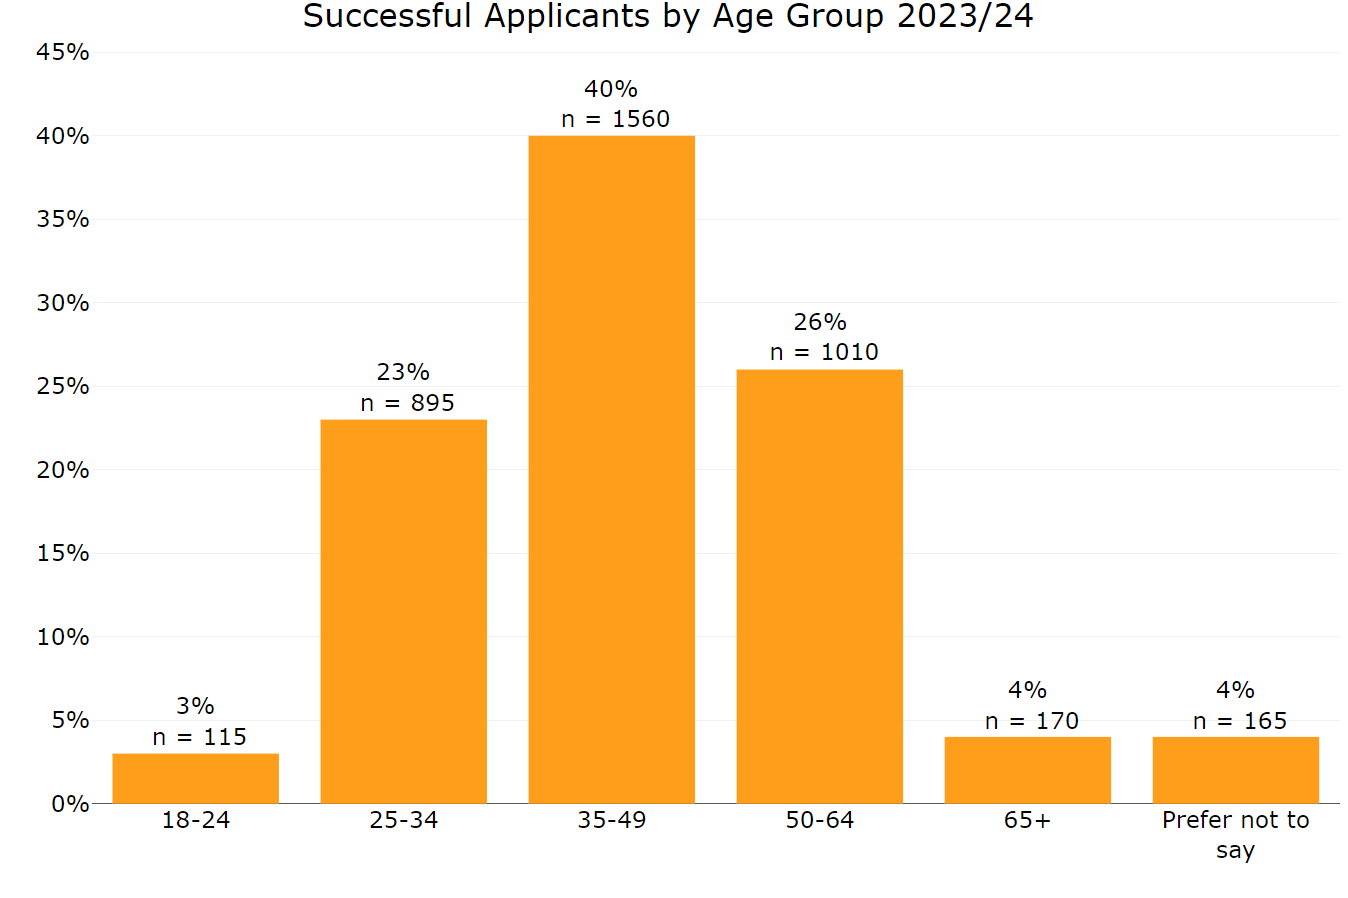
Figure 2 Annex B: Successful applicants by age group 2023 to 2024
For the applicants that were successful, this pattern is consistent with:
- 40% aged 35 to 49
- 26% aged 50 to 64
- 23% aged 25 to 34
- 4% aged 65 and over
- 3% aged 18 to 24
- 4% did not disclose their date of birth
Figure 3 Annex B: Application award rate by age group 2023 to 2024
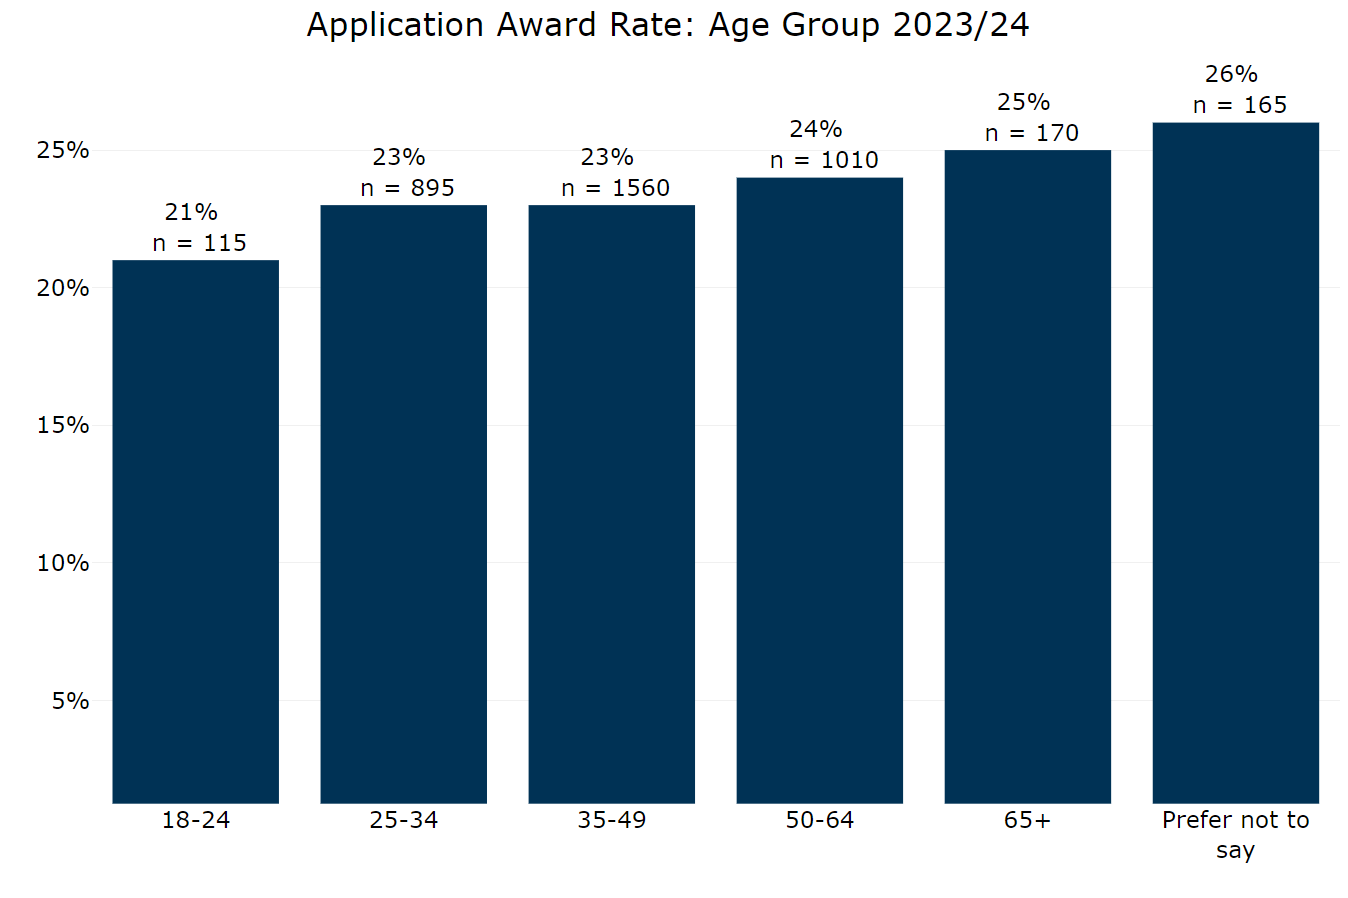
Figure 3 Annex B: Application award rate by age group 2023 to 2024
Application award rates are highest for the ‘prefer not to say’ group at 26%, followed by:
- 65 plus at 25%
- 50 to 64 at 24%
- 35 to 49 at 23%
- 25 to 34 at 23%
- 18 to 24 at 21%
Conditions, illnesses or disabilities
Figure 4 Annex B: Applicants by conditions, illnesses or disabilities 2023 to 2024
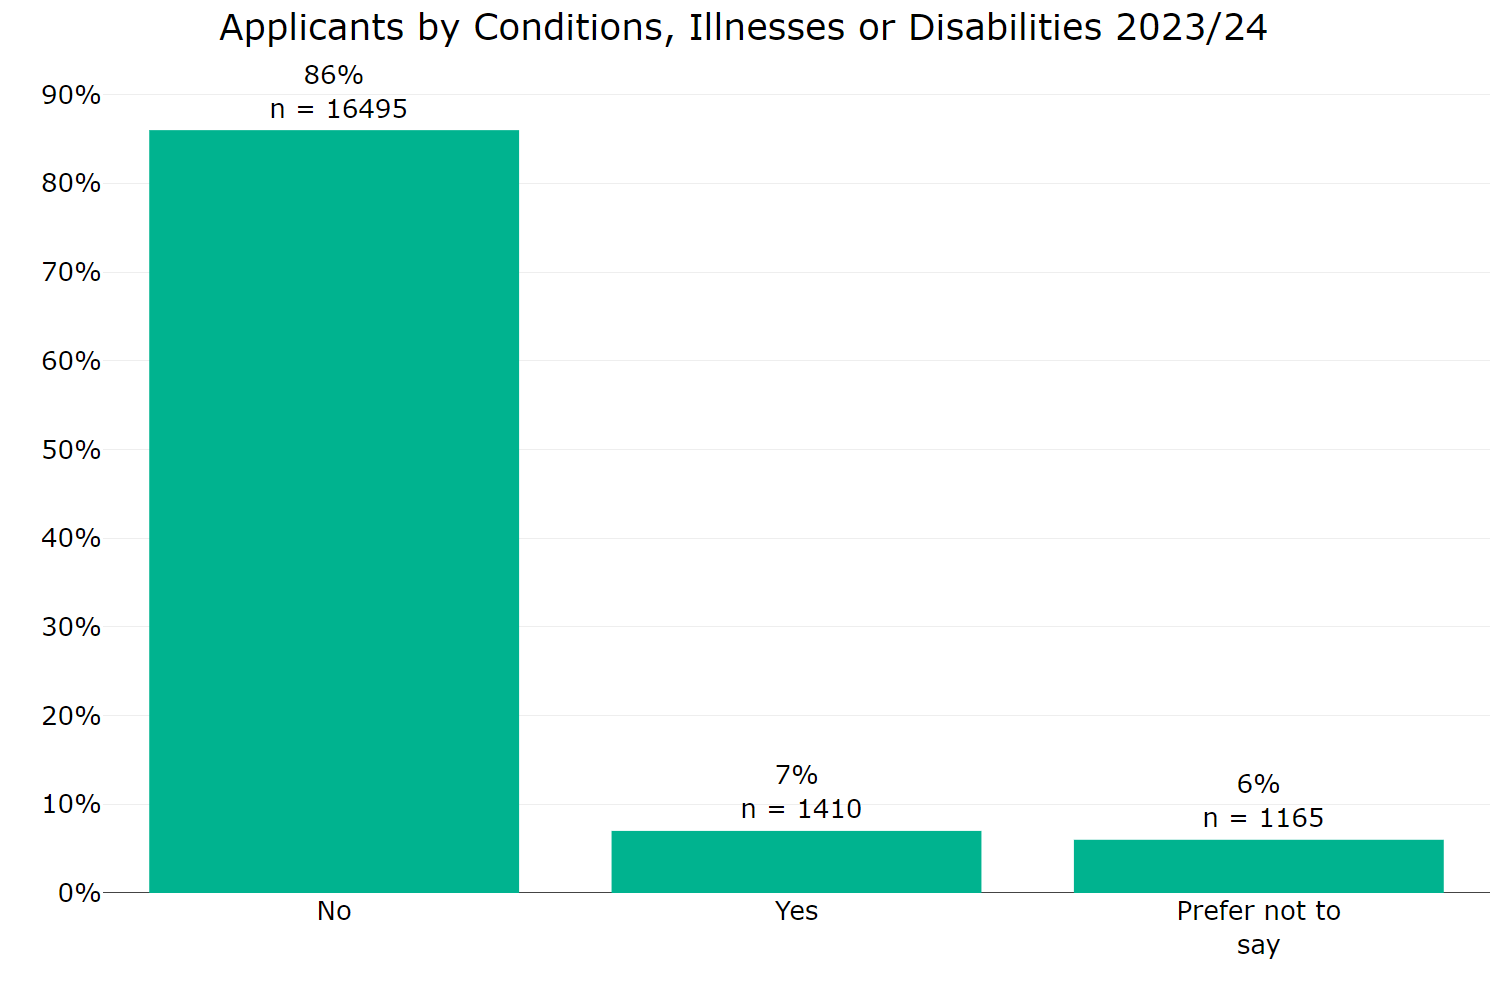
Figure 4 Annex B: Applicants by conditions, illnesses or disabilities 2023 to 2024
Survey respondents were asked whether they considered themselves to have any conditions, illnesses or disabilities that act as a substantial or long-term barrier to carrying out day-to-day activities. Results show that 86% of applicants responded ‘No’ to this question, 7% reported ‘Yes’ and 6% preferred not to say.
Figure 5 Annex B: Successful applicants by conditions, illnesses or disabilities 2023 to 2024

Figure 5 Annex B: Successful applicants by conditions, illnesses or disabilities 2023 to 2024
Similarly, for successful applicants, 88% reported ‘No’, 6% reported ‘Yes’ and 7% preferred not to say.
Figure 6 Annex B: Application award rate by conditions, illnesses or disabilities 2023 to 2024
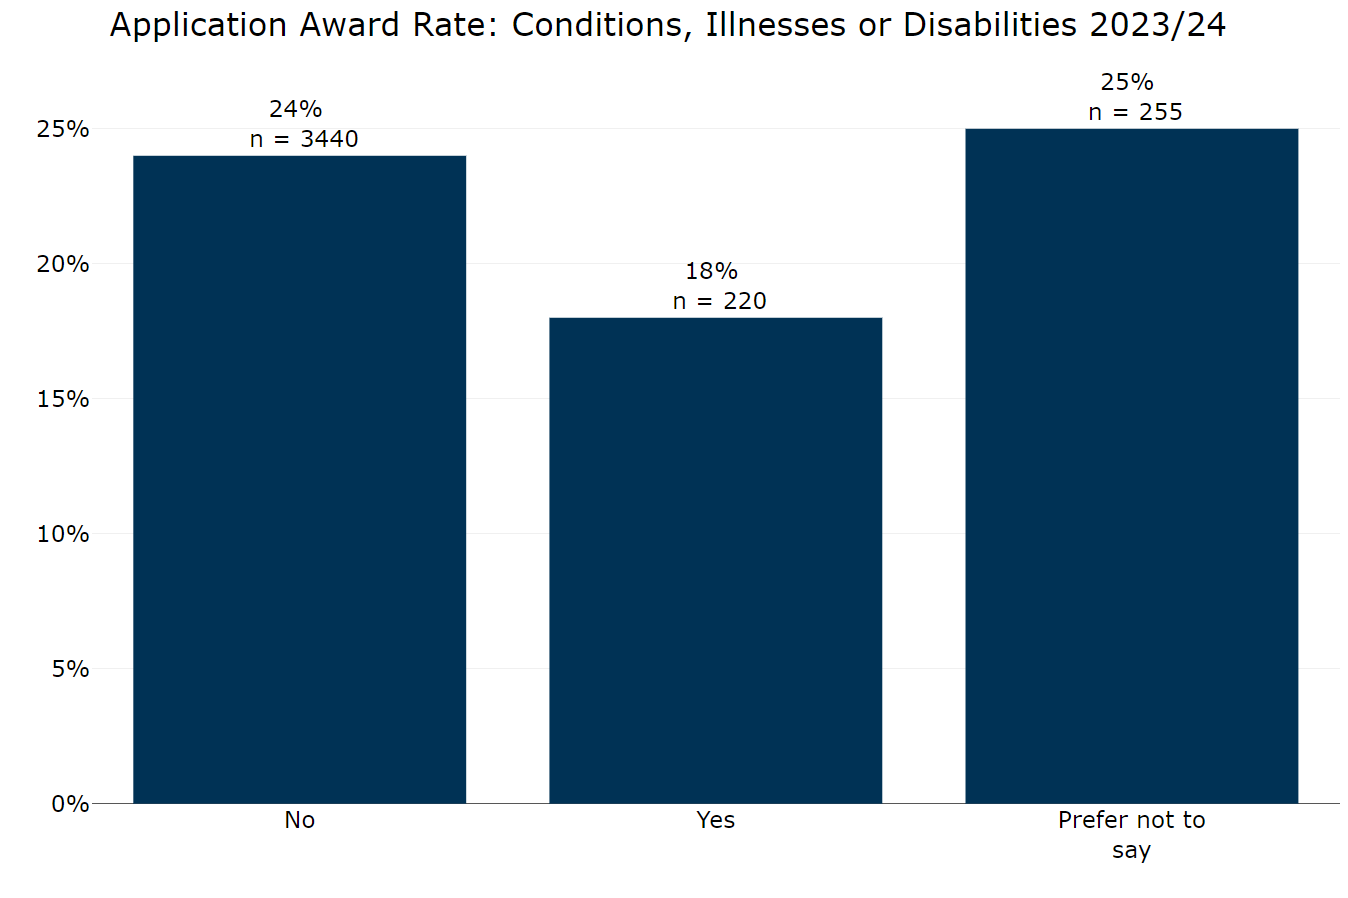
Figure 6 Annex B: Application Award Rate by conditions, illnesses or disabilities 2023 to 2024
Application award rate was highest for the ‘prefer not to say’ group at 25%, followed by those reporting ‘no’ at 24% and those reporting ‘yes’ at 18%
Educational background
Figure 7 Annex B: Applicants by educational background 2023 to 2024
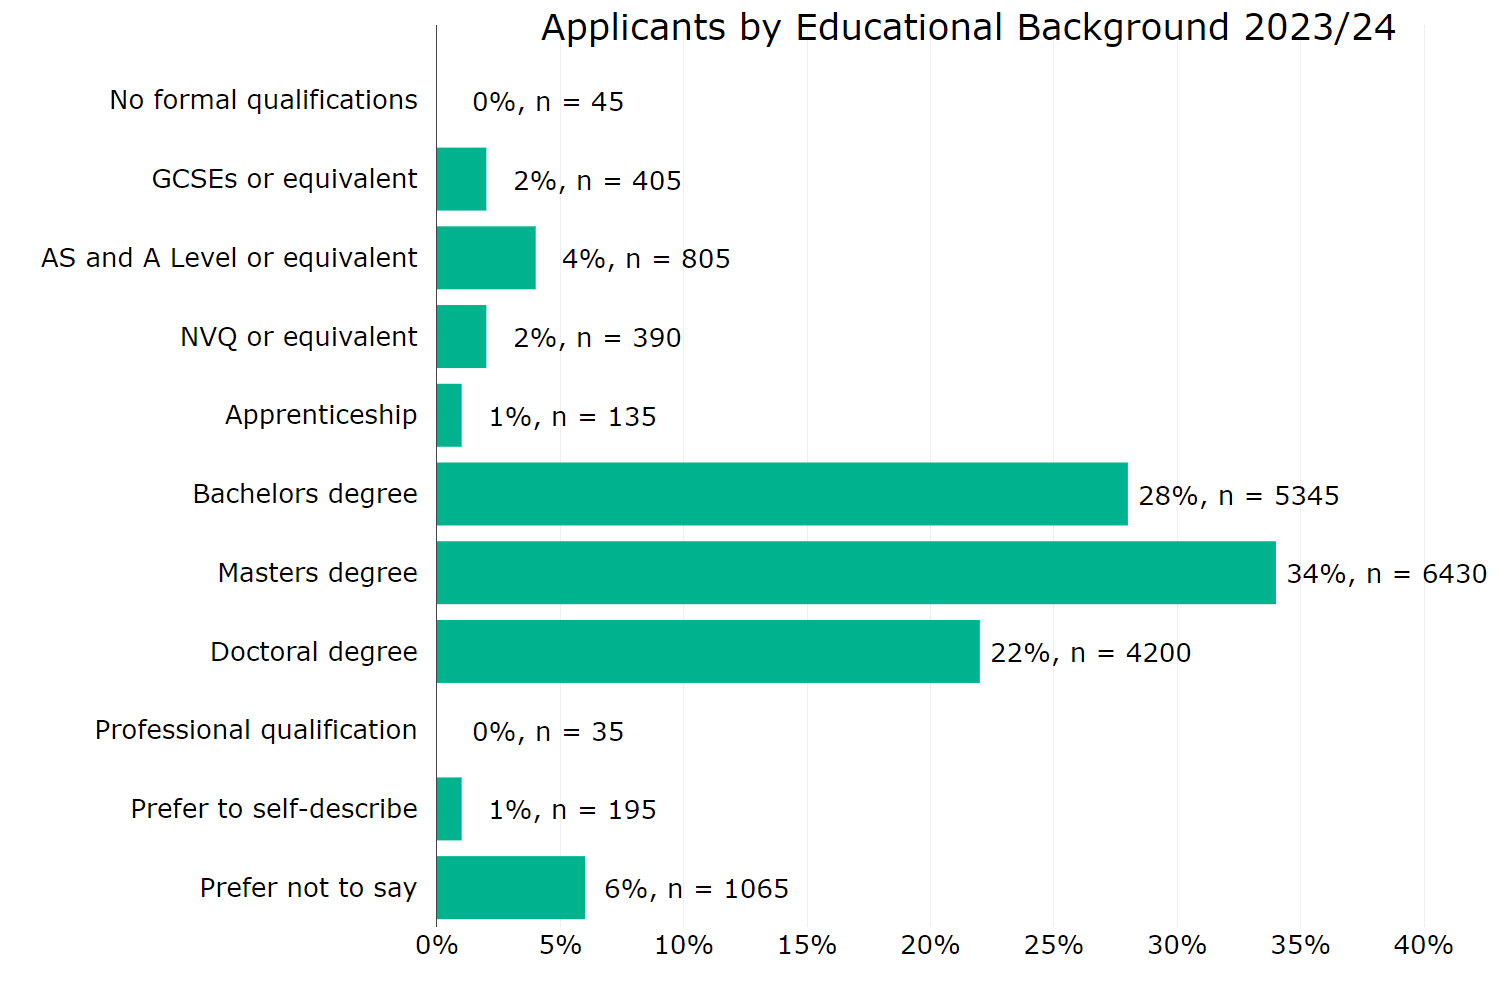
Figure 7 Annex B: Applicants by educational background 2023 to 2024
Figure 7 Annex B: Applicants by educational background 2023 to 2024
Around 84% of applicants had a degree-level qualification, with 28% reporting a bachelor’s degree, 34% a master’s degree and 22% a doctoral degree. Followed by:
- AS and A levels (or equivalent) 4%
- GCSEs or NVQs (or equivalent) 2%
- Apprenticeship 1%
- less than 1% for no formal qualifications and professional qualifications
- prefer to self-describe 1%
- prefer not to say 6%
Figure 8 Annex B: Successful applicants by educational background 2023 to 2024
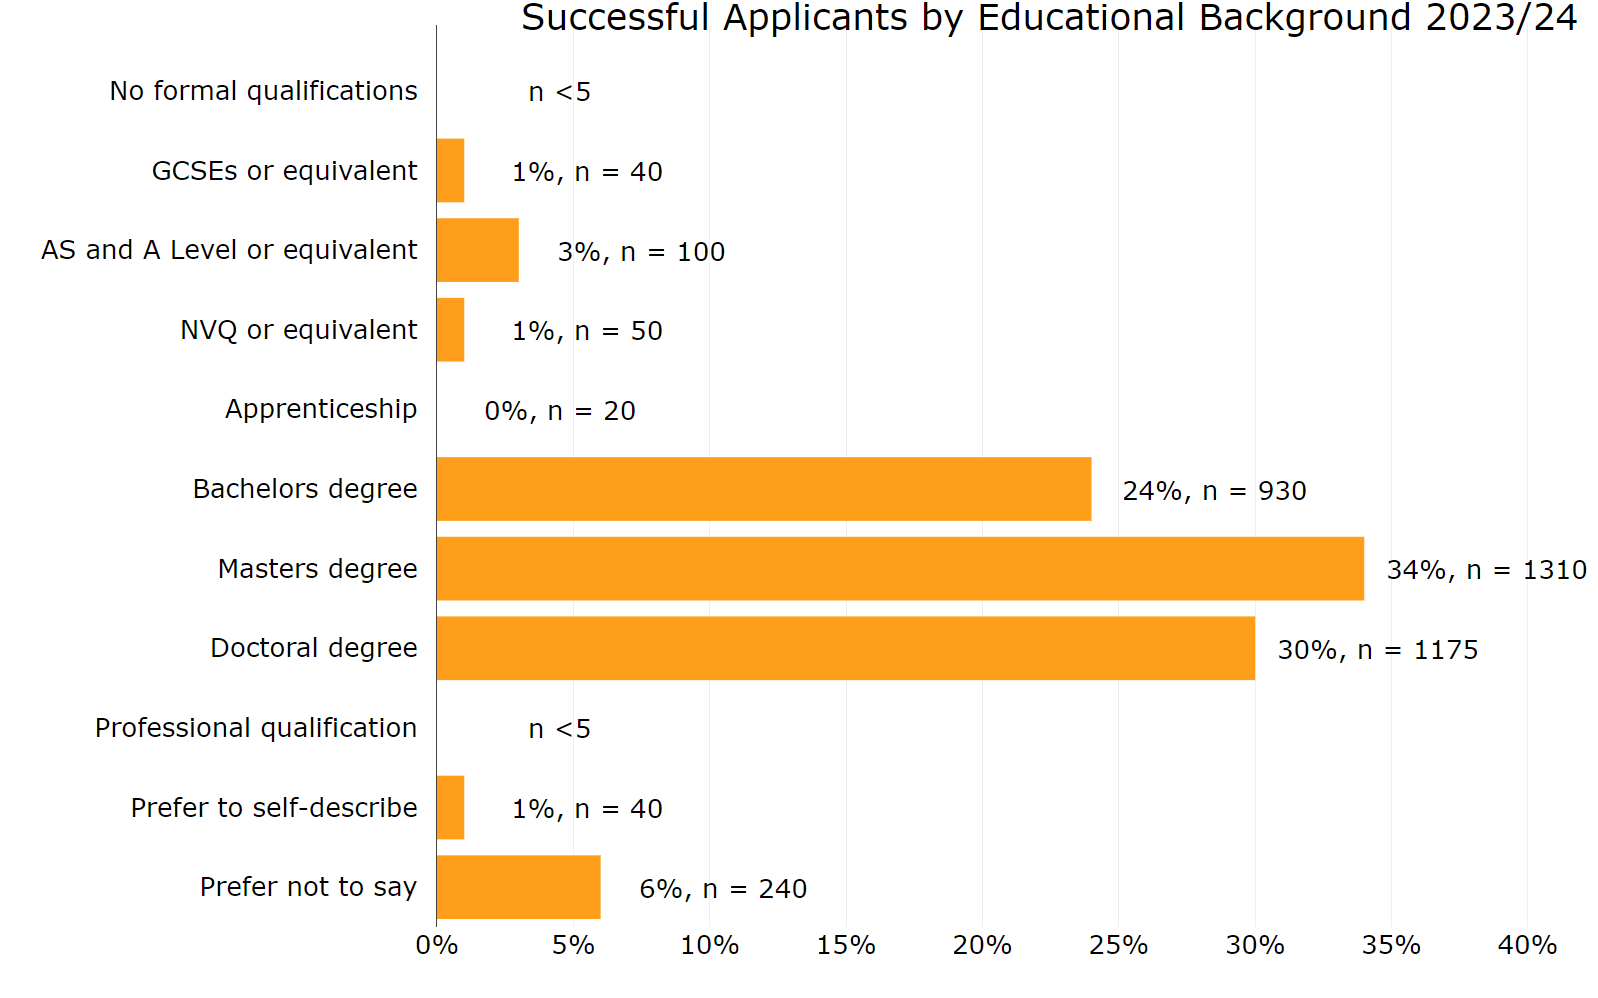
Figure 8 Annex B: Successful applicants by educational background 2023 to 2024
Figure 8 Annex B: Successful applicants by educational background 2023 to 2024
In terms of successful applicants, 24% had a bachelor’s degree, 34% a master’s degree and 30% a doctoral degree. Compared with:
- 3% with AS and A level (or equivalent) qualifications
- 1% with GCSEs or NVQ (or equivalent) qualifications
- less than 1% with an apprenticeship
- 1% preferring to self-describe
- 6% preferring not to say
There were fewer than five successful applicants for both those with no formal qualifications and those with professional qualifications, so these are not reported.
Figure 9 Annex B: Application award rate by educational background 2023 to 2024
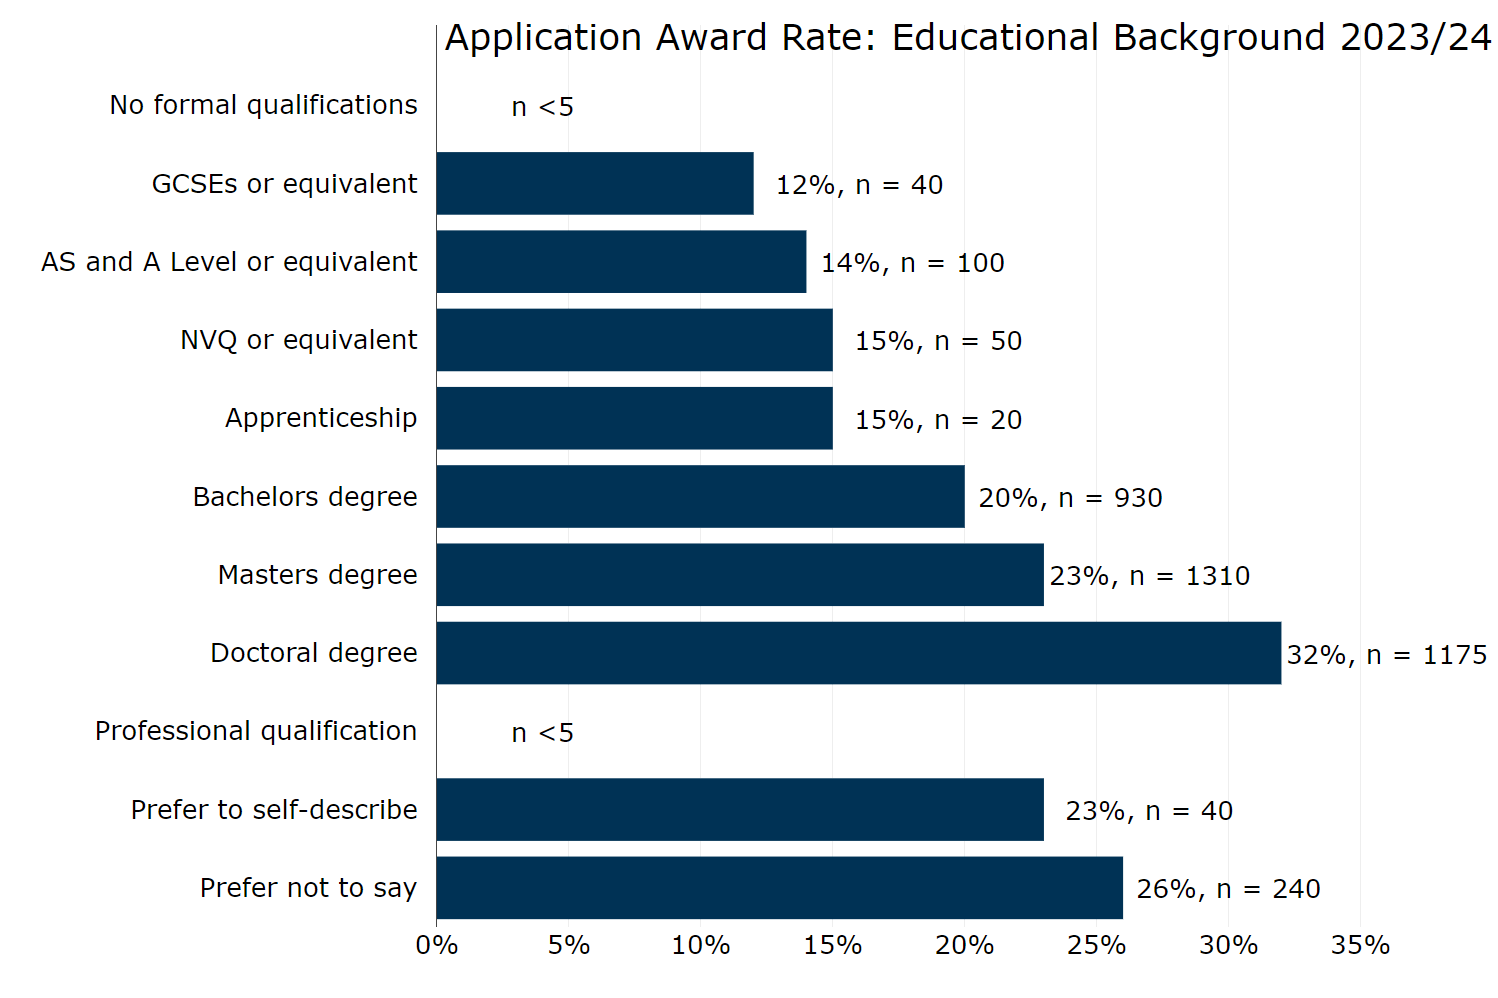
Figure 9 Annex B: Application award rate by educational background 2023 to 2024
Figure 9 Annex B: Application award rate by educational background 2023 to 2024
Applicants with doctoral degrees have the highest award rate at 32%, compared to applicants:
- with a master’s degree at 23%
- with a bachelor’s degree at 20%
- with an NVQ (or equivalent) or apprenticeship at 15%
- with an AS and A level (or equivalent) qualification at 14%
- with GCSEs (or equivalent) qualification at 12%
- who preferred not to say 26%
- who preferred to self-describe at 23%
There were too few applicants with no formal qualifications or professional qualifications to calculate an award rate.
Ethnicity
Figure 10 Annex B: Applicants by ethnicity 2023 to 2024
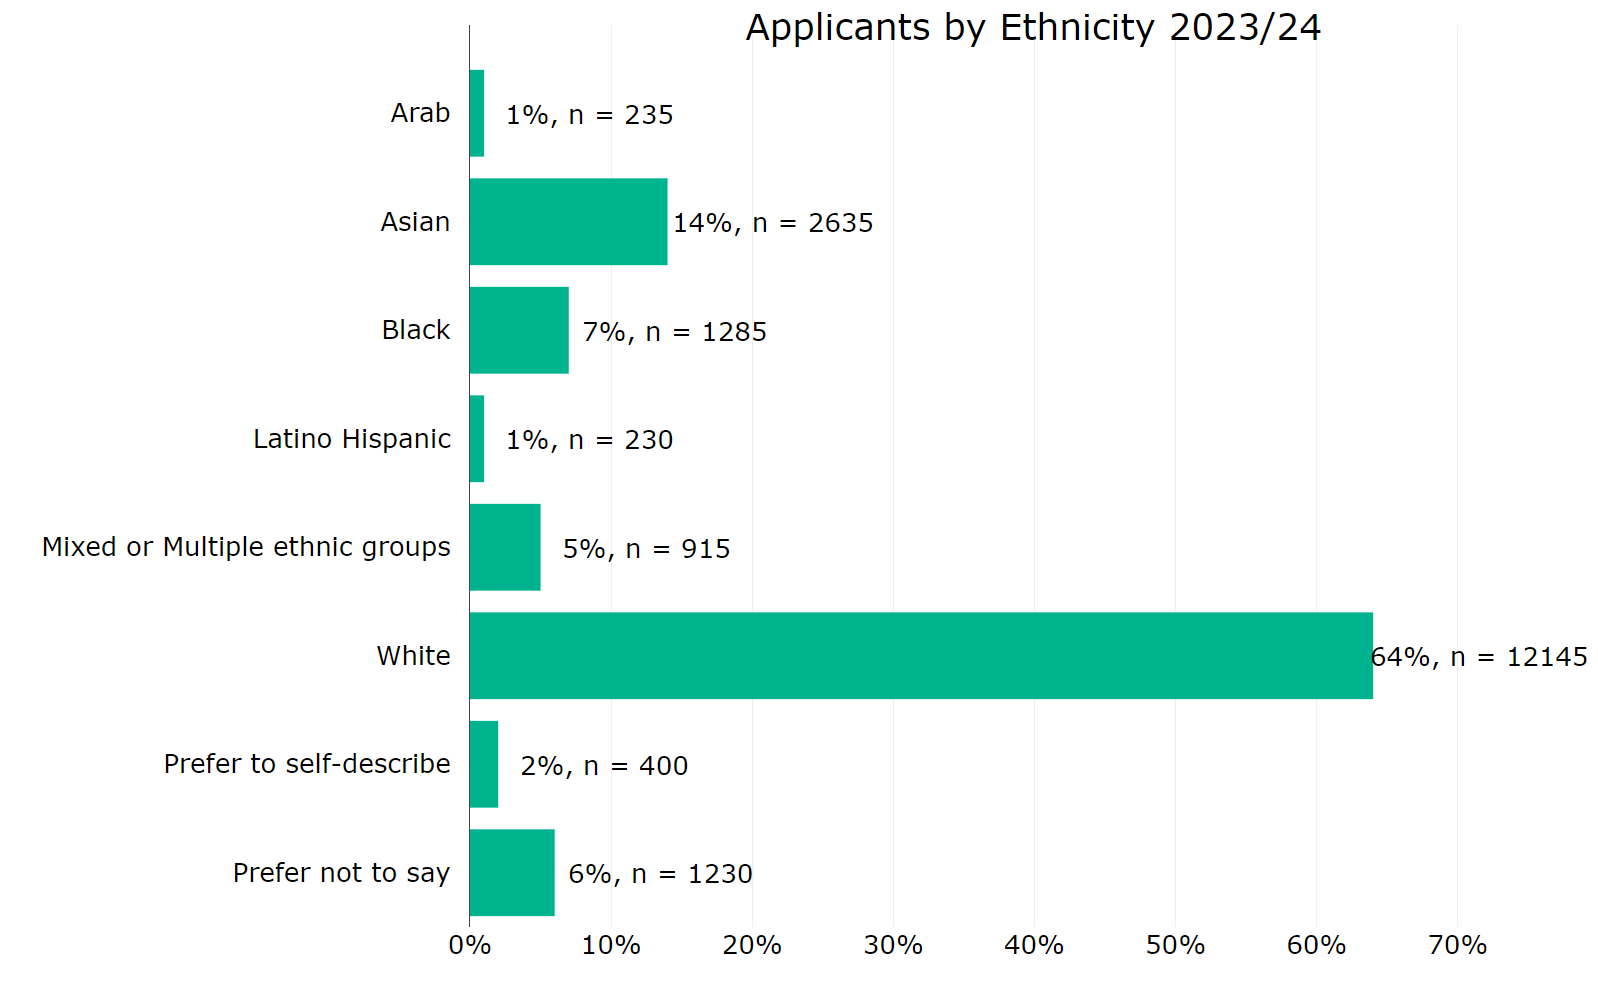
Figure 10 Annex B: Applicants by ethnicity 2023 to 2024
Of applicants applying for funding:
- 64% identified as White
- 14% identified as Asian (including Asian British)
- 7% identified as Black (including Black British)
- 5% identified as having Mixed or multiple ethnicities
- 1% identified as Arab
- 1% identified as Latino Hispanic
- 2% preferred to self-describe
- 6% preferred not to disclose their ethnicity
Figure 11 Annex B: Successful applicants by ethnicity 2023 to 2024
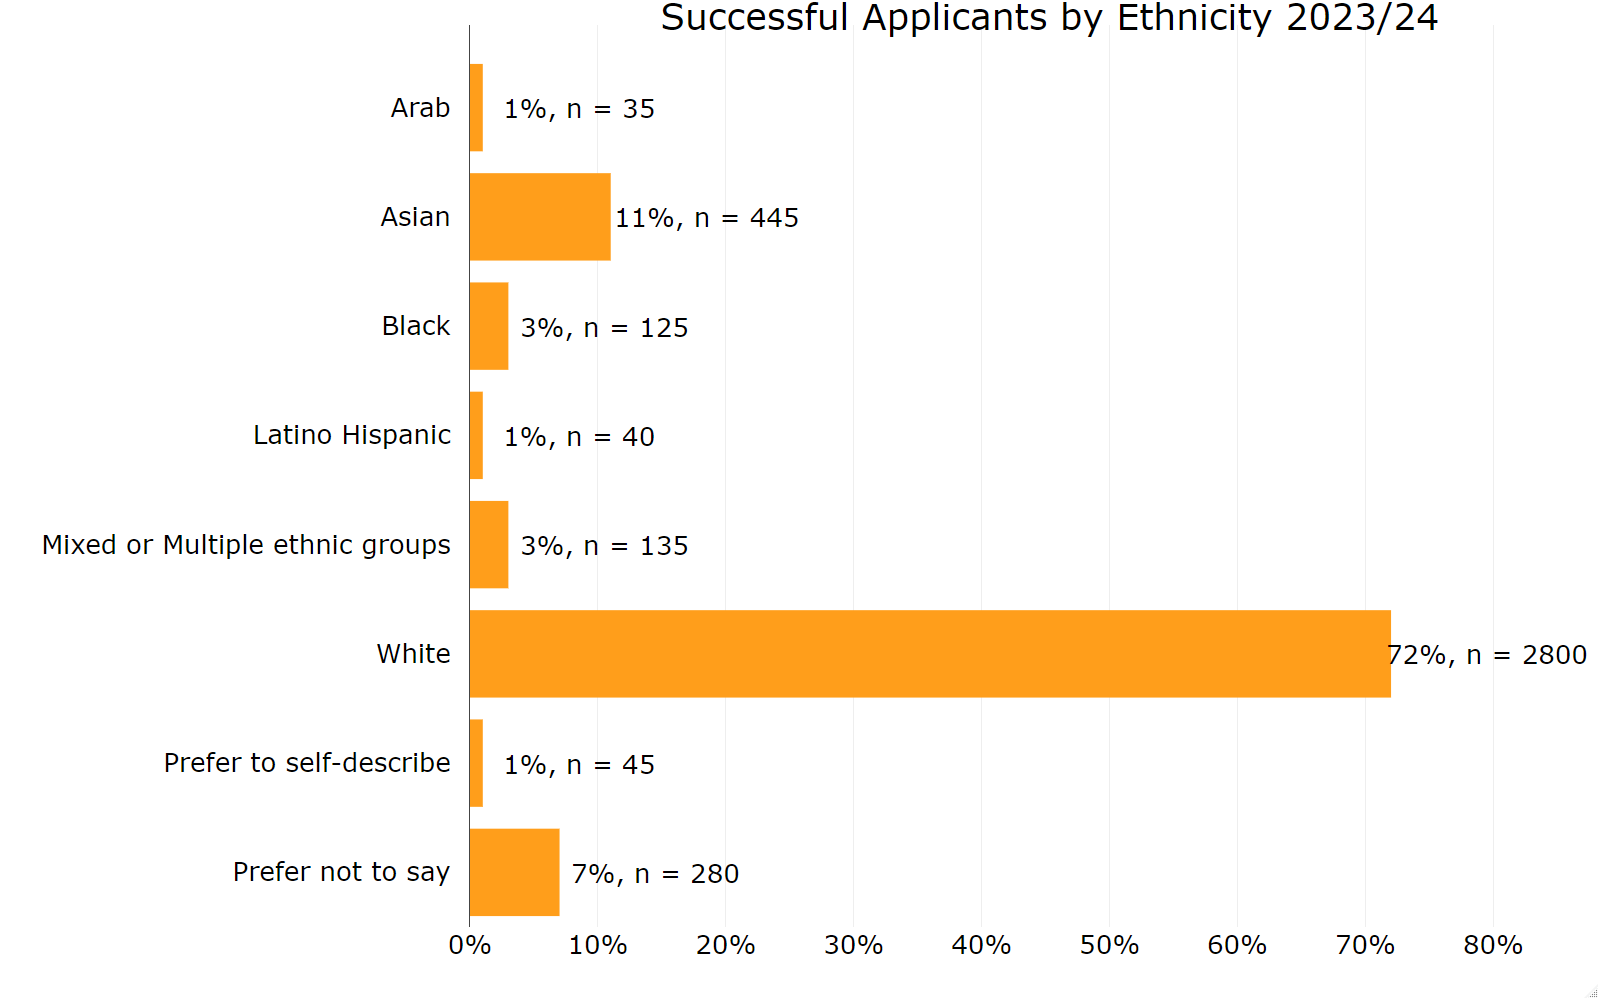
Figure 11 Annex B: Successful applicants by ethnicity 2023 to 2024
Of the successful applicants:
- 72% identified as White
- 11% identified as Asian (including Asian British)
- 3% identified as Black (including Black British)
- 3% identified as having Mixed or multiple ethnicities
- 1% identified as Arab
- 1% identified as Latino Hispanic
- 1% preferred to self-describe
- 6% preferred not to disclose their ethnicity
Figure 12 Annex B: Application award rate by ethnicity 2023 to 2024
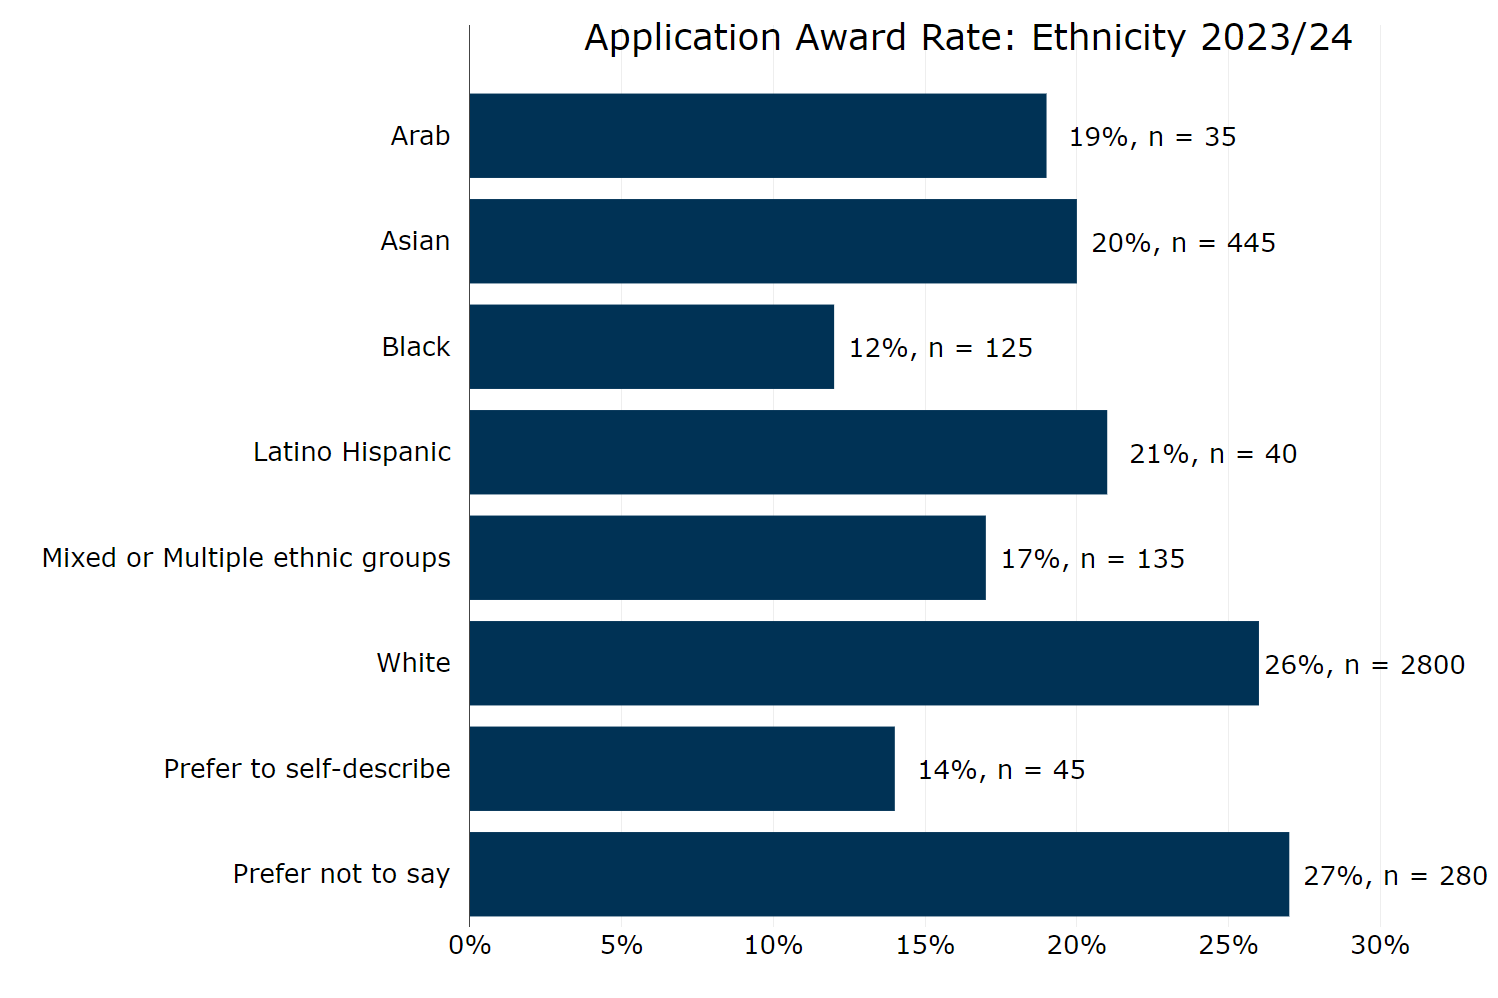
Figure 12 Annex B: Application award rate by ethnicity 2023 to 2024
Application award rates were highest among applicants who preferred not to disclose their ethnicity, at 27%, followed by:
- applicants identifying as White, with 26%
- applicants identifying as Latino Hispanic, with 21%
- applicants identifying as Asian, with 20%
- applicants identifying as Arab, with 19%
- applicants identifying as having mixed or multiple ethnicities, with 17%
- applicants identifying as Black, with 12%
- applicants who preferred to self-describe had an award rate of 14%
Gender
Innovate UK has been collecting applicant diversity data since 2022, during that time there have been some changes to question wording and response options. In November 2023 (six months into this reporting period) a ‘Questioning or unsure of gender identity’ response option was added to this survey question. As such the results presented for this response option represent six months of data collected between November 2023 to March 2024.
When reporting gender, we see an impact on results when data from diversity-focused programmes are included or excluded from the analysis. Examples of these programmes are the Unlocking Potential Begin and Build competitions which were run during the reporting period. In this section we compare results for applicants, successful applicants and award rates where these targeted programmes are both included and excluded.
Figure 13 Annex B: Applicants by gender (including diversity-focused competitions) 2023 to 2024
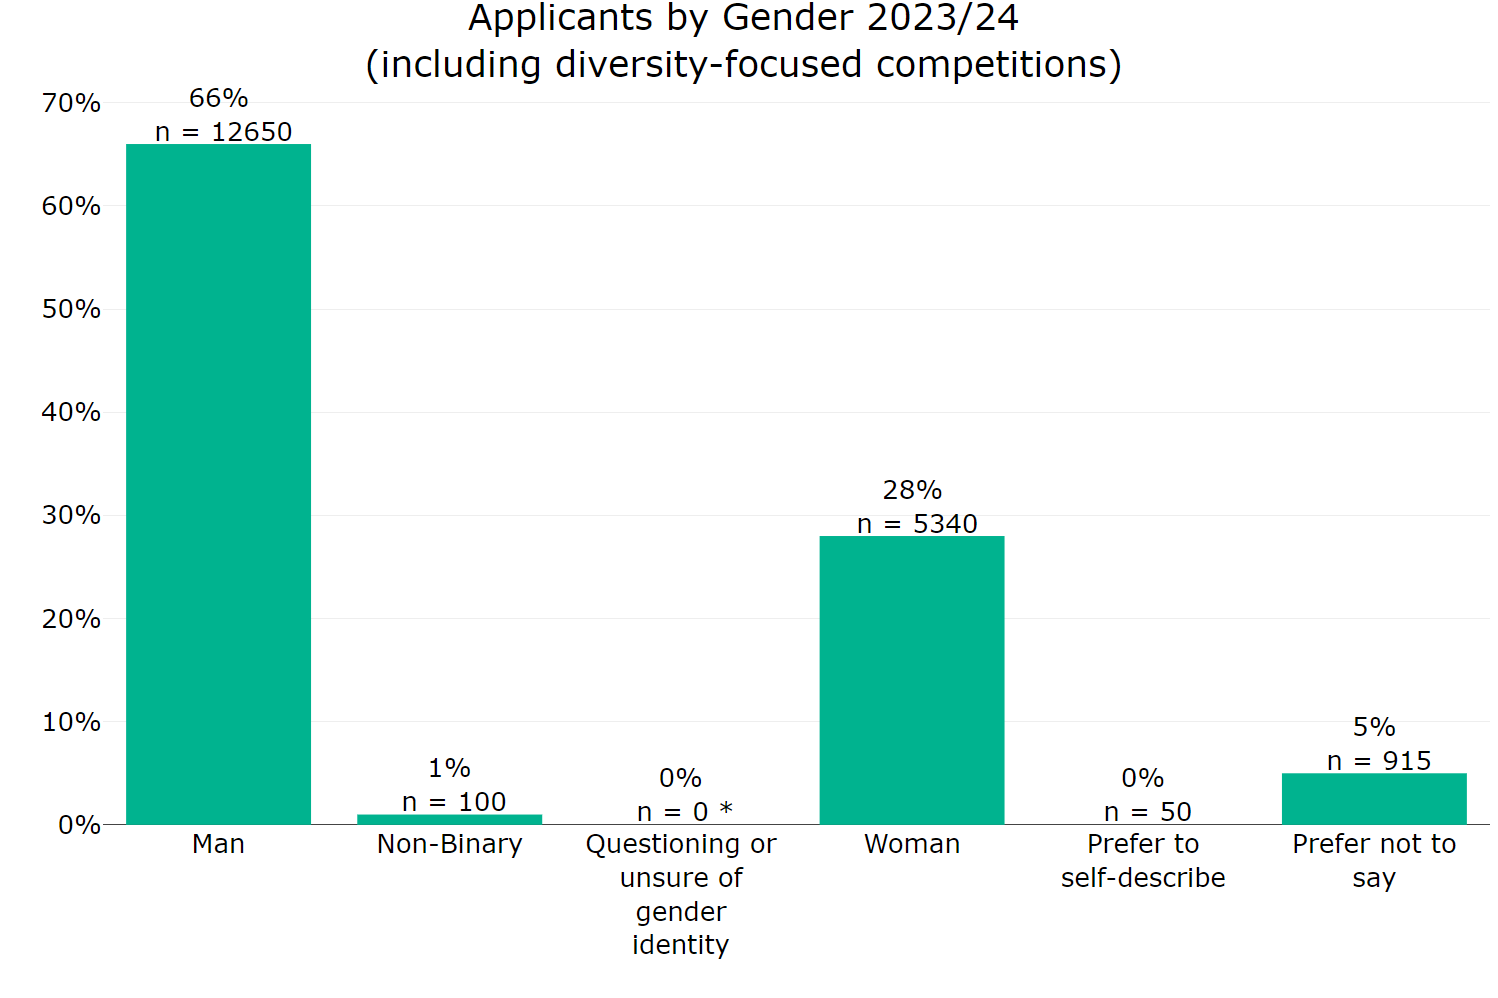
Figure 13 Annex B: Applicants by gender (including diversity-focused competitions) 2023 to 2024
When applications from all competitions are included, men represented 66% of the applicants and women 28%, 1% described themselves as non-binary and no applicants described themselves as questioning. Fewer than 1% preferred to self-describe and 5% preferred not to disclose their gender.
Figure 14 Annex B: Applicants by gender (excluding diversity-focused competitions) 2023 to 2024

Figure 14 Annex B: Applicants by gender (excluding diversity-focused competitions) 2023 to 2024
When diversity-targeted programmes are removed from the analysis the proportion of applicants that were men increases to 69%, and the proportion of applicants that were women decreases to 25%. Fewer than 1% were non-binary, fewer than 1% preferred to self-describe and 5% preferred not to say.
Figure 15 Annex B: Successful applicants by gender (including diversity-focused competitions) 2023 to 2024
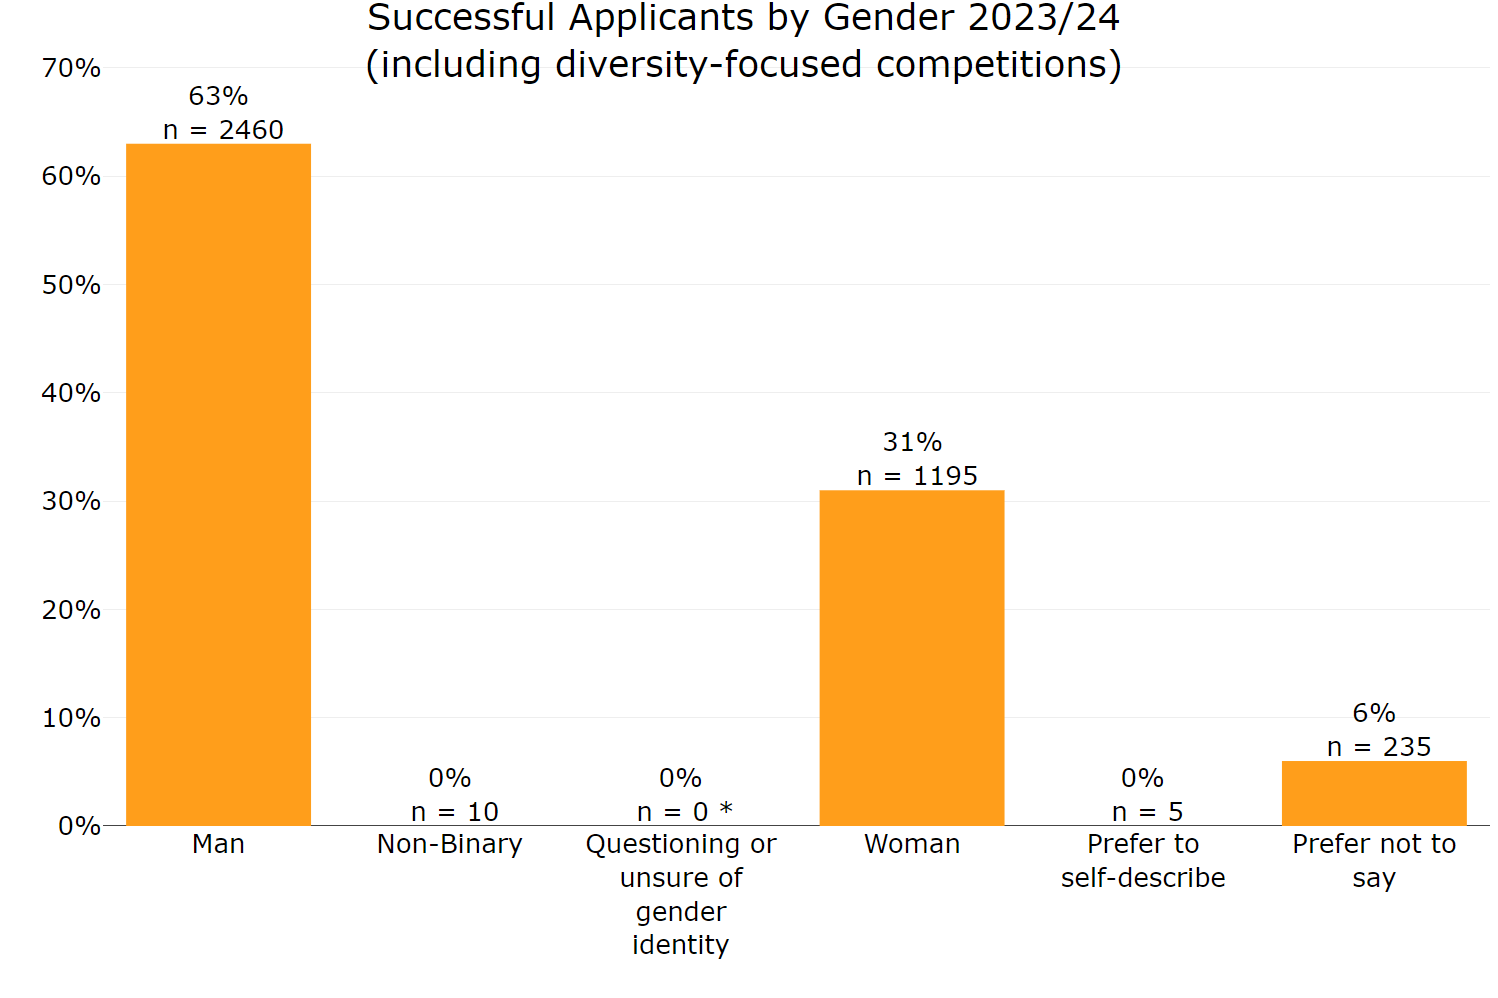
Figure Annex B: 15 Successful applicants by gender (including diversity-focused competitions) 2023 to 2024
When diversity-targeted competitions are included, men represented 63% and women 31% of successful applicants. Fewer than 1% were non-binary or applicants that preferred to self-describe, and 6% of funded applicants preferred not to say.
Figure 16 Annex B: Successful applicants by gender (excluding diversity-focused competitions) 2023 to 2024
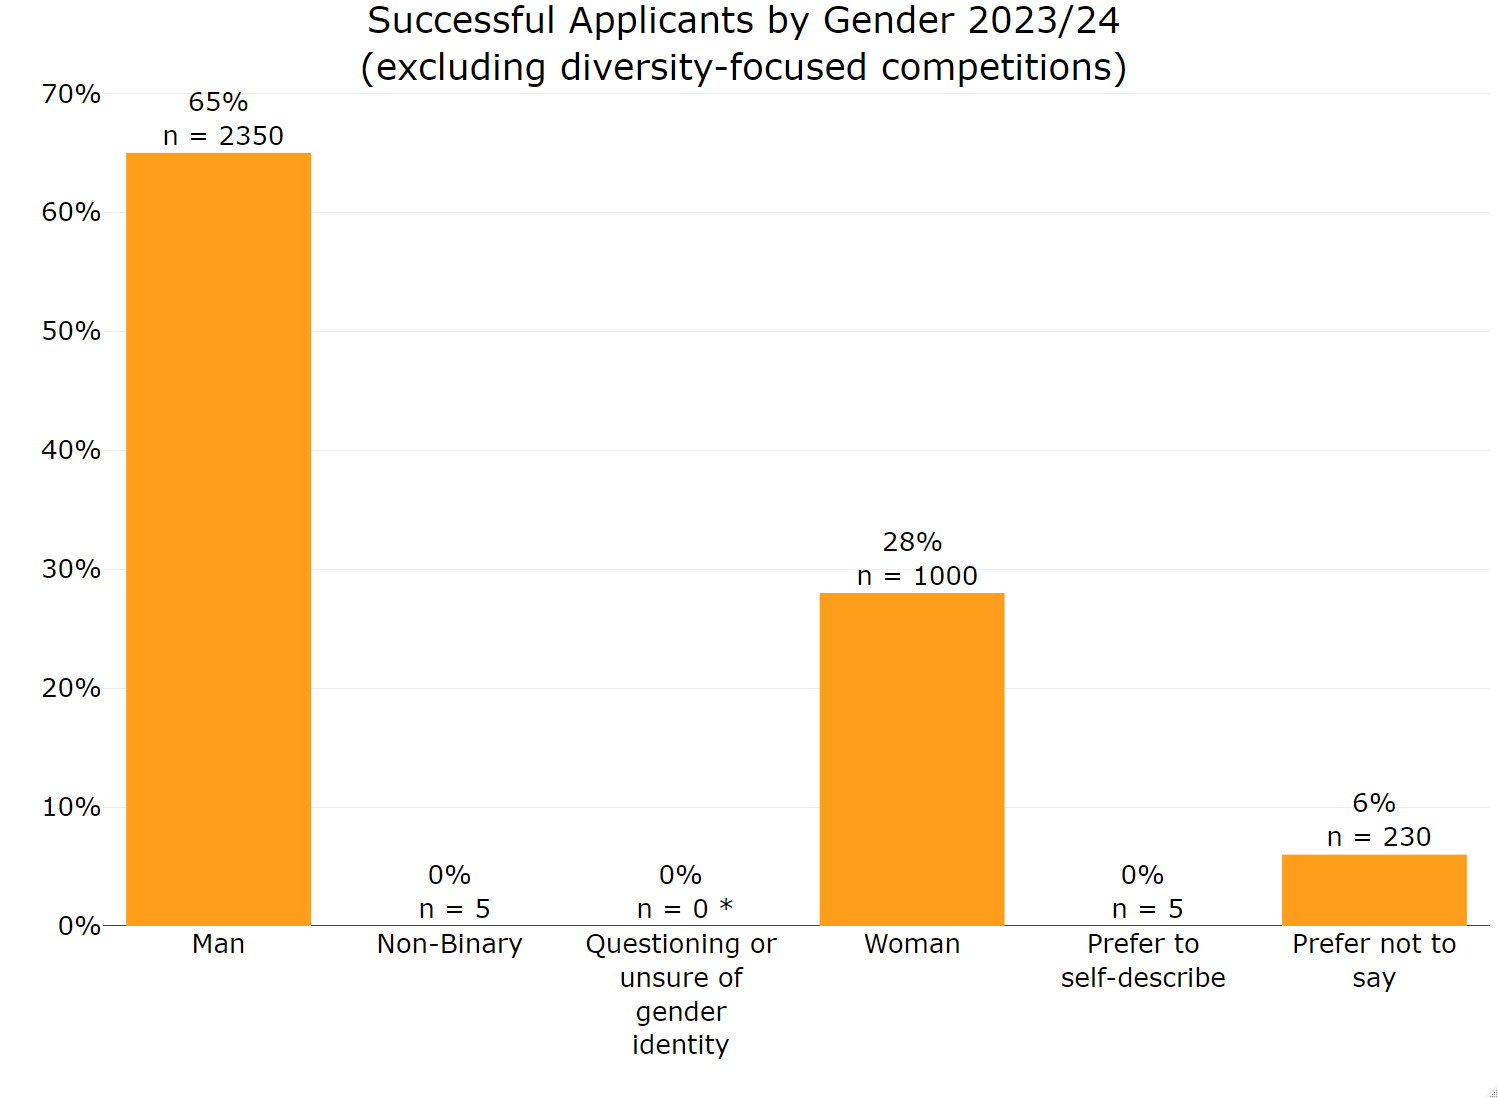
Figure 16 Annex B: Successful applicants by gender (excluding diversity-focused competitions) 2023 to 2024
When applications from diversity-focused competitions are excluded, the proportion of successful applicants increases slightly for men, to 65%, and decreases for women, to 28%.
While women represented 31% of funded applicants, these applications received 28% of the total funding awarded (approximately £292 million). Men represented 63% of all funded applications, while these applications received 64% of total funding (approximately £681 million). For applicants who preferred not to disclose their gender, these applications received around 8% of the total funding awarded.
It is important to note that the funding awarded data is taken from the lead applicant organisation only. Collaborating partners are not represented here as this funding is awarded to an organisation rather than an individual. Innovate UK does not currently collect data on the job roles of survey respondents which would be required to make robust assessments of funding awarded to different applicant groups.
Figure Annex B: 17 Application award rates by gender (including diversity-focused competitions) 2023 to 2024
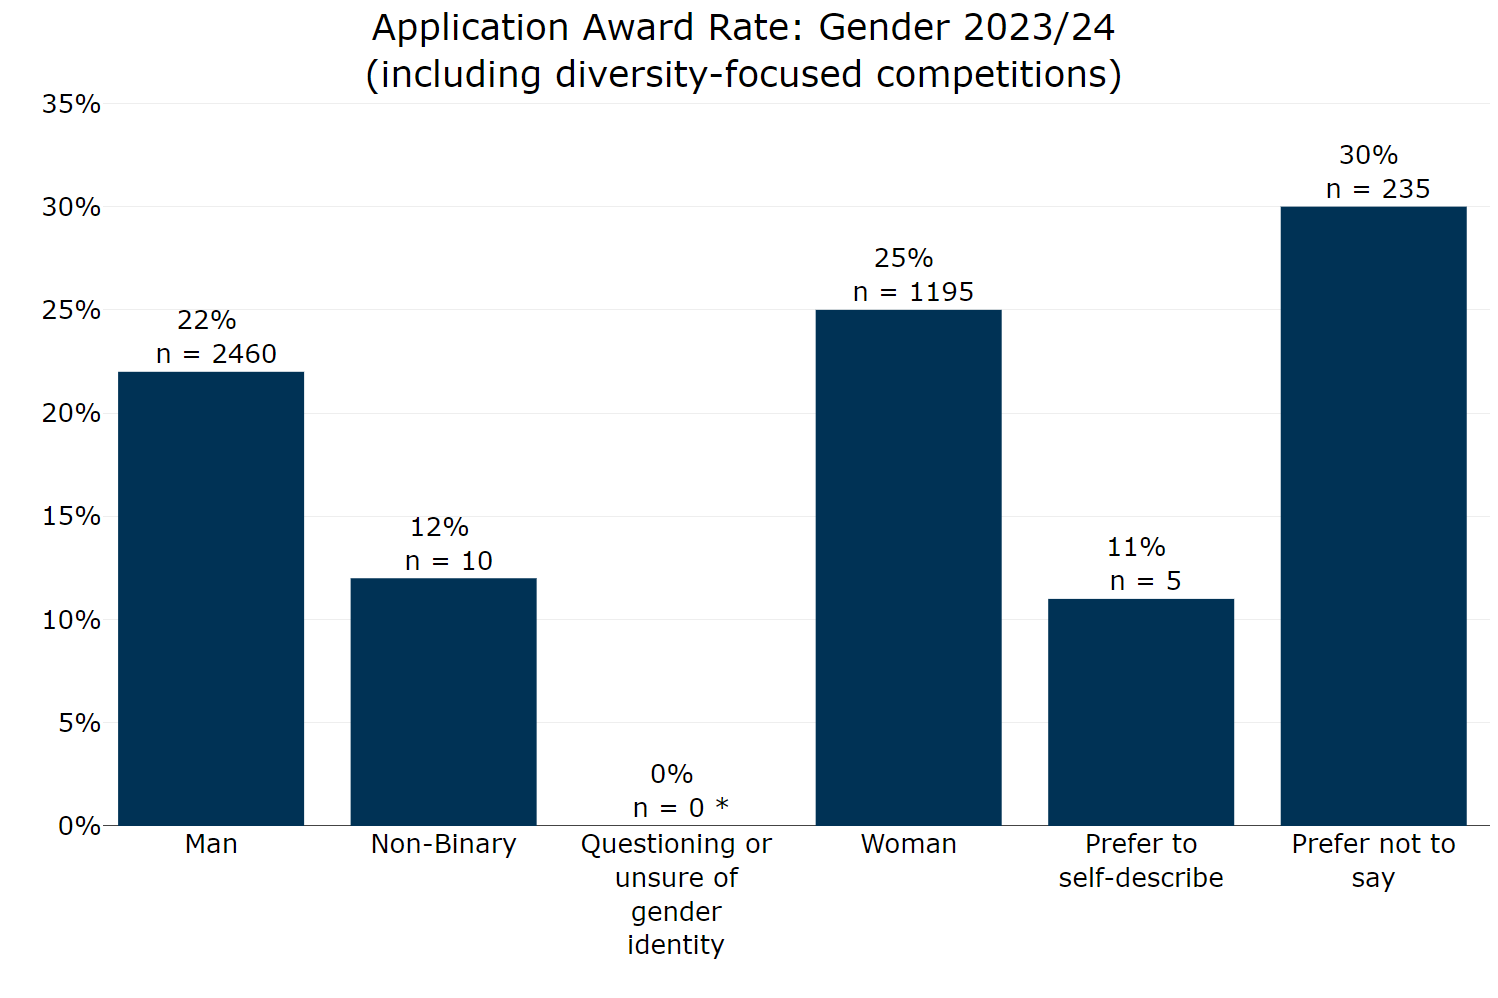
Figure 17 Annex B: Application award rates by gender (including diversity-focused competitions) 2023 to 2024
There was very-high demand for the diversity-focused Unlocking Potential Begin and Build competitions run during the reporting period, which attracted over 2000 applications in total for around 240 funded projects. The popularity of the competition with women applicants in particular means that inclusion or exclusion of this data has an effect on the award rates of the different gender description categories.
When included, award rates are:
- 25% for women
- 22% for men
- 12% for non-binary applicants
- 11% preferred to self-describe
- 30% preferred not to say
Figure 18 Annex B: Application award rates by gender (excluding diversity-focused competitions) 2023 to 2024
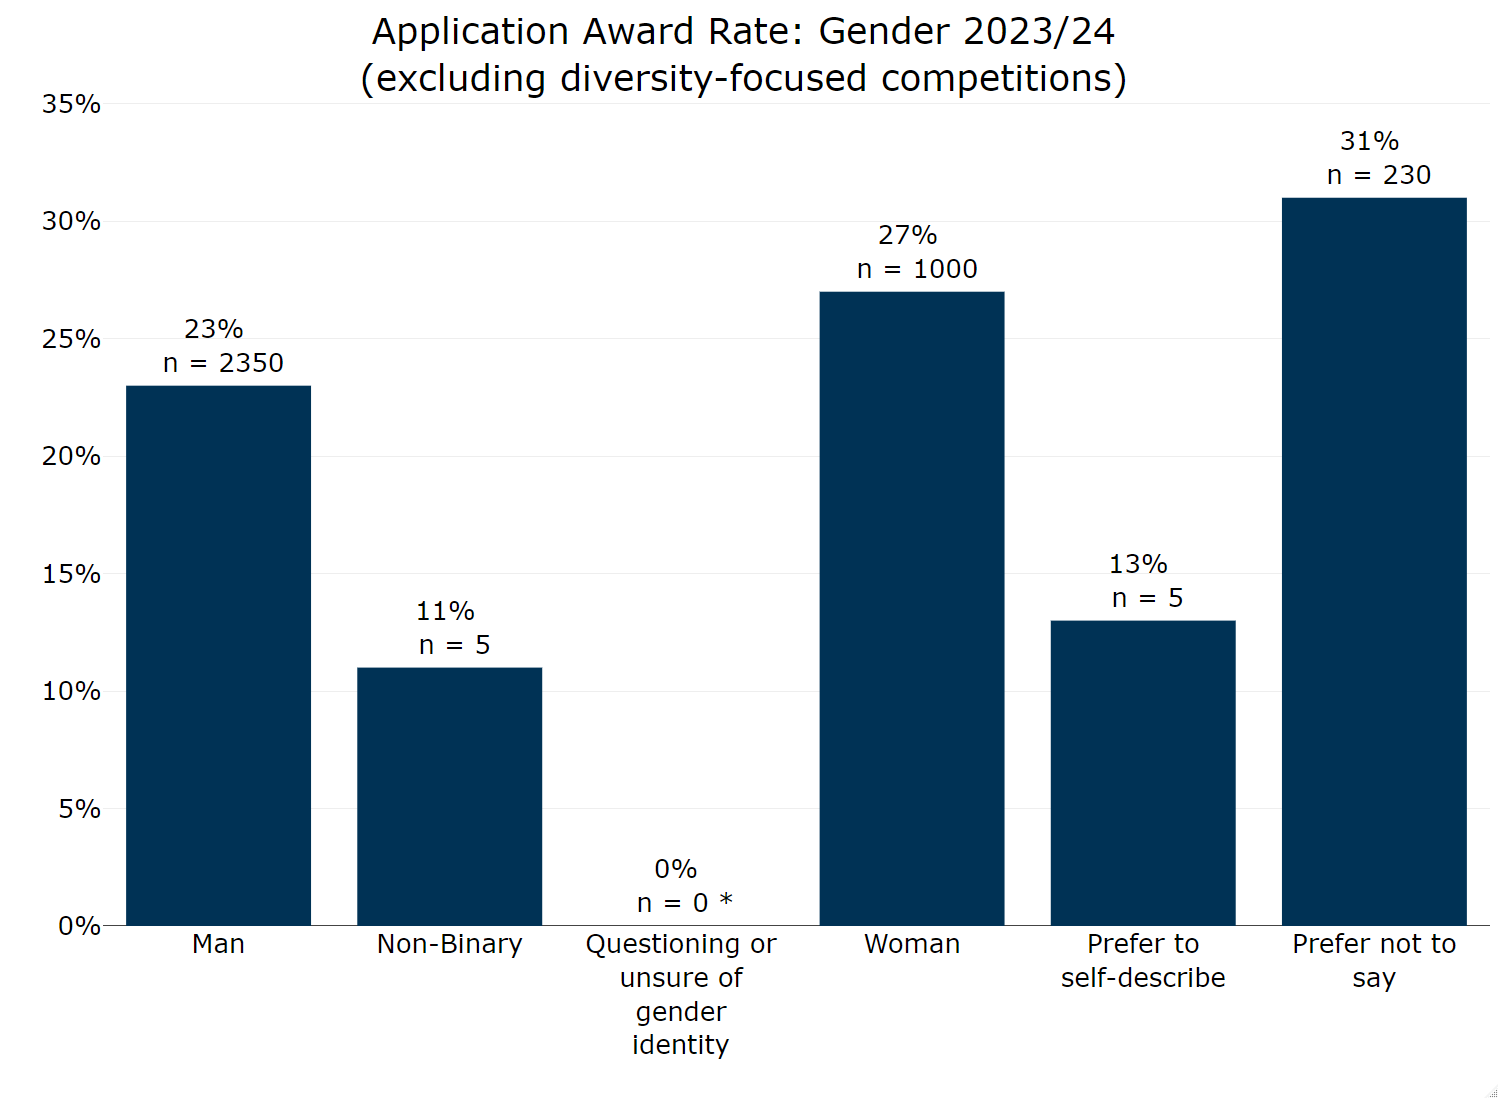
Figure 18 Annex B: Application award rates by gender (excluding diversity-focused competitions) 2023 to 2024
When excluded, the award rates for women increase from 25% to 27%, for men the award rates increase from 22% to 23% and for non-binary applicants it decreases slightly from 12% to 11%. For applicants who preferred to self-describe, their award rate increased from 11% to 13% and those who preferred not to say it increased from 30% to 31%.
Socioeconomic background
The survey collected data from respondents about the occupation of the main household earner when the applicant was 14 years old. Respondents selected the most appropriate occupation from a list of descriptions which have been grouped here into three top-level categories:
- Professional backgrounds
- Intermediate backgrounds
- Working-Class backgrounds
Figure 19 Annex B: Applicants by socioeconomic background 2023 to 2024
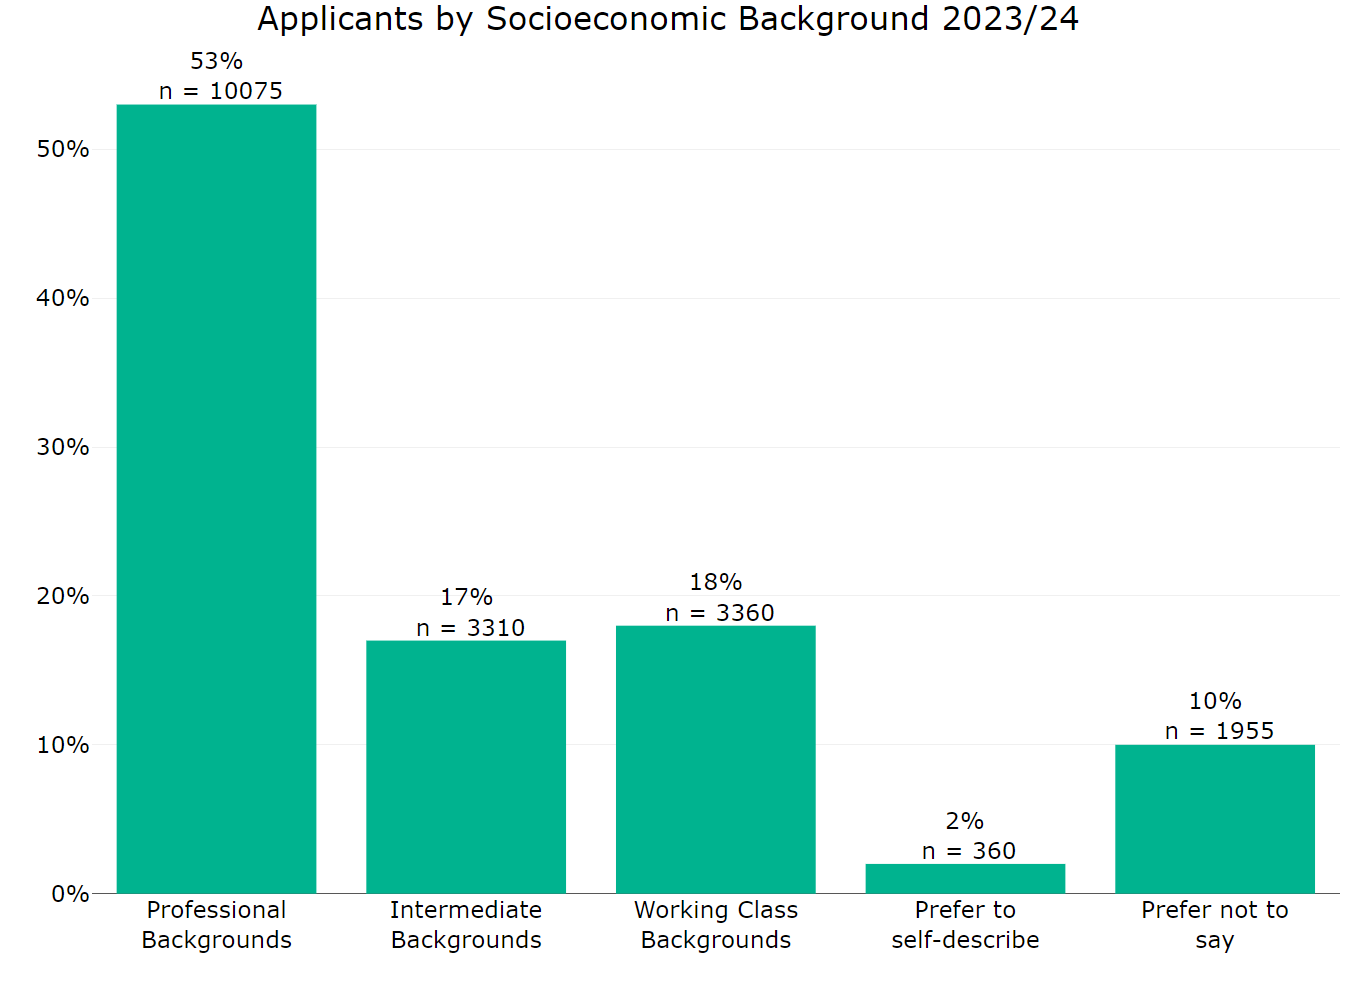
Figure 19 Annex B: Applicants by socioeconomic background 2023 to 2024
Of all applicants, 53% selected occupations from professional backgrounds, 17% from intermediate backgrounds and 18% from working class backgrounds. Around 2% preferred to self-describe their socioeconomic background and 10% preferred not to disclose this information.
The proportion of ‘prefer not to say’ responses is higher for this survey question (10 to 11%) compared with others (that are typically around five to 7%). The extent of unknown data limits the strength of the conclusions we can make on socioeconomic background.
Figure 20 Annex B: Successful applicants by socioeconomic background 2023 to 2024
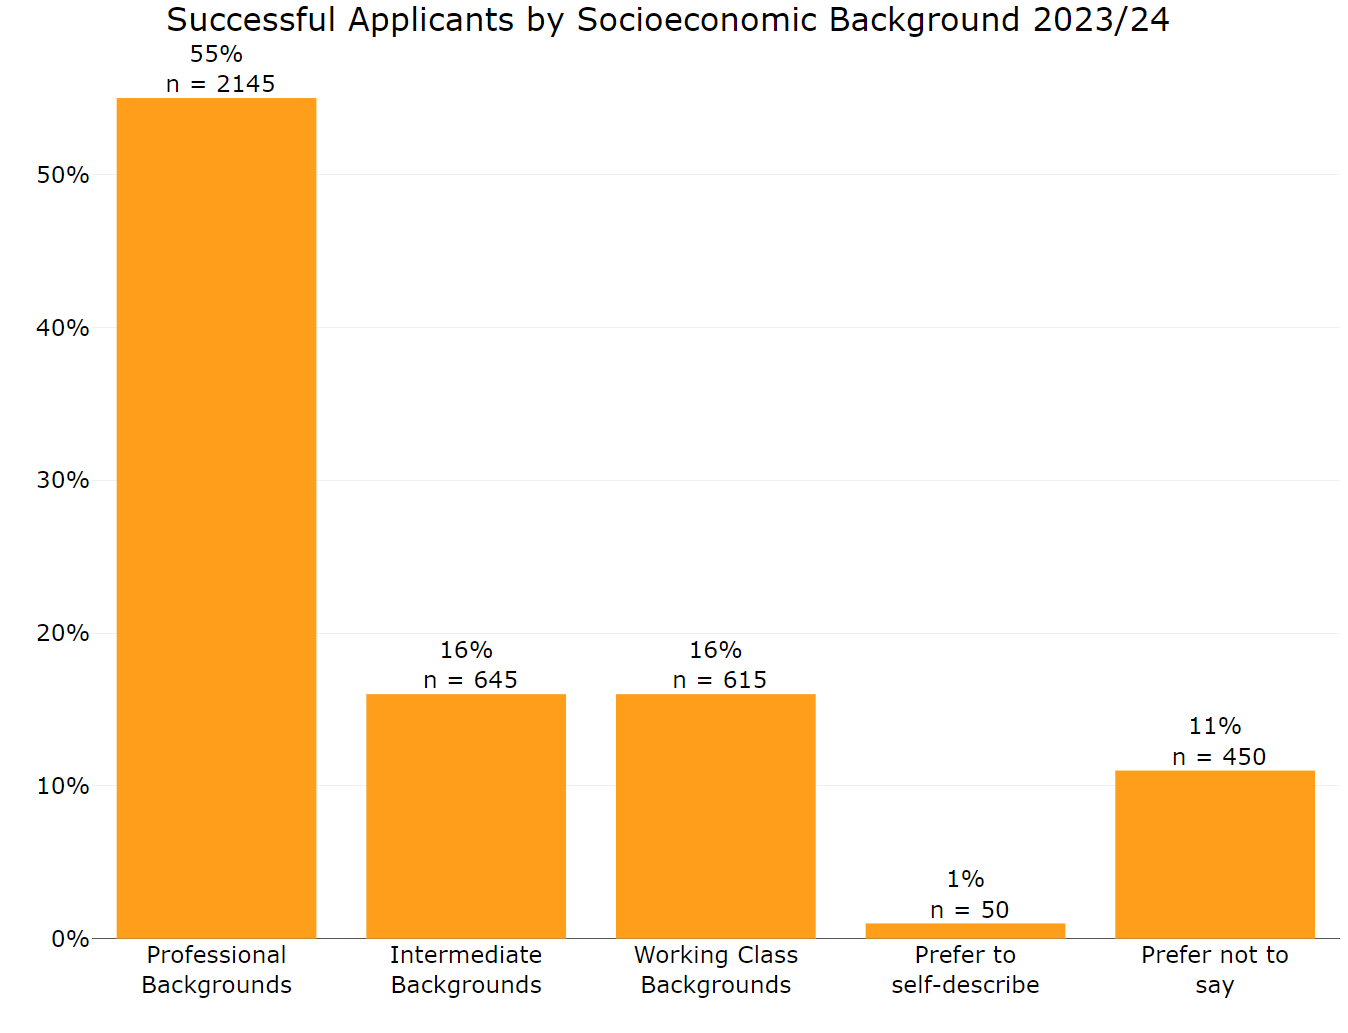
Figure 20 Annex B: Successful applicants by socioeconomic background 2023 to 2024
For successful applicants the proportions were similar, with:
- 55% from professional backgrounds
- 16% from intermediate backgrounds
- 16% from working-class backgrounds
- 1% preferred to self-describe
- 11% preferred not to say
Figure 21 Annex B: Application award rate by socioeconomic background 2023 to 2024
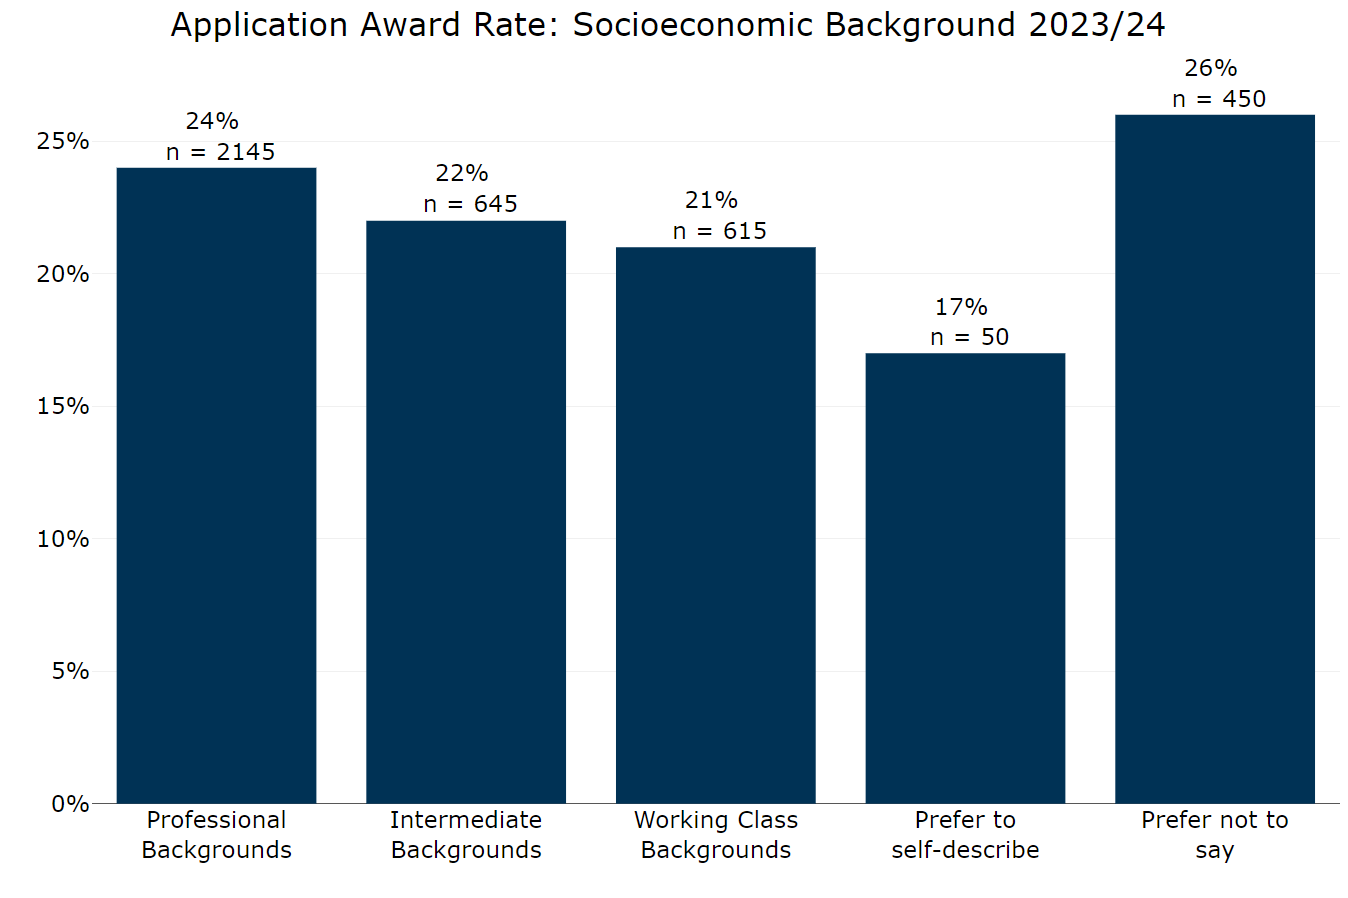
Figure 21 Annex B: Application award rate by socioeconomic background 2023 to 2024
The application award rates for each group were:
- 24% for applicants from professional backgrounds
- 22% for applicants from intermediate backgrounds
- 21% for applicants from working-class backgrounds
- 17% for applicants who preferred to self-describe
- 26% for applicants who preferred not to say