
Foreword
At UK Research and Innovation (UKRI), our people are our most important asset. The commitment, professionalism and expertise that our staff bring to their work is core to everything we do and underpins our ability to deliver for the UK’s research and innovation system. We are committed to creating a working environment where everyone is treated with dignity and respect, and where diverse views are voiced, heard and valued. As part of this commitment, UKRI is keen to understand and eliminate unfairness in its pay and reward system. We support the principle of equal pay and use a pay and grading system that ensures roles are evaluated consistently against objective criteria to help us operate a transparent pay system, free from bias.
In March 2025 UKRI published its sixth Gender Pay Gap report (GPG), an important component of understanding our workforce data, which provides the evidence base for our wider equality, diversity and inclusion (EDI) action plans to create a more inclusive and fair organisational culture, where all staff can thrive. Our analysis shows that our GPG is largely driven by the relative representation of males and females across the workforce.
To provide assurance that there is not differential pay within grades, we are committed to conducting regular equal pay audits (EPA), and this report is part of that commitment. The audit presented in this report will enhance and complement our work to identify and eliminate bias within our pay arrangements. The audit has not identified any areas of significant concern, as defined by the Equality and Human Rights Commission (EHRC) definition of differences above 5%. However, it has highlighted some areas to explore further, and some areas where we will continue to monitor progress.
As interim Accounting Officer I am committed to ensuring that we take evidenced action to ensure we create a positive and enabling research environment.
Siobhan Peters
Chief Financial Officer and Interim Accounting Officer, UKRI
Executive summary
In line with its statutory obligations, UKRI has published a GPG report each year since 2018. The 2025 EPA builds on the 2022 EPA, both of which are in line with the methodology published by the EHRC. Taking these steps to understand the pay of our workforce better creates the conditions in which all our staff can thrive.
Our EPA and annual GPG report form part of the reward and equality diversity and inclusion strategies that are being delivered across UKRI. It is important to understand the differences between the two reports.
The EPA looks specifically at any differences in pay for males and females for equal work, as set out in the Equality Act 2010. The EHRC suggests that any gap found of plus or minus 5% or more is significant and should be explored further. Gaps greater than plus or minus 3% but less than plus or minus 5% should be reviewed and monitored.
The 2025 UKRI audit has found that the difference in pay of males and females is less than 5% in all grades. Band H S2 is the only grade with a difference greater than 3%, with males earning 96% of female mean salary. However, it is important to note that the small count of females (eight) in band H S2 means that there is a larger chance of statistical variance. We will continue to monitor our data regularly and measure progress as part of our wider reward and EDI plans.
The GPG is a measure of the difference between the average earnings of males and females across the whole of UKRI. In contrast to the EPA data presented here, which assesses equal pay for equal work, the GPG is influenced by the relative representation of males and females at various levels in the workforce. In March 2025, UKRI published its 2024 GPG, which showed a mean gap of 9%. The mean gap takes the total pay of females and divides it by the number of females, and the same for males, and compares these averages. The report showed a median gap of 7.5%. The median is found by lining up all employees’ pay in two lines, one for females, one for males, in order of pay from highest to lowest. The median gender pay gap then compares the pay difference between the male and the female in the middle of the respective lines. Both mean and median gaps are expressed as a percentage of male earnings.
Both the EPA and the GPG analyse pay differences based on legal sex. In UKRI’s 2023 and 2024 GPG we also analysed pay difference based on ethnicity, and UKRI is committed to expanding this to further characteristics in the future, for example disability. Currently, we do not have sufficiently robust data to perform this analysis, but we aim to improve this as part of our wider EDI action plans.
Note on the data
The EHRC states that an equal pay audit ‘compares the pay of men and women doing equal work’. While we recognise that ‘men’ and ‘women’ are terms used to describe gender identity, our data is by legal sex, which we are required to collect for HM Revenue & Customs and to monitor sex as a protected characteristic under the Equality Act 2010. Therefore, the references to male and female throughout this report are in reference to legal sex.
Introduction
By law, ‘employers must not pay an employee less, or give them terms and conditions that put them at a disadvantage, because of their sex, disability, race, religion, sexual orientation or another protected characteristic’. The equal pay provisions of the Equality Act 2010 are aimed specifically at ensuring that males and females who are performing equal work should receive equal pay.
This makes equal work the foundation of an equal pay audit. Employers are responsible for providing equal pay and for ensuring that pay systems are transparent. Pay systems that reward people equally and fairly have significant benefits not just for UKRI and all our employees, but also for wider society and for the environment for research and innovation in the UK.
UKRI supports the principle of equal pay for equal work of equal value. We recognise that there should be pay and grading structures and supporting processes that are free from bias and based on objective criteria. As it matures, UKRI is keen to understand its pay data better in order to assure itself and its stakeholders that it is meeting these requirements and to address any equal pay differences or risks that are identified.
Our EPA and our annual GPG report are distinct inter-related activities to progress our important objective to deliver fair and equal pay in UKRI and to monitor progress toward that goal. It is important to be clear about the difference between them. The GPG is the difference between the mean or median pay for males and females in the organisation. In our 2024 GPG report the mean gap across all employees in the organisation was found to be 9%, and the median 7.5%.
The EPA emphasises our commitment to monitor and review pay transparently, to test for equity and determine whether further action is required to assure this. The findings and recommendations are key to our work to promote and assure equitable practice. The EHRC sets out a clear, staged and recommended process for an effective EPA and we have followed this five-step sequence of stages in our audit.
UKRI last undertook an EPA in 2022. The 2025 audit expands on the areas analysed previously, and includes analysis of allowances, promotions and overtime by sex, as well as analysis of salary and end of year awards by ethnicity. Since the last audit, UKRI has implemented new additional pay ranges (S1 and S2) for research delivery roles in bands B to H to address identified acute recruitment and retention issues. These additional ranges have been split out in some analyses in this audit to provide further insights.
Methodology
The focus of the audit:
- an equal pay analysis of base pay and regular allowances by band across the whole organisation, by legal sex
- analysis of end of year bonus awards by legal sex, working pattern and ethnicity
- an equal pay analysis of base pay and regular allowances by band across the whole organisation, by ethnicity
- an analysis of pay on appointment by legal sex
Determining equal work
In order to assess equal work, UKRI uses the Job Evaluation and Grading System (JEGS) to evaluate roles for bands A to H (with band A being the most junior) and to match Medical Research Council (MRC) and Innovate UK bands to the UKRI equivalents. JEGS is a well-tested job evaluation system, it is the most common method used across the UK Civil Service and can be compared easily with other well-known systems such as Hay. Based on their job evaluation points score derived from scoring a range of criteria for the role, jobs are allocated to common pay bands of equal job weight, and our analyses focused on differences within these pay bands.
In 2022 UKRI introduced additional pay ranges (S1 and S2) for research delivery roles in bands B to H (and MRC equivalent bands) to address identified evidenced recruitment and retention issues. Roles meeting the criteria for application of these pay ranges were assigned to either S1 or S2 based on benchmarking of their role type. Introduction of these differentiated ranges has increased pay transparency by largely moving away from pay differentials through application of recruitment and retention or specialist allowances to published basic salary ranges. Some analysis has included data split by these additional ranges to provide further insights.
Data collection
We have reported on pay differences by legal sex. The data has been gathered as of 31 March 2024 and 31 March 2025. All values used for salary and allowances are full-time equivalent (FTE) to allow for comparison between employees.
Due to the small number of employees identified in each minority ethnic group, all minority ethnic groups were aggregated into one larger ‘minority ethnic group’, this group consisted of all employees reporting an ethnicity different to White-British. This is in line with the government’s preferred style when writing about ethnicity. This was to enable more statistically robust comparisons and to preserve anonymity. We recognise that aggregating ethnic groups in this way can mask the experiences, differences and disparities of individual ethnicities and will seek to encourage more employees to share their ethnicity to enable more detailed analysis in the future.
Calculations are based on the mean FTE annual base pay for each employee group specified.
Preserving the confidentiality of individual pay levels has been an important underpinning principle for this report and, in line with external convention, no group size of below five individuals has been shown.
The salary, allowance and promotions data for 7560 (March 2024) and 7728 (March 2025) employees are contained within this audit. It excludes those on specialist arrangements like mariners, pilots, Antarctic employment pool, apprentices and staff on senior contracts. This is because when these populations of staff are split into equivalent role groups for evaluation, the groups are too small to conduct meaningful analysis using the EHRC methodology. In addition, graduate trainees and postdoctoral researchers are excluded from pay on appointment analysis as they have specific starting pay arrangements which distort the analysis. This audit does not include individuals who are not employees of UKRI such as agency staff, contractors and staff seconded into UKRI from an external organisation who continue to be paid on their external organisation’s terms and conditions and payroll systems.
Analysis of end of year bonuses and overtime is for all eligible employees, which includes some employees on non-standard pay scales, but not agency staff and contractors.
Workforce profile
In order to understand better the equal pay data, we have also looked at our workforce profile by sex and band, with band A being the most junior. Figure 1 shows the percentage of males and females, defined by legal sex, in each band in 2025. There is a larger proportion of males in bands D to H. In comparison to 2021 (figure 2), the proportion of females in bands E to H has increased. A notable example is the proportion of females in band H increasing from 28% to 38%. Similarly, the higher proportion of females to males in bands B and C in 2021 has reduced in 2025, from 57% to 52%.
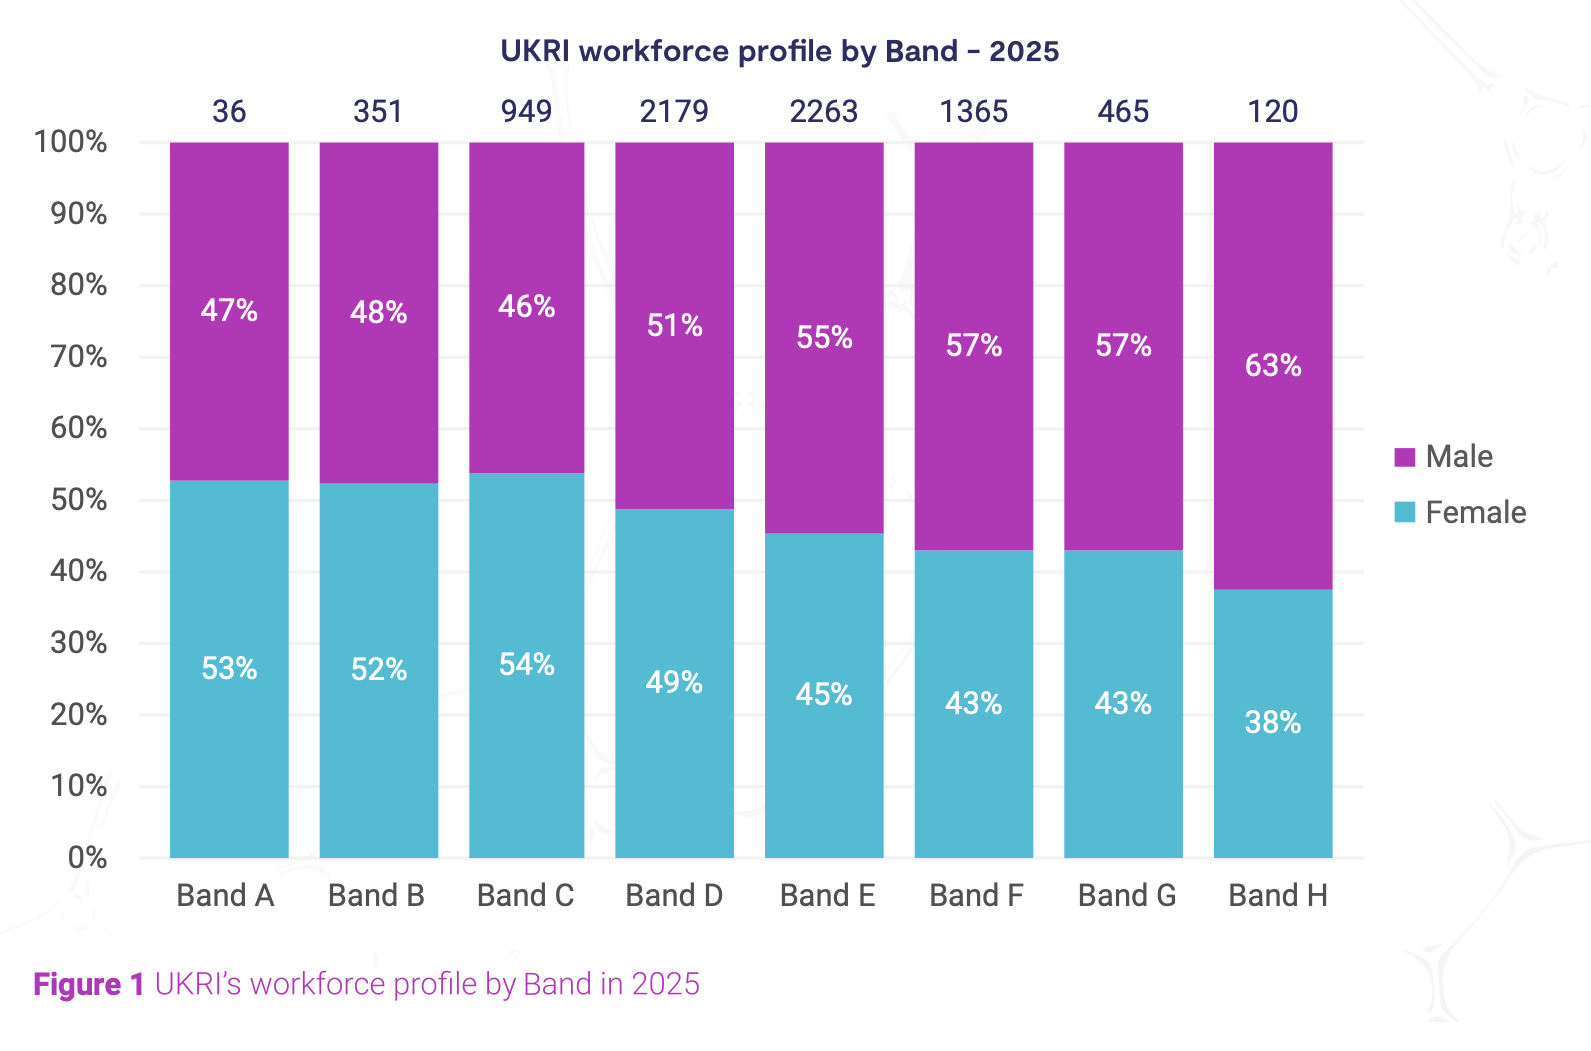
Figure 1: UKRI’s workforce profile by band in 2025 (band A n (number) =36, band B n=351, band C n=949, band D n=2179, band E n=2263, band F n=1365, band G n=465, band H n=120)
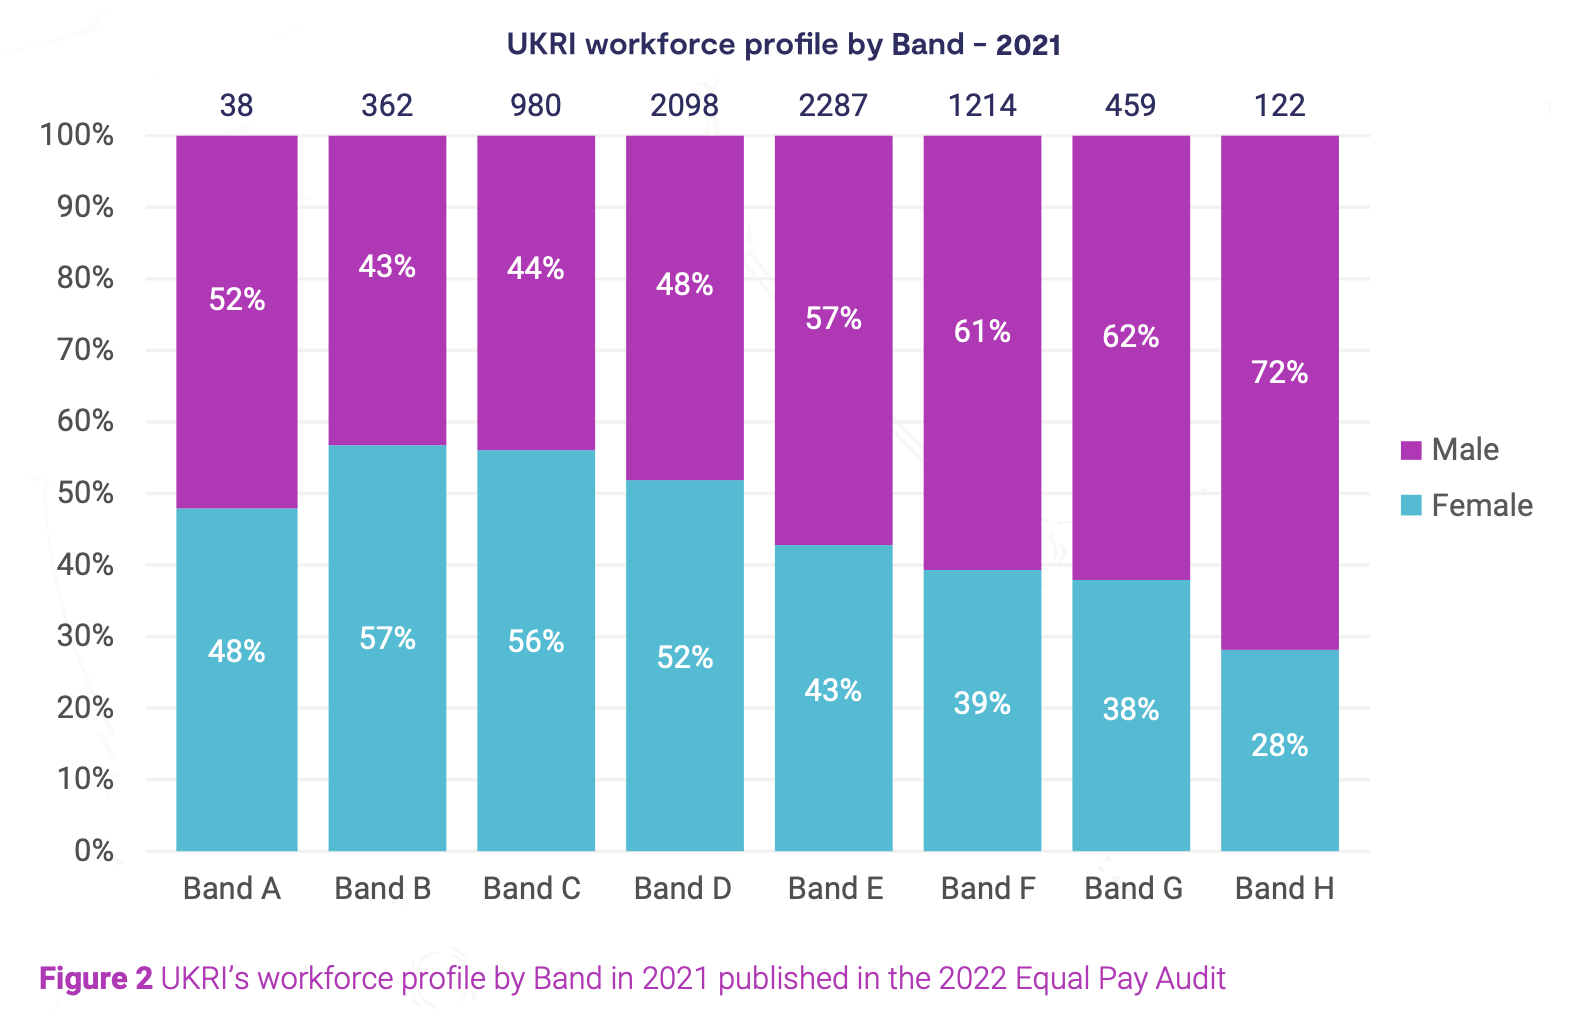
Figure 2: UKRI’s workforce profile by band in 2021 published in the 2022 EPA (band A n=38, band B n=362, band C n=980, band D n=2098, band E n=2287, band F n=1214, band G n=459, band H n=122).
As part of our commitment to EDI, UKRI encourages flexible working options. 13% of employees in bands A to H work part-time, this includes staff who are partially retired. Of these, 74% are females (figure 3). The average FTE of part-time females is 0.73, comparatively the average FTE for part-time males is 0.66.
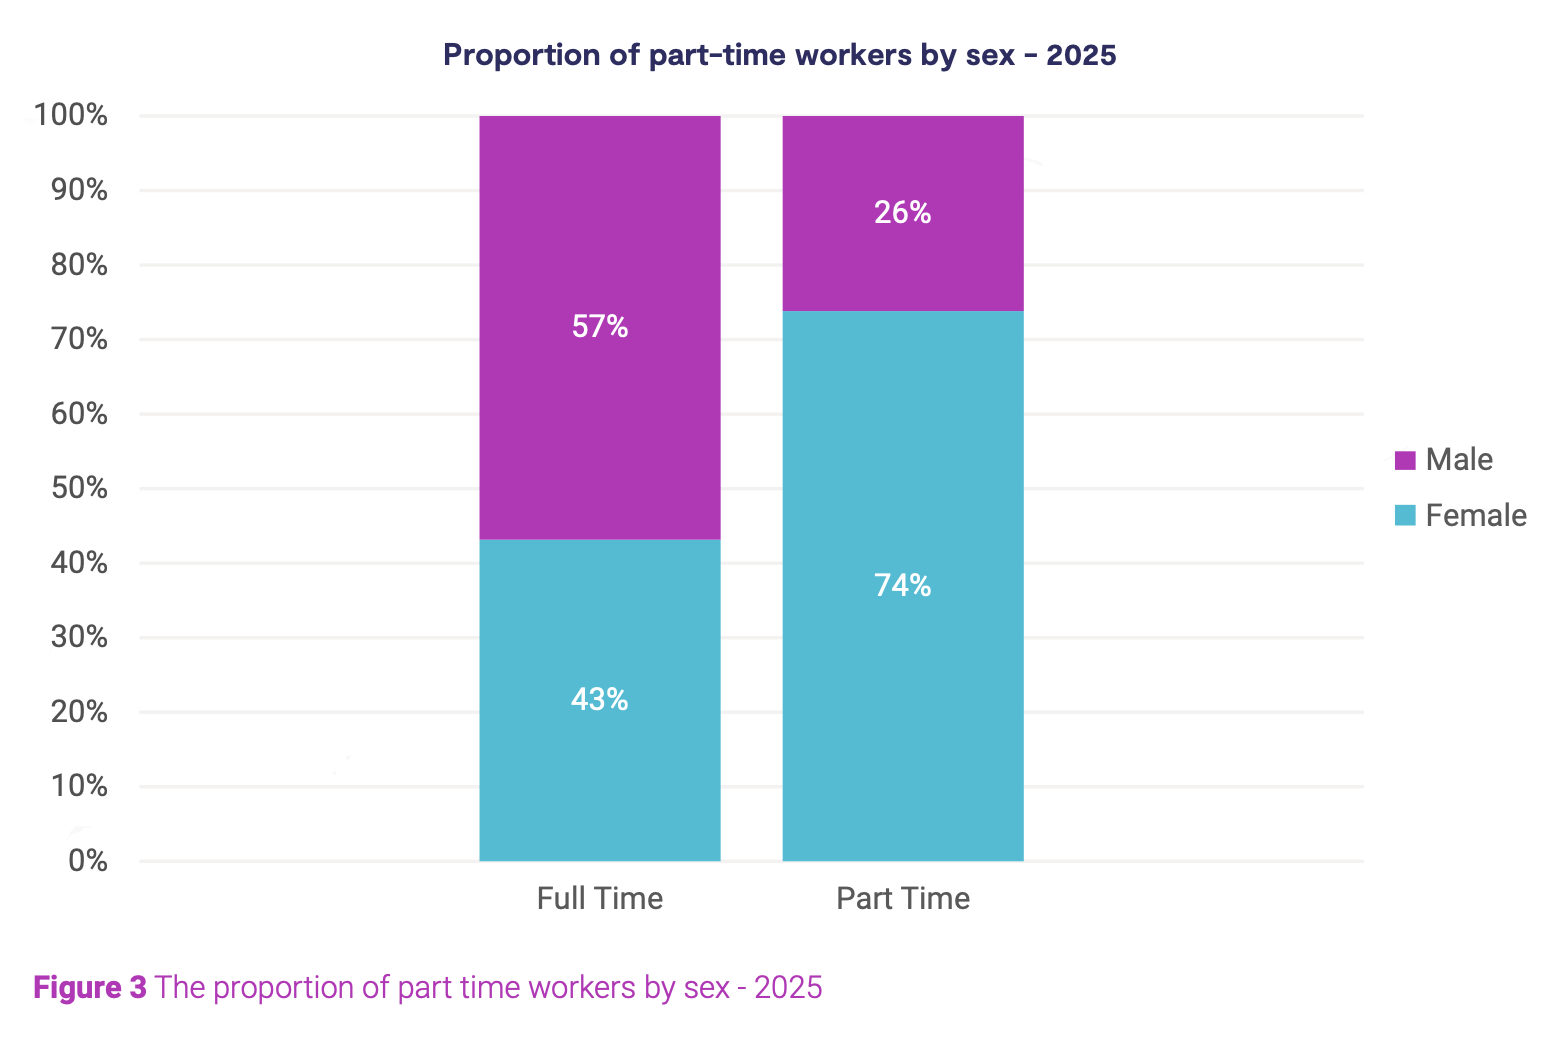
Figure 3: The proportion of part time workers by sex 2025
As of 1 July 22, roles directly focused on research delivery within our science, technology, engineering and mathematical areas in MRC, Natural Environment Research Council and Science and Technology Facilities Council (STFC) were moved on to new pay scales (S1 and S2). The majority of S1 roles are engineering and technical roles and the majority of S2 roles are scientific roles. Research delivery digital roles were placed within either S1 or S2. Placement of roles into S1 or S2 is determined from market pay benchmarking. Figure 4 shows the profile of UKRI in relation to S2, S1 and main scale roles: the majority of employees sit within the main scale (53%) with S2 and S1 containing a similar number of employees at 22% and 26% of the workforce respectively.
Employees on MRC pay scales have had their grade converted to a UKRI equivalent band and included with the main scale, S1 and S2 categories.
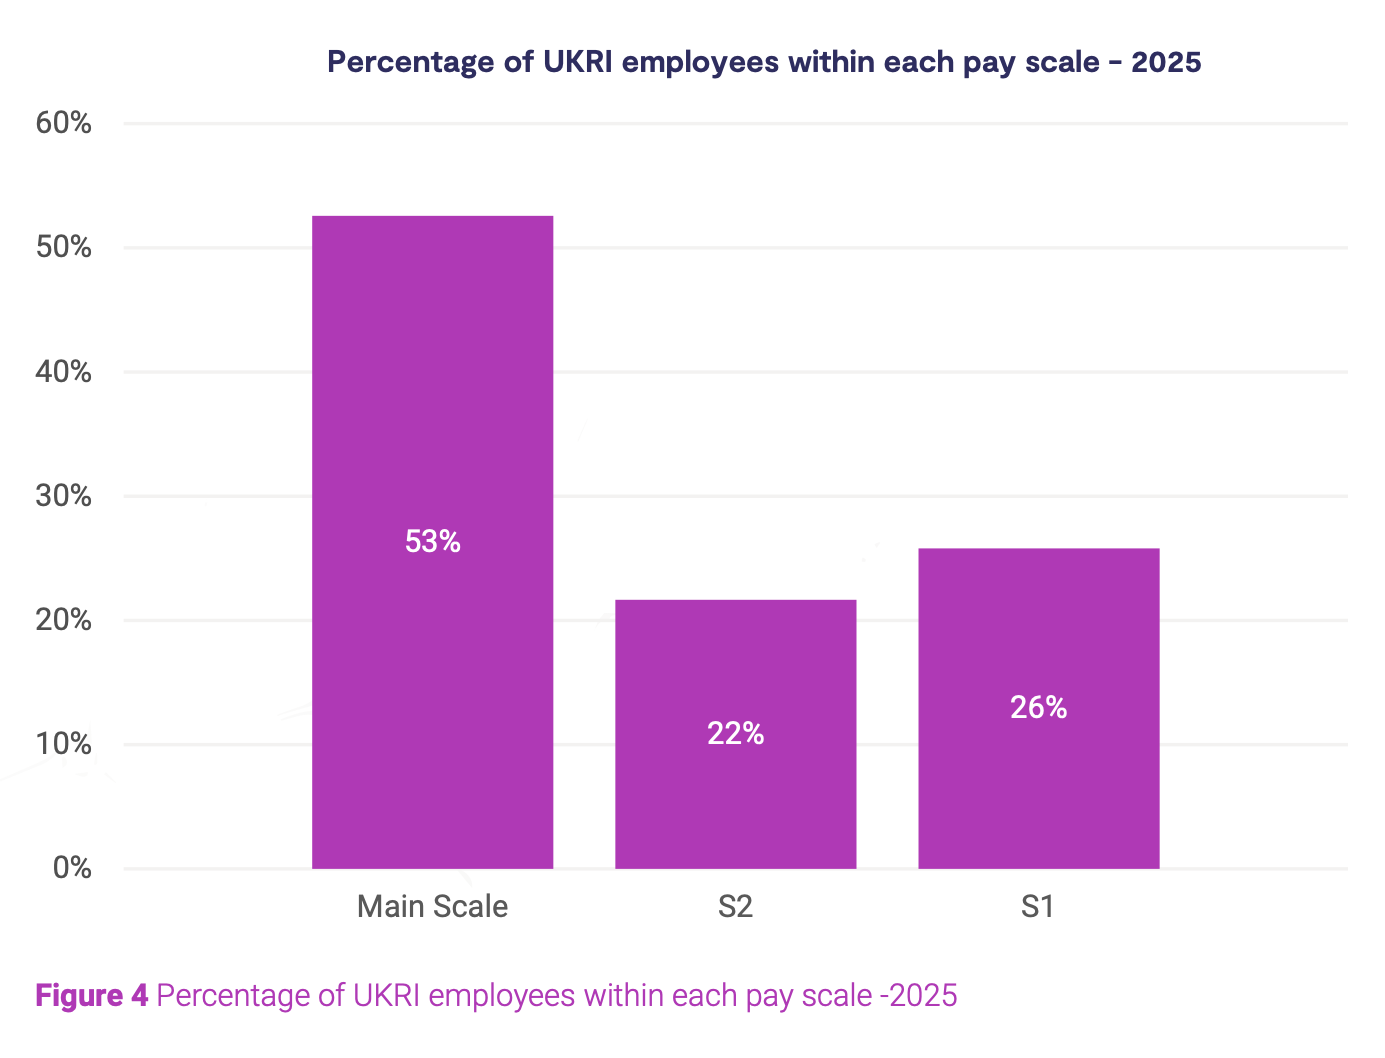
Figure 4: Percentage of UKRI employees within each pay scale 2025
Figure 5 shows the split of males and females in each of the pay scales. The proportion of females in the main scale is 64%. In S2 and S1, there are more males than females with the proportion of males sat at 59% and 82% respectively.
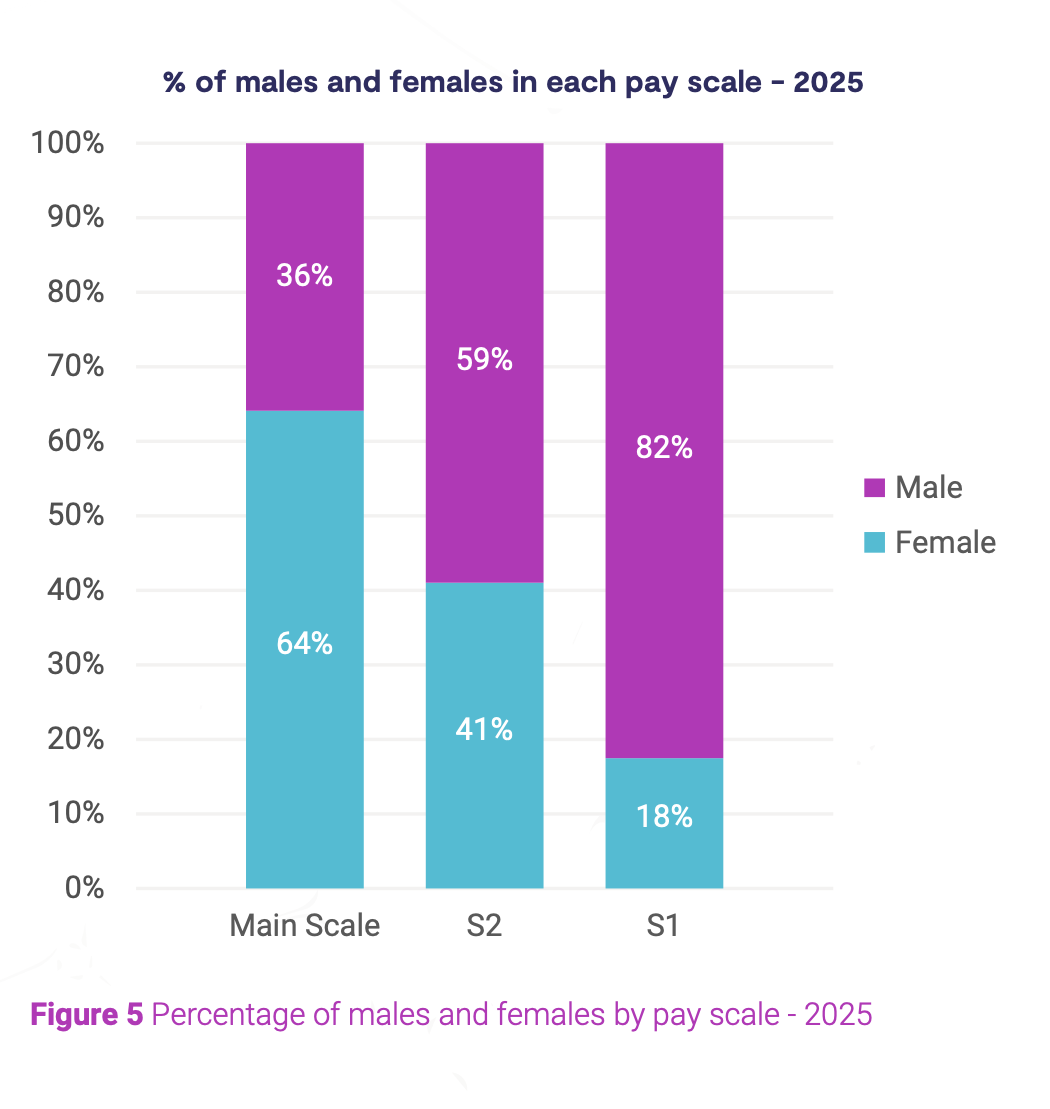
Figure 5: Percentage of males and females by pay scale 2025
Figure 6 shows the ethnicity split in each pay scale. The proportion of minority ethnic employees including White non-British in band S2 is larger than that of main scale and S1, at 32%, compared to 22% and 21% respectively.
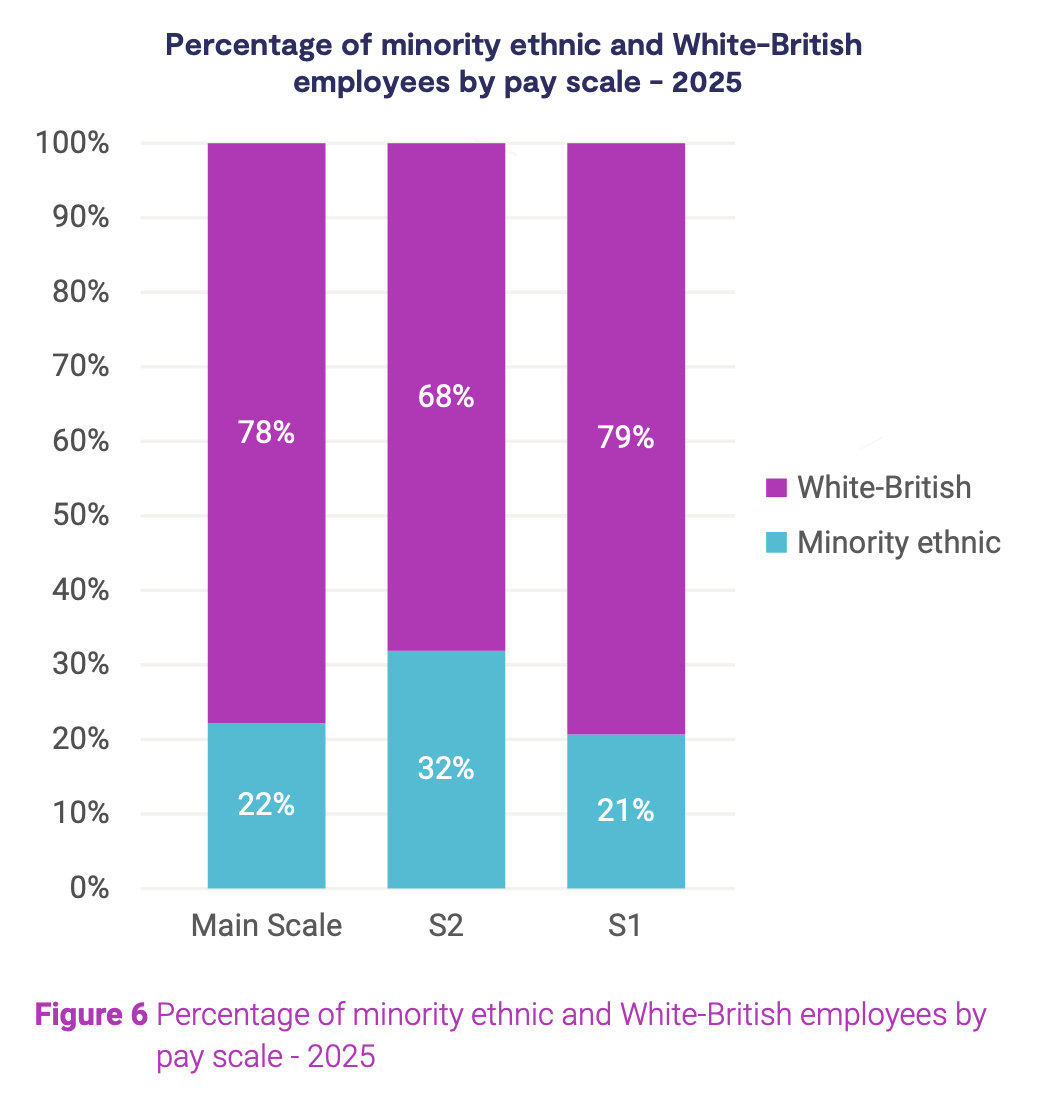
Figure 6: Percentage of minority ethnic and White-British employees by pay scale – 2025
To understand further the workforce profile, we conducted an analysis of the MRC pay scale. Employees under MRC terms and conditions are placed on the MRC scale. Within each band of the MRC pay scale there are three groups of progression ‘a’, ‘b’ and ‘s’ (with ’s’ being the highest level of progression). Figure 7 shows the count of employees in each group by sex, group ‘a’ has the highest count of employees, and ‘s’ the lowest. Each group has a similar count of females and males, group ‘b’ has the biggest difference with 23% more females than males. 14% of males and 13% females on the MRC scales are in the ‘s’ zone, this is a decrease of one percentage point for females and three percentage points for males since 2024.
It should be noted that there are ongoing plans to harmonise UKRI and MRC pay arrangements once we are able to do so.
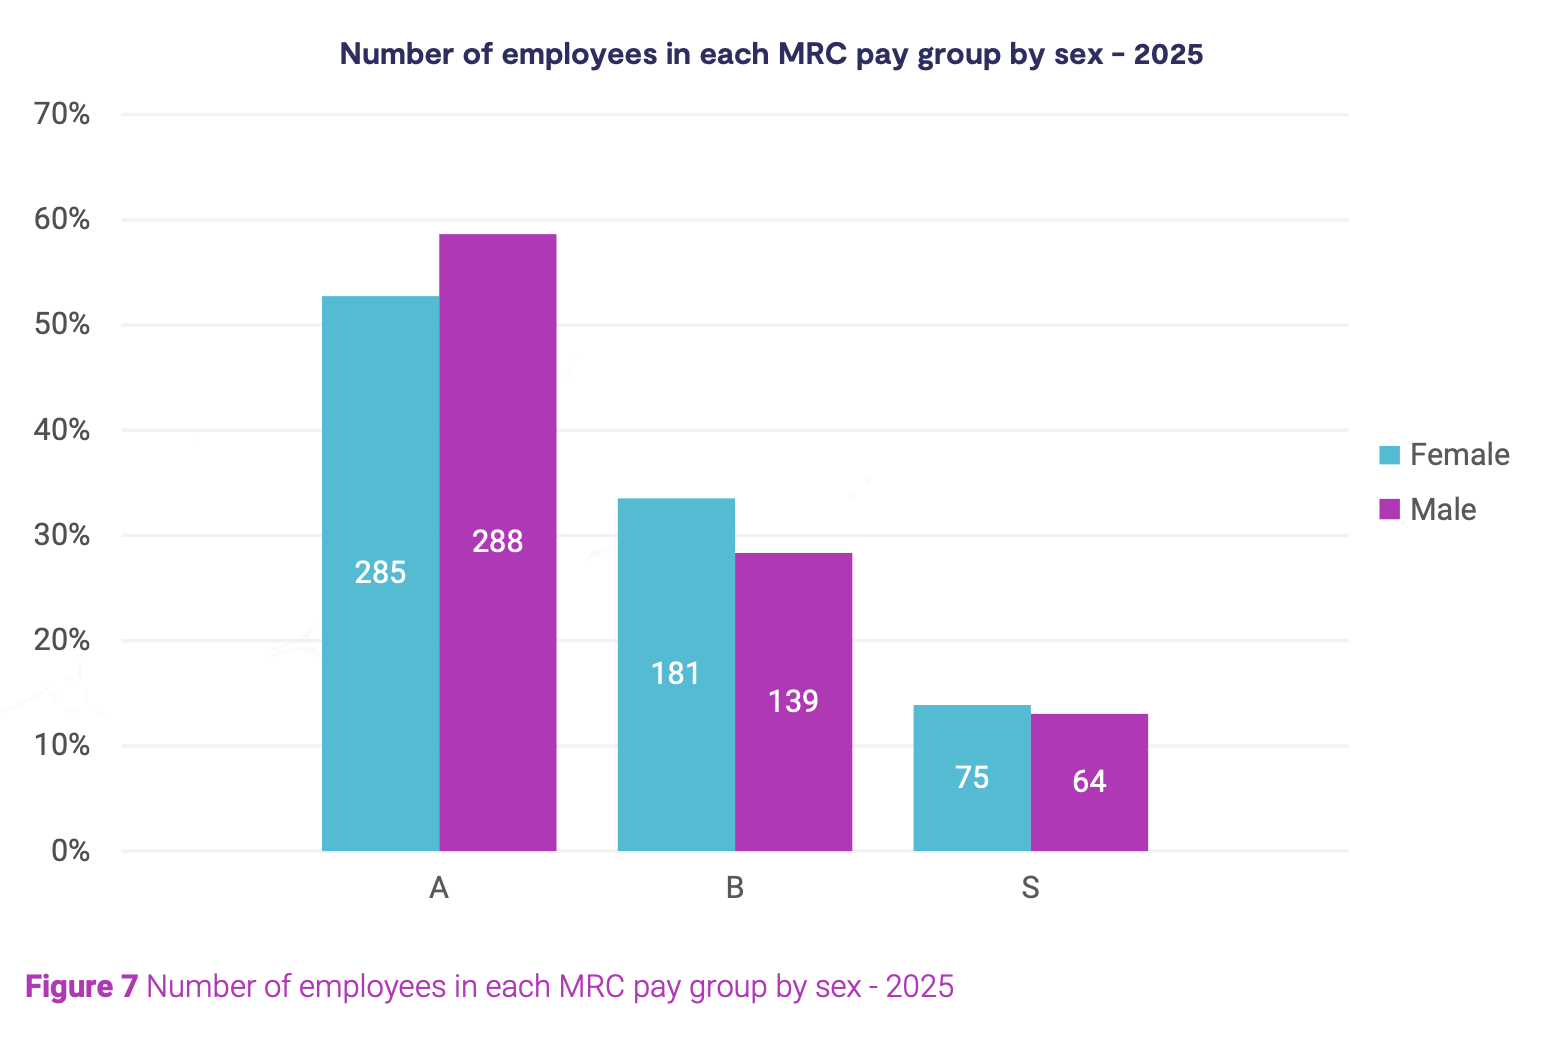
Figure 7: Number of employees in each MRC pay group by sex 2025
Salary analysis
The base salaries of UKRI employees are determined by their pay scale and band.
The base salary pay difference in 2024 and 2025 for each band within main scale, S2 and S1 by legal sex are detailed in figures 8 and 9 respectively. The Equal Pay Analysis looks at the average earnings of each band and compares them between males and females. A positive figure indicates a difference in favour of males and a negative figure indicates a difference in favour of females. The EHRC states that a pay difference of more than plus or minus 5% should be considered as significant, and a recurring difference of more than plus or minus 3% merits further investigation.
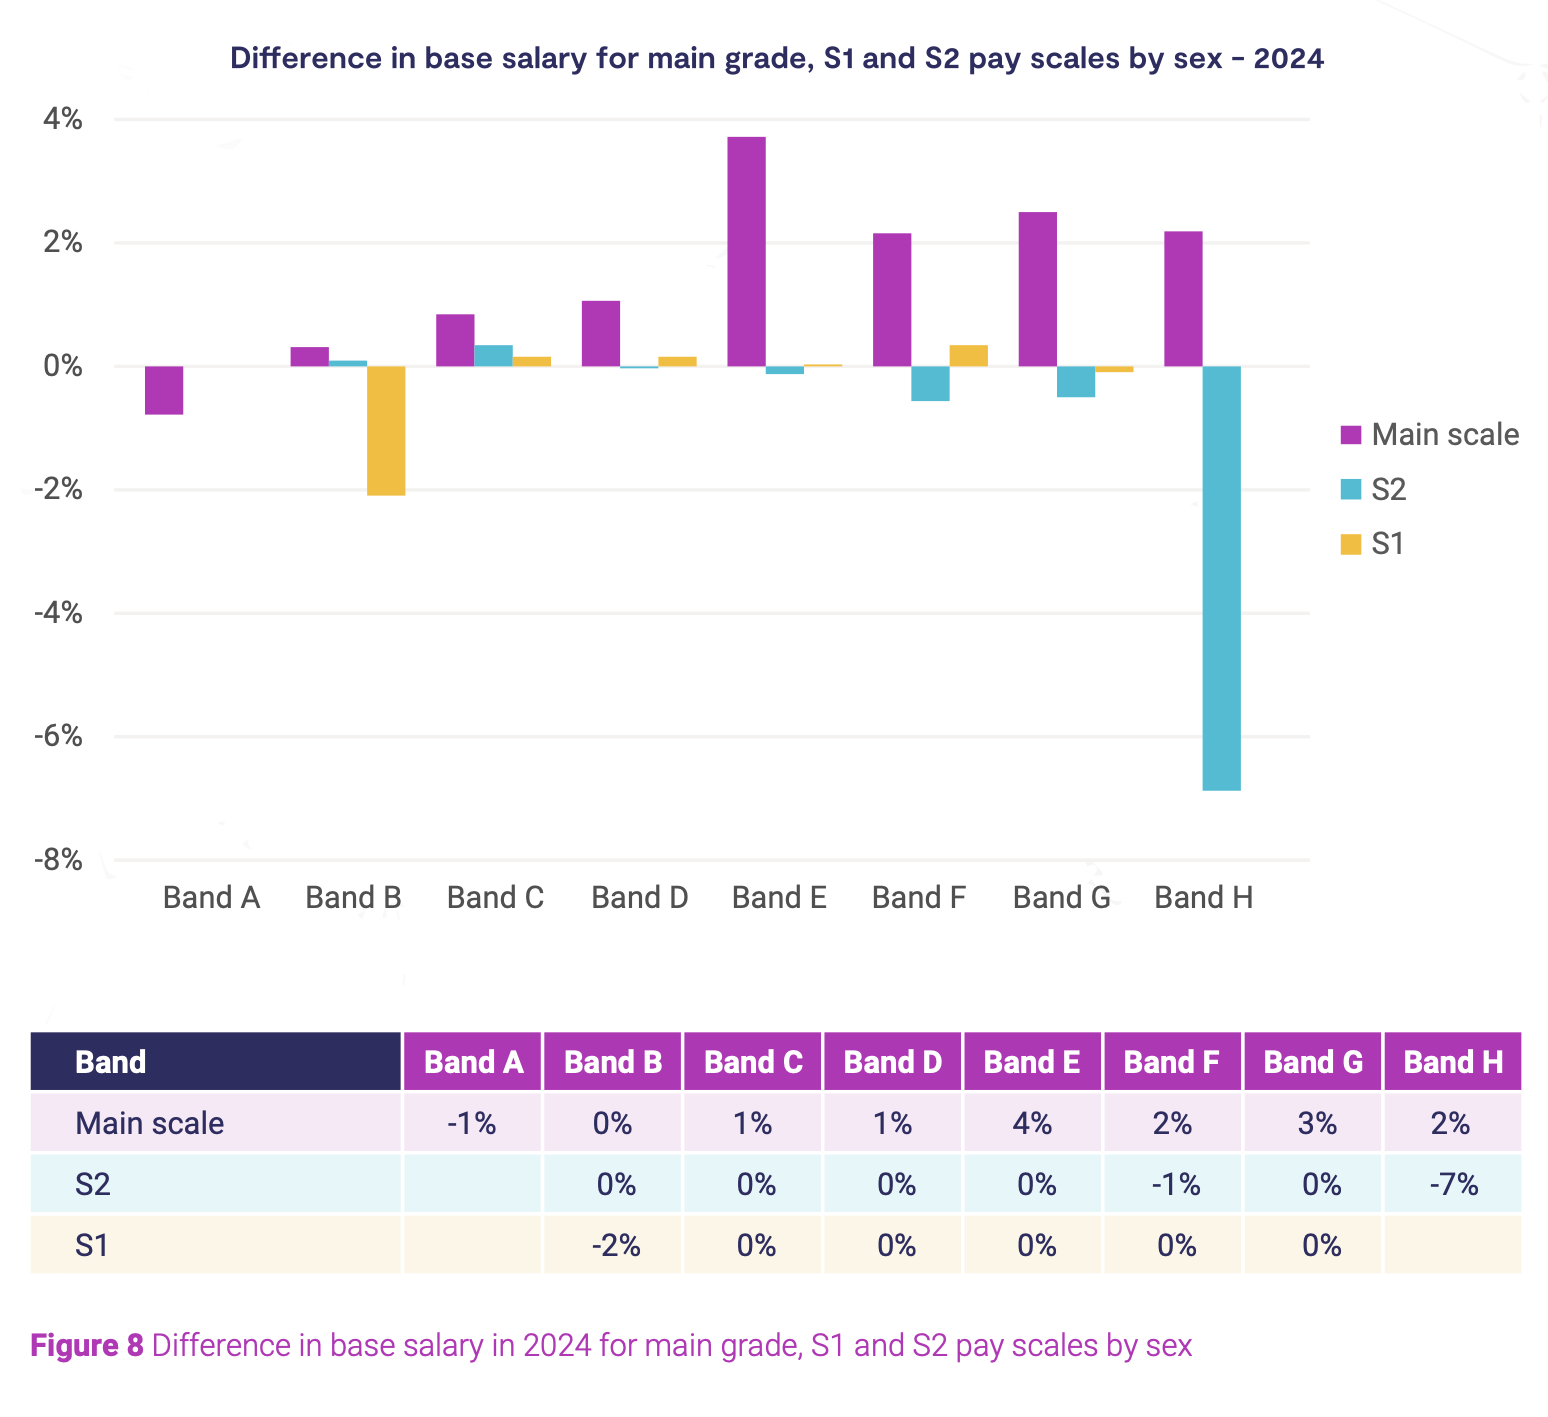
Figure 8: Difference in base salary in 2024 for main grade, S1 and S2 pay scales by legal sex
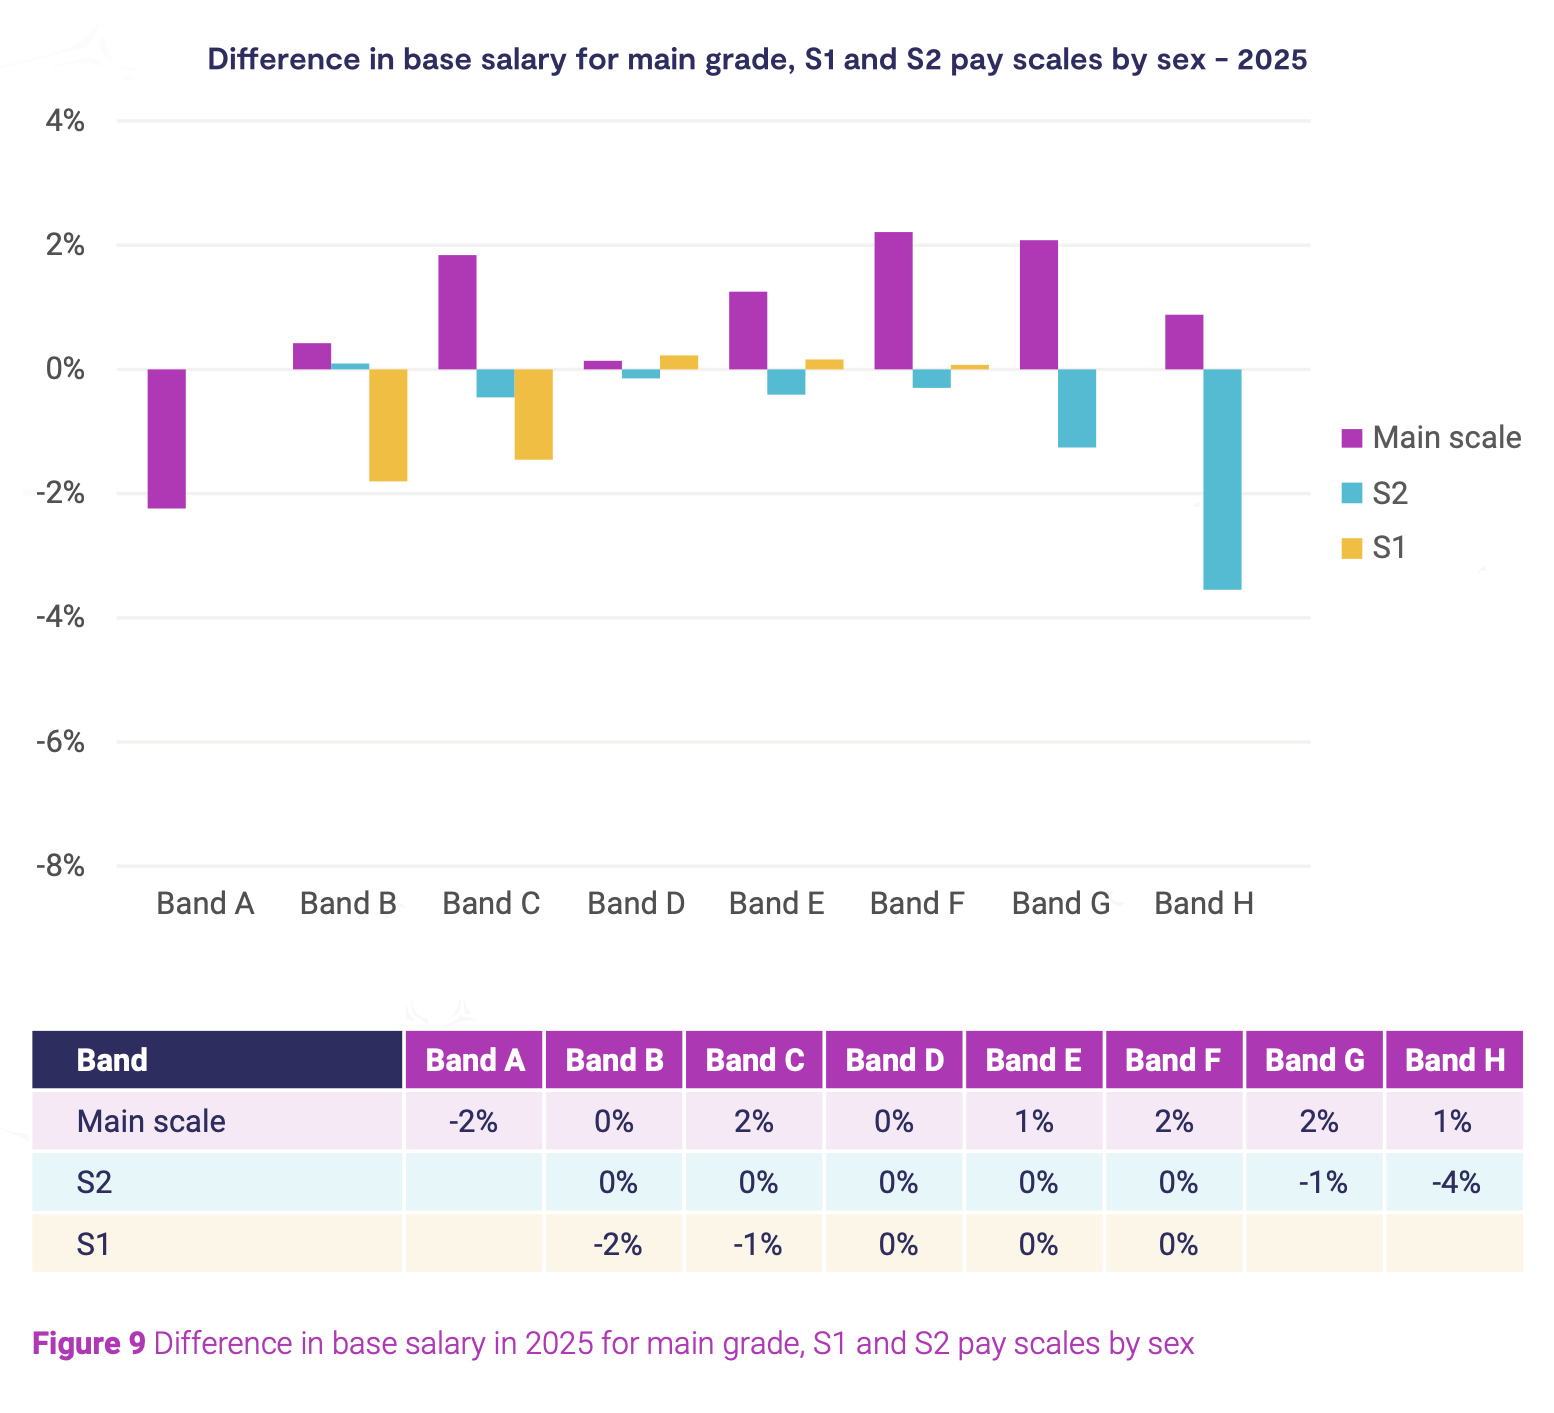
Figure 9: Difference in base salary in 2025 for main grade, S1 and S2 pay scales by legal sex
The pay difference in each band and pay scale is below 5% across all grades in 2025. There has been a notable reduction between 2024 and 2025 in this difference at main scales bands D and E, by one percentage point and three percentage points respectively. The only grade with a difference greater than 3% is band H S2, with the pay difference being minus 4% (males are paid 96% of what females are paid). This has reduced from minus 7% in 2024, and we will continue to monitor this situation, however it is important to note that band H S2 has an employee count of 38, only eight of whom are females. This small count of females means that variation can be larger.
Allowances
In addition to their base salary, employees may also receive a recruitment and retention allowance (RRA) or specialist allowance (SA). These allowances are put in place where market rates significantly exceed those available through UKRI’s pay rates, meaning it is demonstrably difficult to attract and retain employees in a particular discipline or skill set, nationally or at a particular location. This may be where pay bands do not provide sufficient scope to recruit or retain an individual or where appointment high up the pay band would limit future base pay movement or compromise base pay relativities.
Employees may also receive a responsibility allowance (RA). These are allowances for cases where individuals have a clear and appreciable additional responsibility compared to other members of the same band. Where such a situation arises, payment of a responsibility allowance may be considered on the clear understanding that it will cease when these extra responsibilities come to an end.
Figures 10 and 11 shows the difference in the percentage of females and males that are in receipt of an RA or an RRA (SA) respectively. Band A has been removed from this analysis due to the small group sizes.
The proportion of males and females receiving an RA at bands C to E and G is similar, while for bands B and F the proportion of males is greater than females. The percentage of females receiving an RA at band H is greater than males. However it should be noted that only 38% of employees in this band are females and therefore each person with an RA has a bigger impact on the % with an RA than for males. The overall trend for each band is the same as in 2024, with the exception of band B, where the difference reduces to three percentage points from eight in 2024.
There is a higher proportion of males receiving an RRA (SA) for bands C, F to H. This trend is similar to 2024, with the exception of band E, where the difference is now one percentage point compared to four.
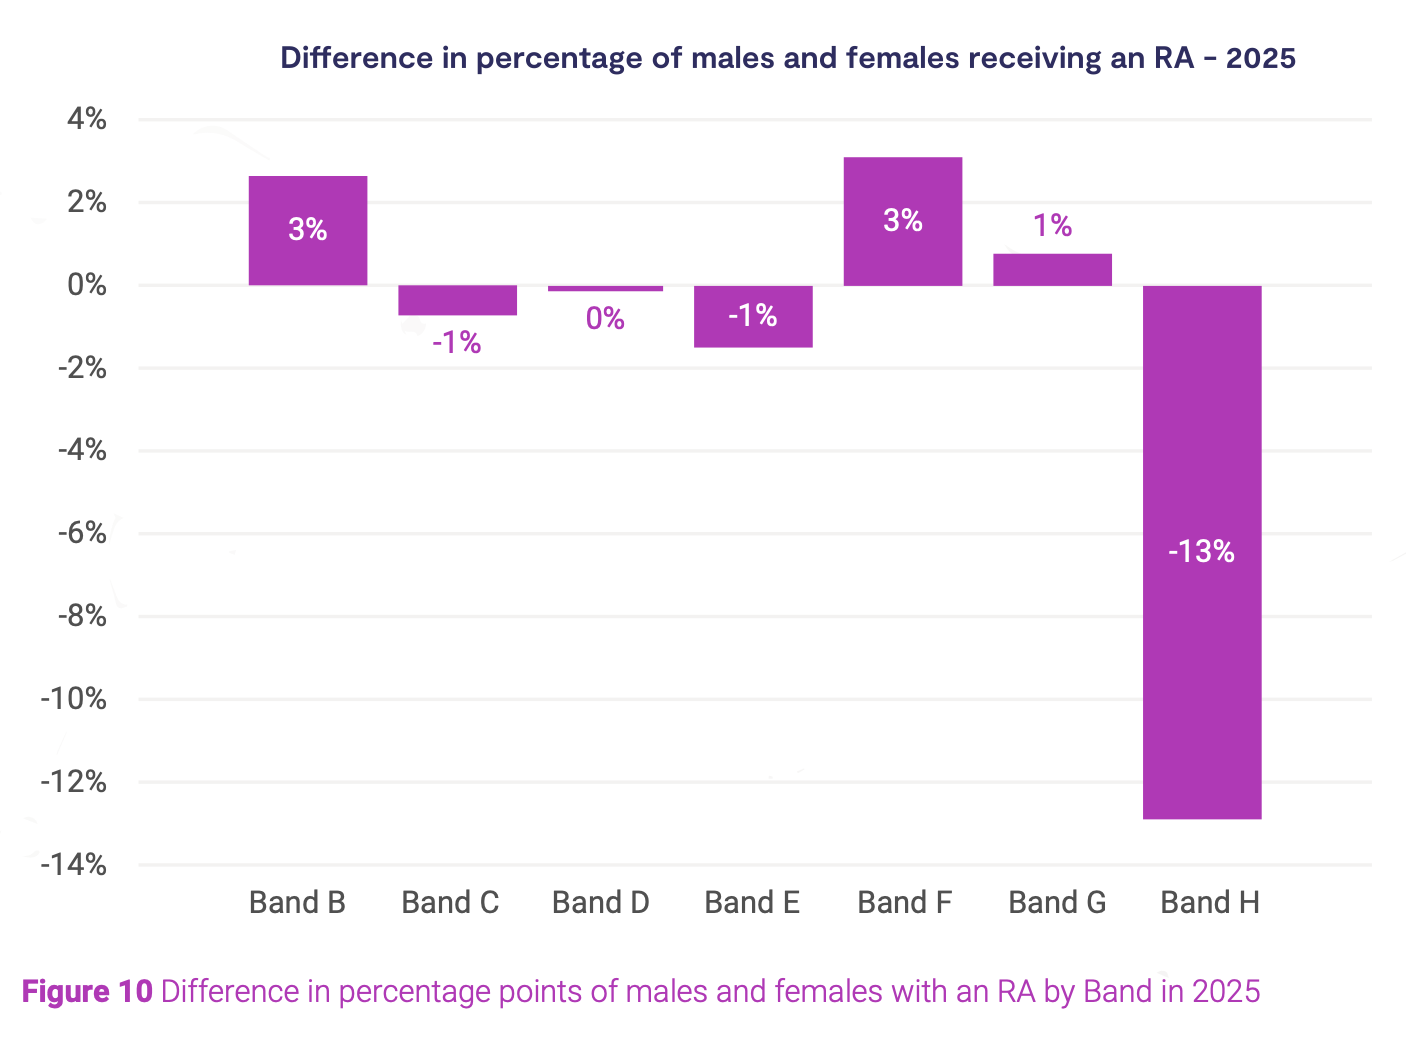
Figure 10: Difference in percentage points of males and females with an RA by band in 2025
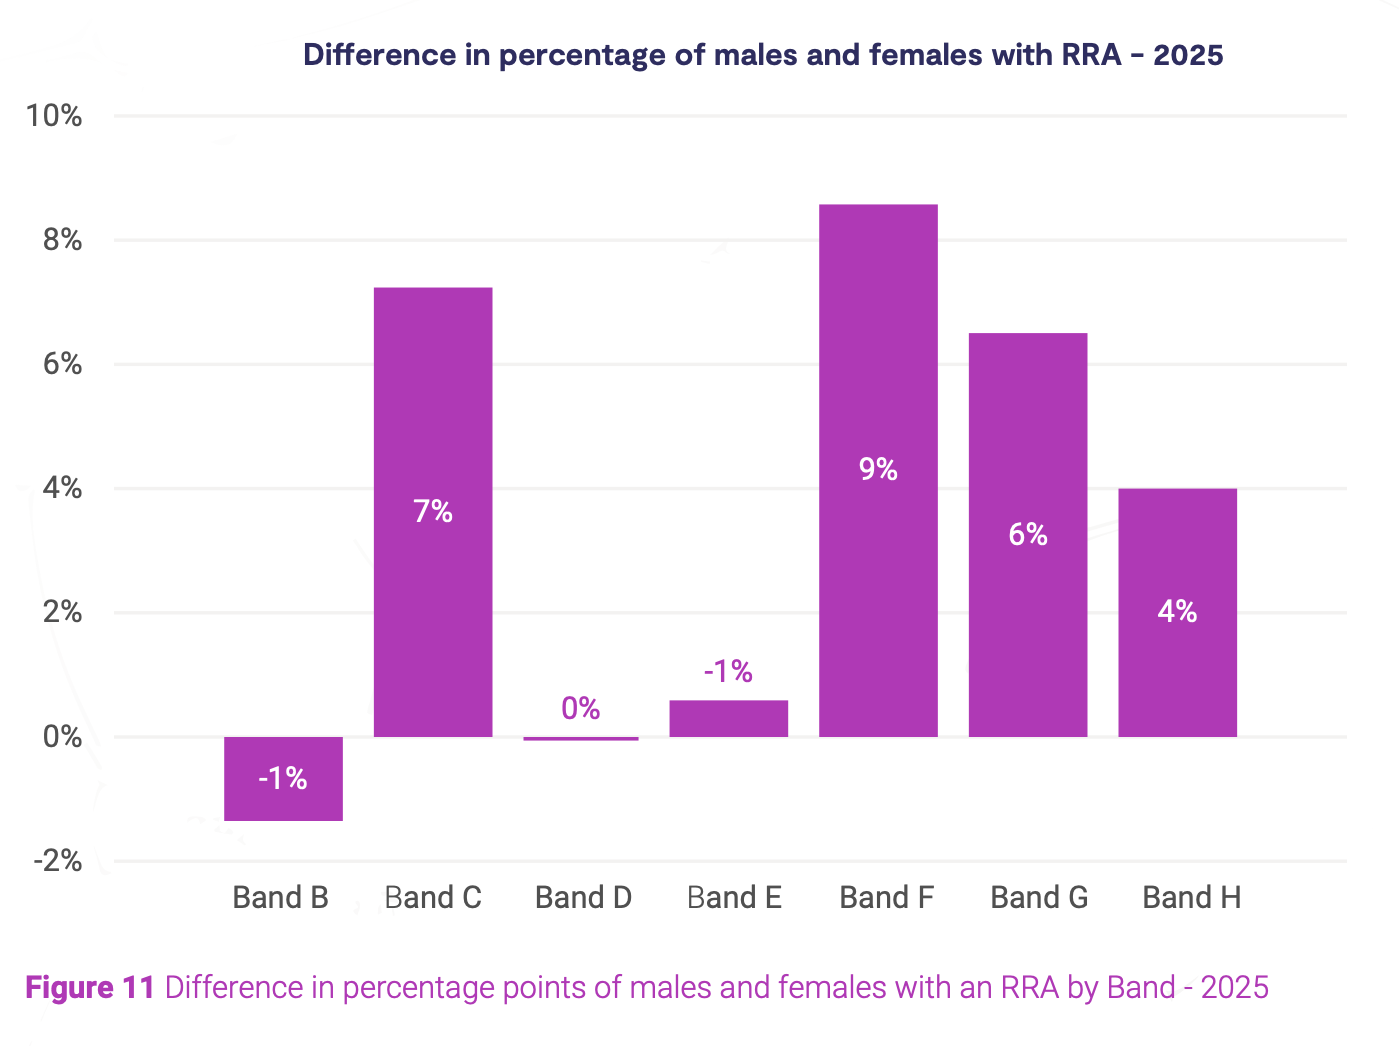
Figure 11: Difference in percentage points of males and females with an RRA by band 2025
On average, females receive a higher RRA, at £3,392 compared to £3,074 for males. However, males receive a higher RA at £3,809 compared to £3,618 for females.
Figure 12 shows the pay difference including RRAs or SAs by band by sex. The pay difference at all grades is less than 5% with the exception of band H S2 at minus 5%.
Here again, this difference must be interpreted in the context of the small number of females in this category.
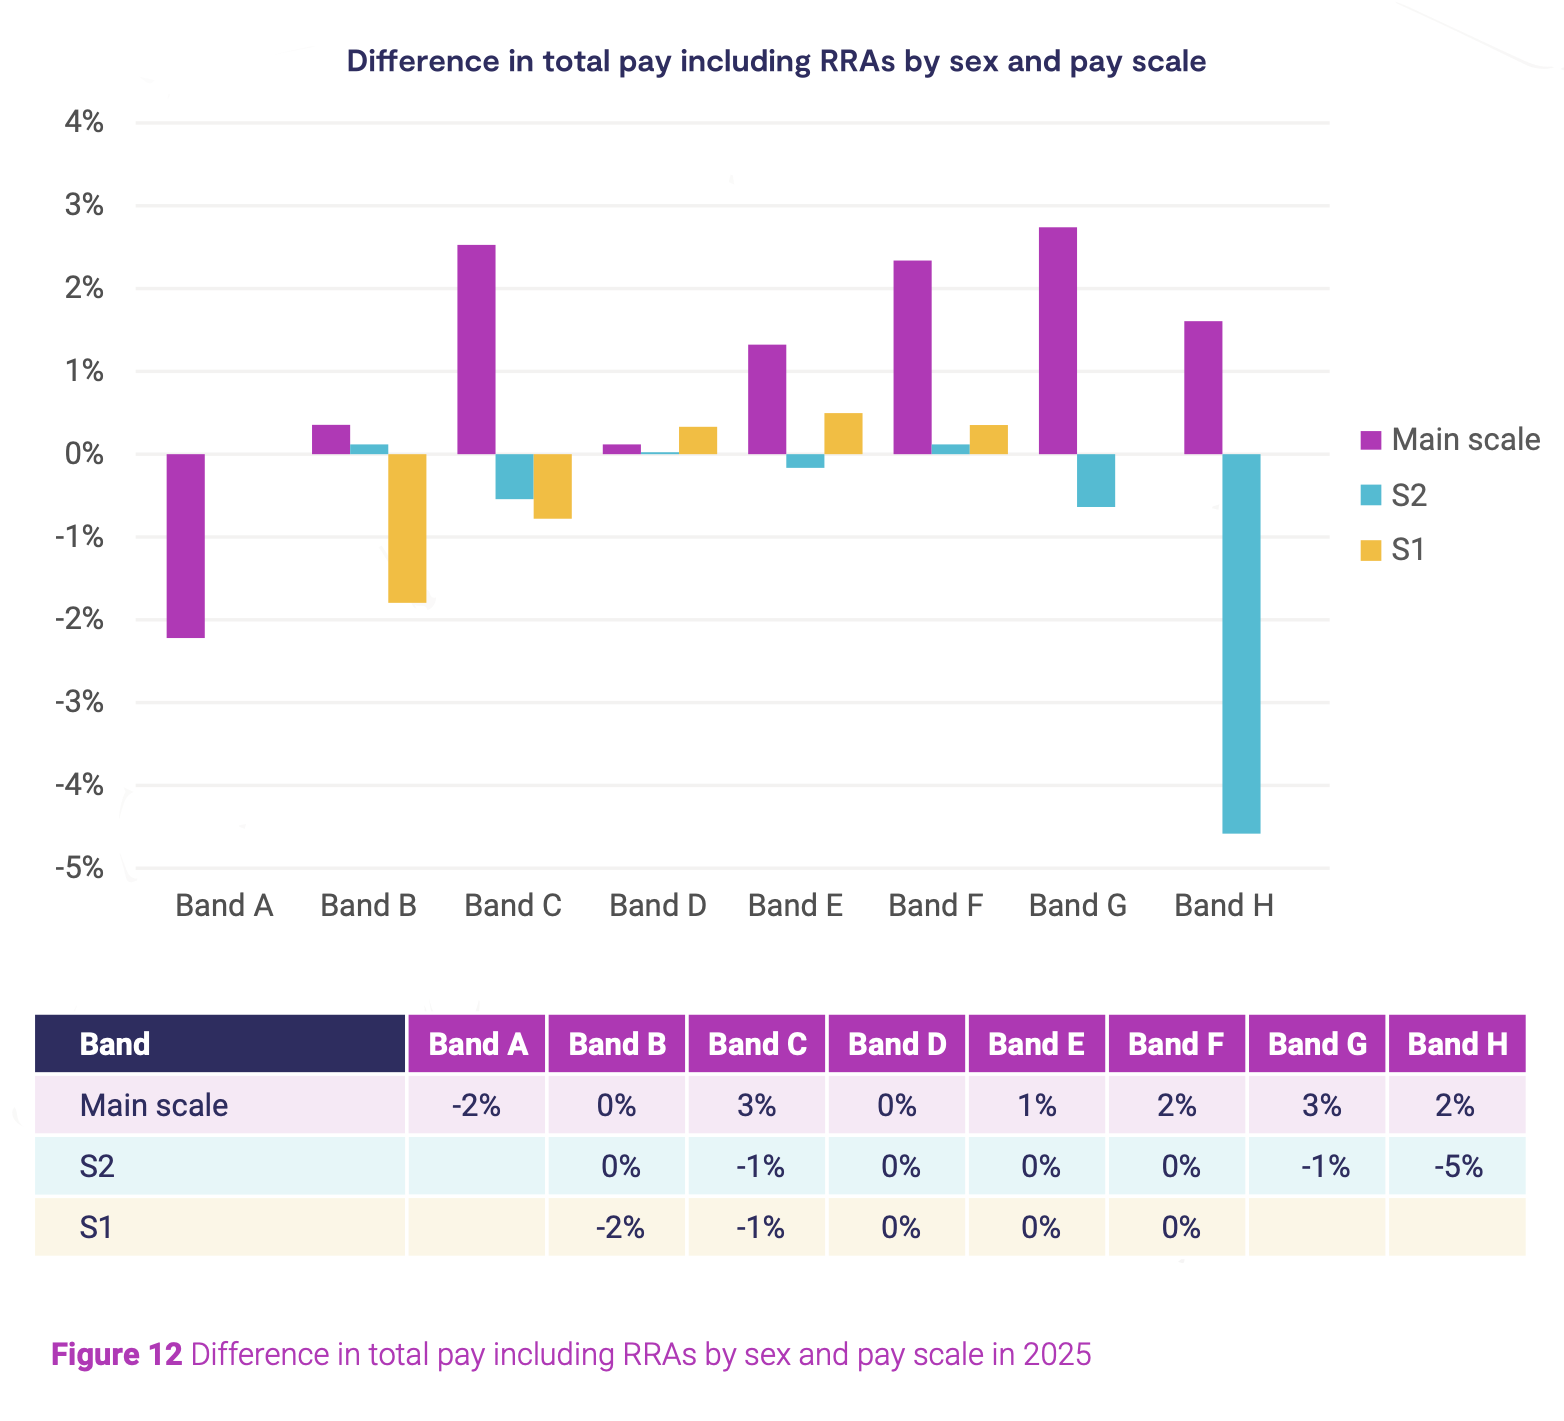
Figure 12: Difference in total pay including RRAs by sex and pay scale in 2025
Ethnicity
To investigate equal pay in relation to ethnicity, analysis was conducted to compare the average salary of minority ethnic employees including White non-British and employees with a White -British ethnicity (Figure 13). A HM Revenue & Customs positive figure indicates a difference in favour of White-British employees, while a negative figure indicates the difference is in favour of minority ethnic employees.
Bands B to G have a difference of less than 3% between groups. At band H main scale and S2, on average employees with a minority ethnic background are paid 4% more than employees with a White British background. This gap has reduced since 2024, by two percentage points for the main scale and one percentage point for S2.
Due to 33% of the employee population not declaring their ethnicity data it is harder to draw meaningful conclusions from these analyses. Additionally, because of the small number of employees identified in each minority ethnic group, all minority ethnic groups were aggregated into one larger ‘minority ethnic group’. This group consisted of all employees reporting an ethnicity different to White-British. This is in line with the government’s preferred style when writing about ethnicity. This was to enable more statistically robust comparisons and to preserve anonymity. We recognise that aggregating ethnic groups in this way can mask the experiences, differences and disparities of individual ethnicities and will seek to encourage more employees to share their ethnicity to enable more detailed analysis in the future.
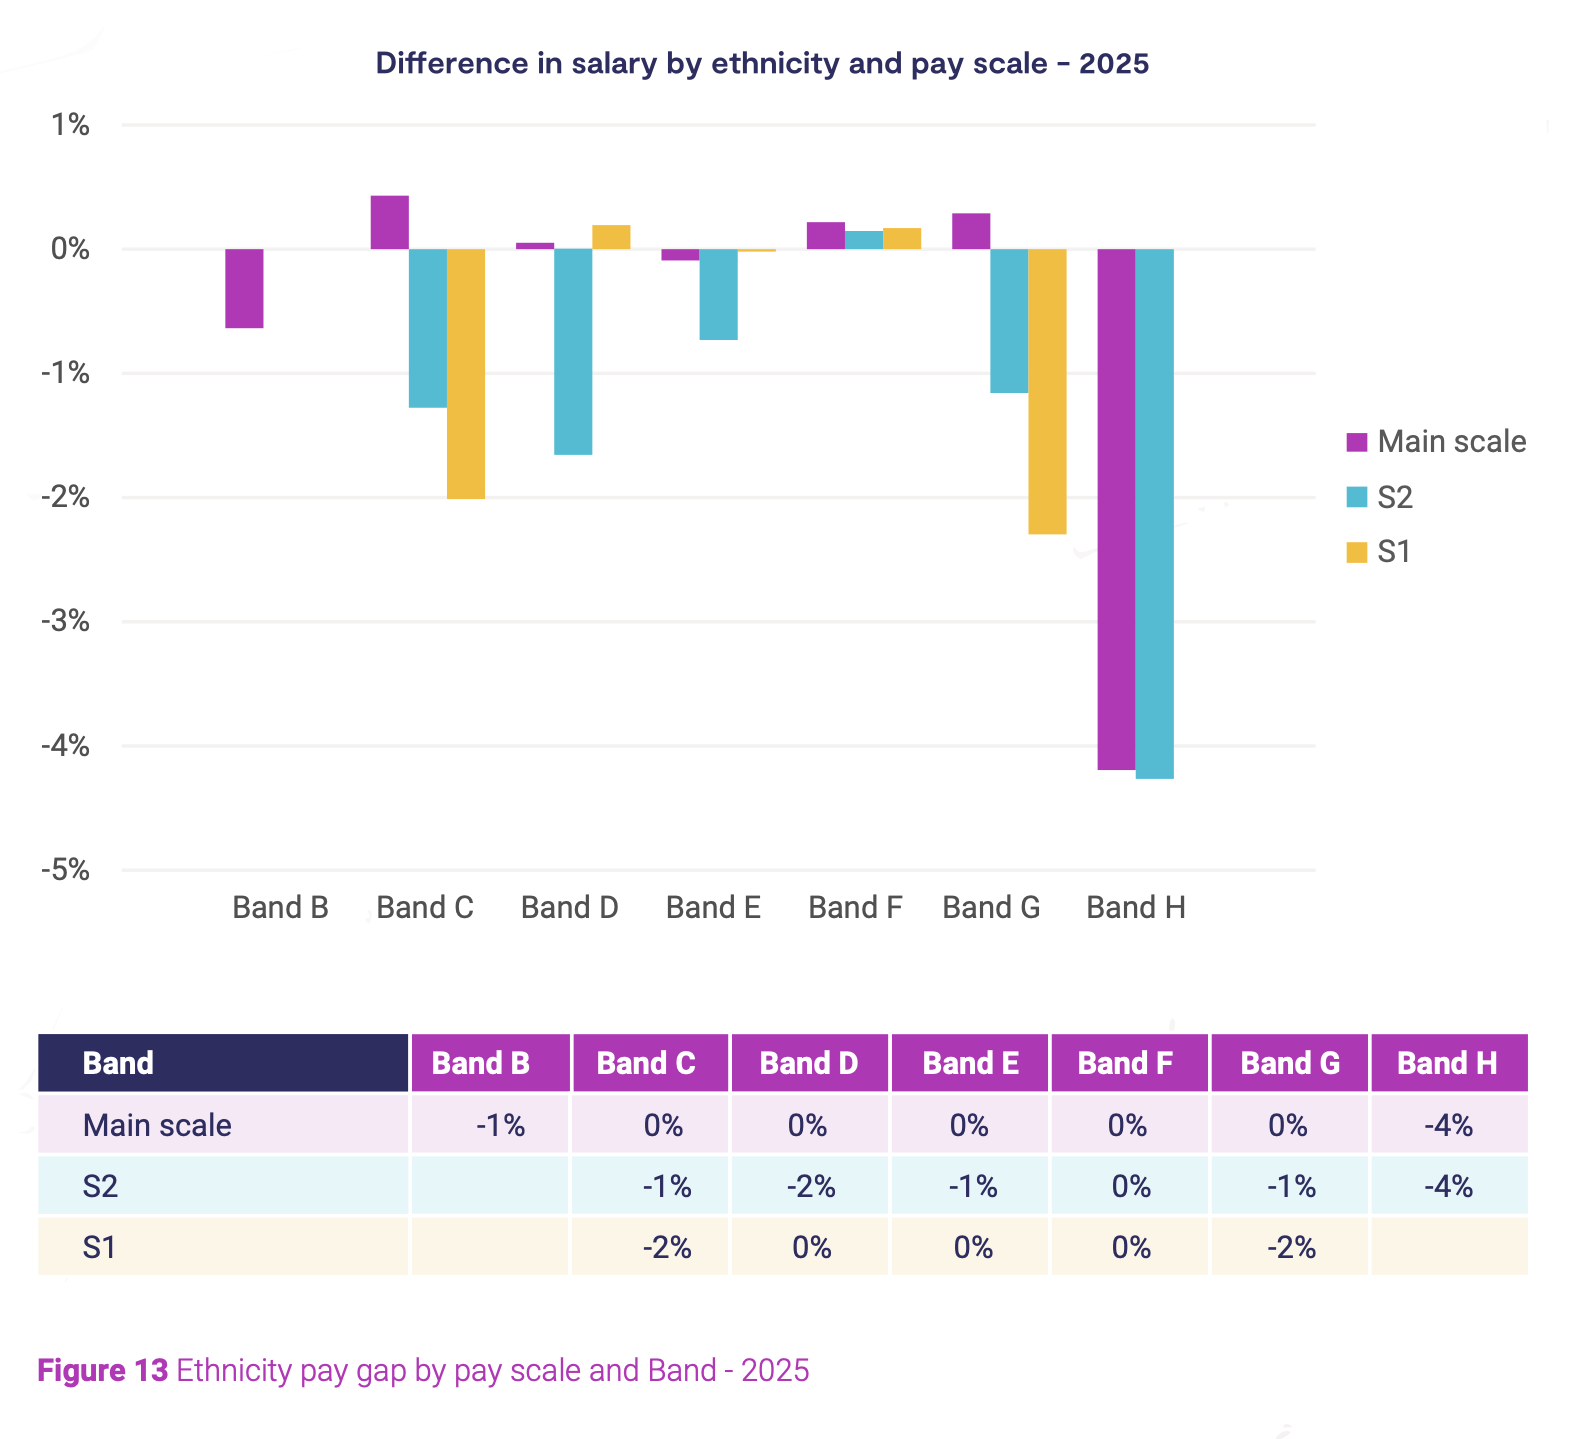
Figure 13: Ethnicity pay gap by pay scale and band 2025
Pay on appointment
To enhance our understanding of pay upon appointment, an analysis was conducted on employees hired between July 2023 and March 2024, and July 2024 and March 2025. Table 1 indicates that in 2025 the proportion of females joining on the band minimum is greater than that of males by five, 14 and 15 percentage points in main scale, S2 and S1 scales respectively.
The percentage of males starting on the band minimum has reduced in all scales, however for females it has increased in the S2 scale.
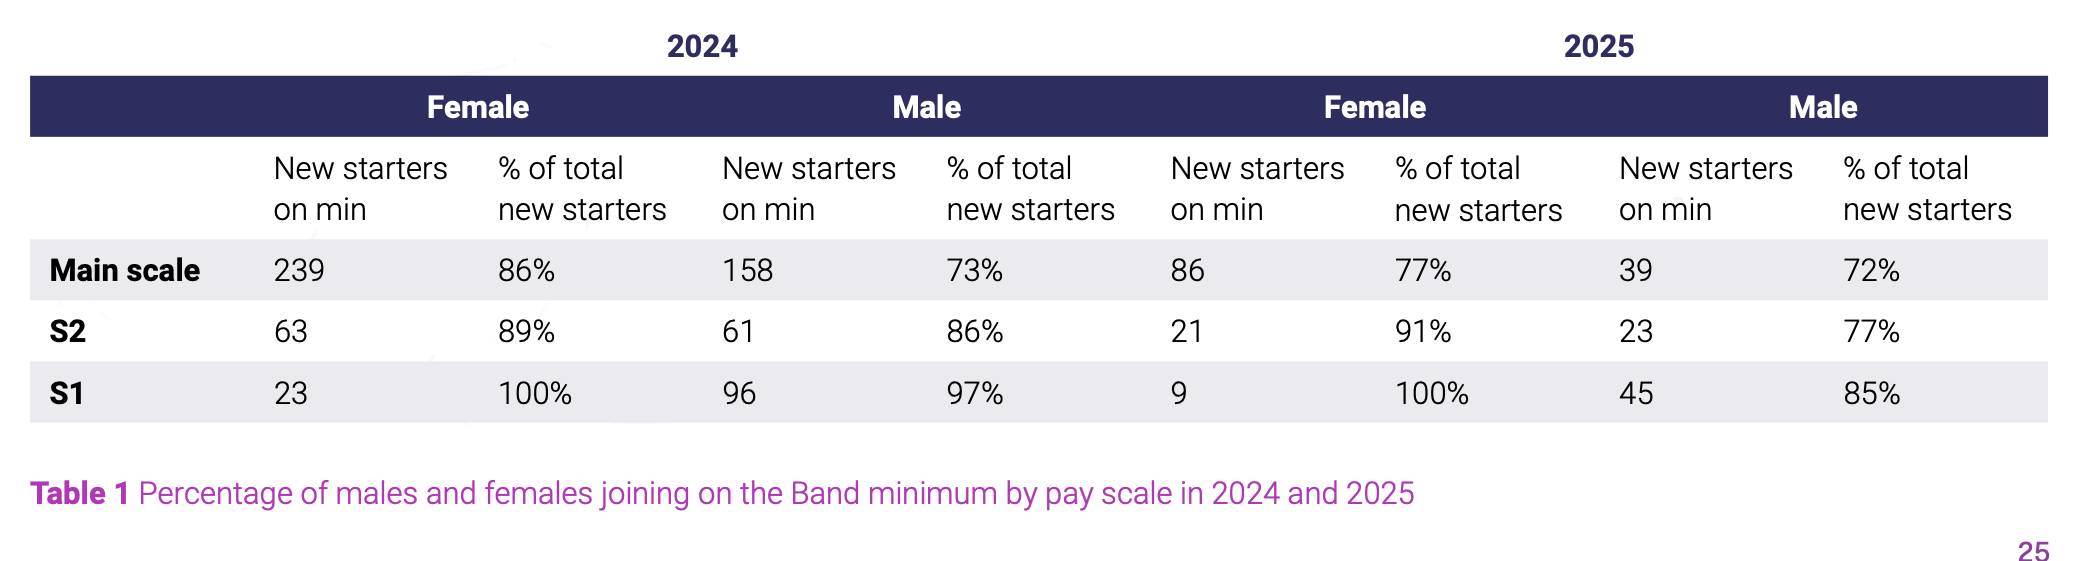
Table 1: Percentage of males and females joining on the band minimum by pay scale in 2024 and 2025
For greater understanding of those joining on salaries above their band minimum, further analysis was conducted of the amount above the band minimum of their pay on appointment. This shows that the mean percentage above minima for newly appointed males is higher than that of females in main scale and S2 scale.
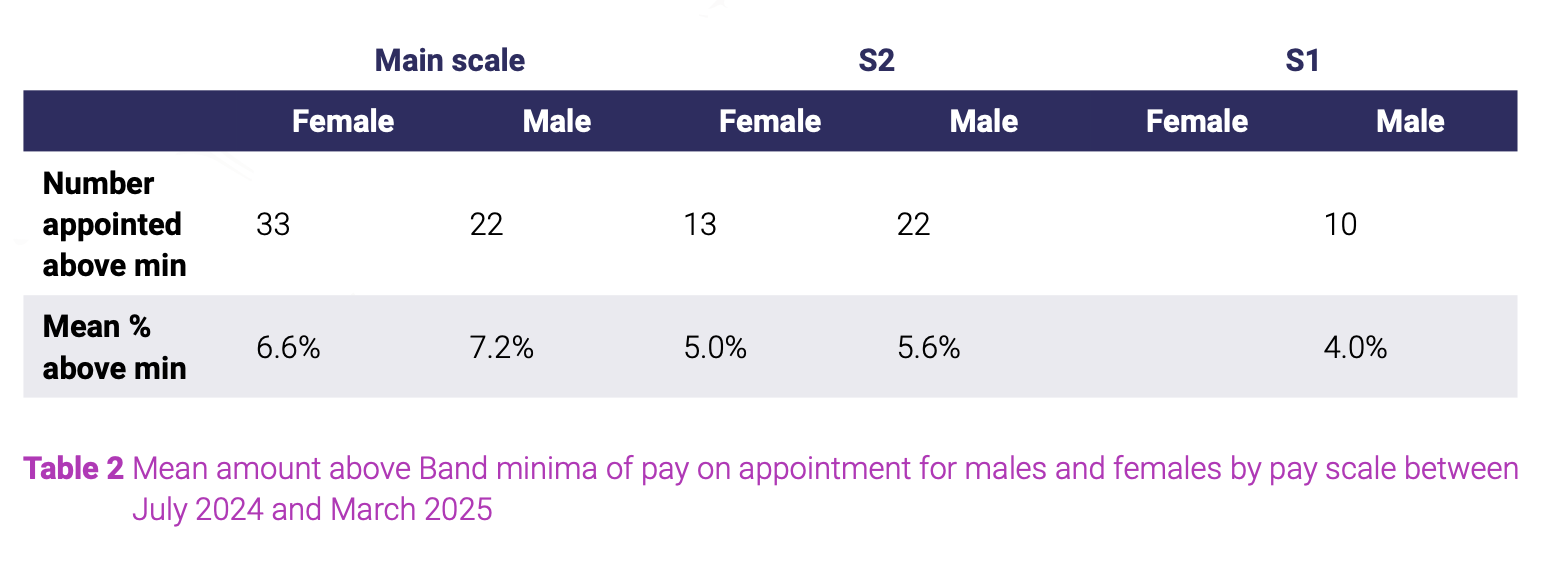
Table 2: Mean amount above band minima of pay on appointment for males and females by pay scale between July 2024 and March 2025
To investigate the disparity in pay upon appointment between males and females, a detailed analysis of the average salaries for new starters in each band was conducted (as shown in Table 3). The pay gap is calculated as the percentage difference between the two values, determined by subtracting the average female salary from the average male salary, then dividing by the average male salary. A negative pay gap indicates that the average salary for female employees is higher than that for male employees.
The group sizes for band A, G and H were less than 10 and are therefore not included in the analysis. S1 band B, C and F, and main scale band F were also removed for this reason.
The salary analysis reveals a pay gap of less than 3% in all grades, except for band F S2, where the pay gap is 3%.
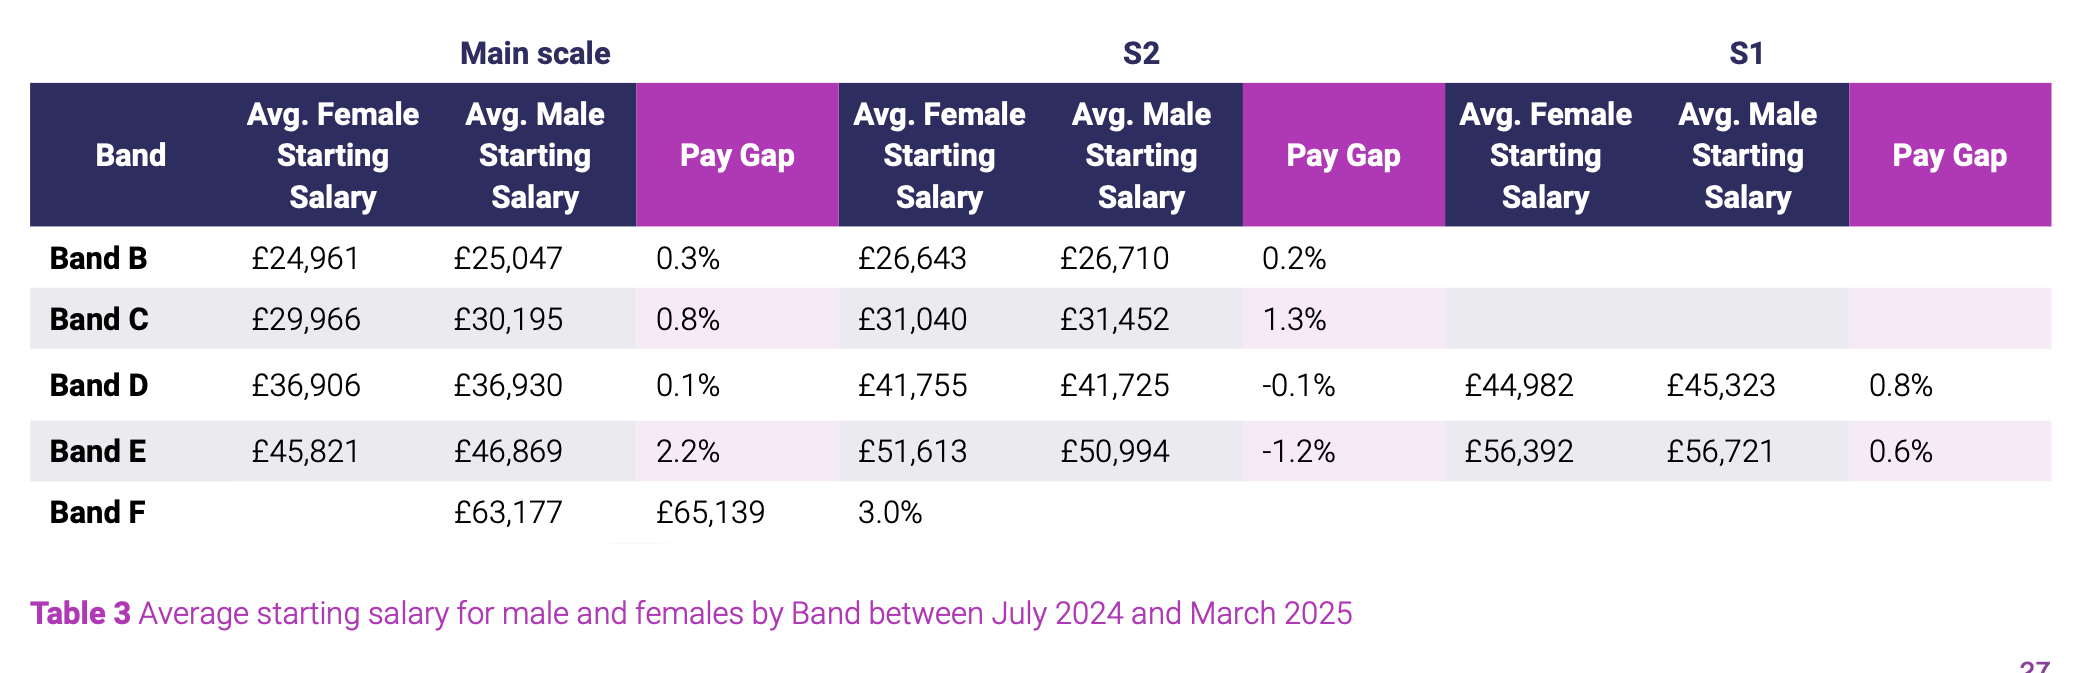
Table 3: Average starting salary for male and females by band between July 2024 and March 2025
Promotions
Figure 13 shows the proportion and count of employees in the preceding band promoted into each band by sex. A similar proportion of males and females were promoted into bands D to G. A significantly higher proportion and number of males were promoted into band D compared to females, with an eight percentage point difference.
The analysis shows that more females have been promoted into bands C and F, while a higher number of males have been promoted into D and E. The most significant disparity is observed in band D, where 8% more females were promoted than males. Various factors may influence these promotion patterns, such as the:
- proportion of females in the preceding band (band D is 57% female)
- average length of service in the preceding band (females in band C average 7.9 years of service compared to 6.7 years for males)
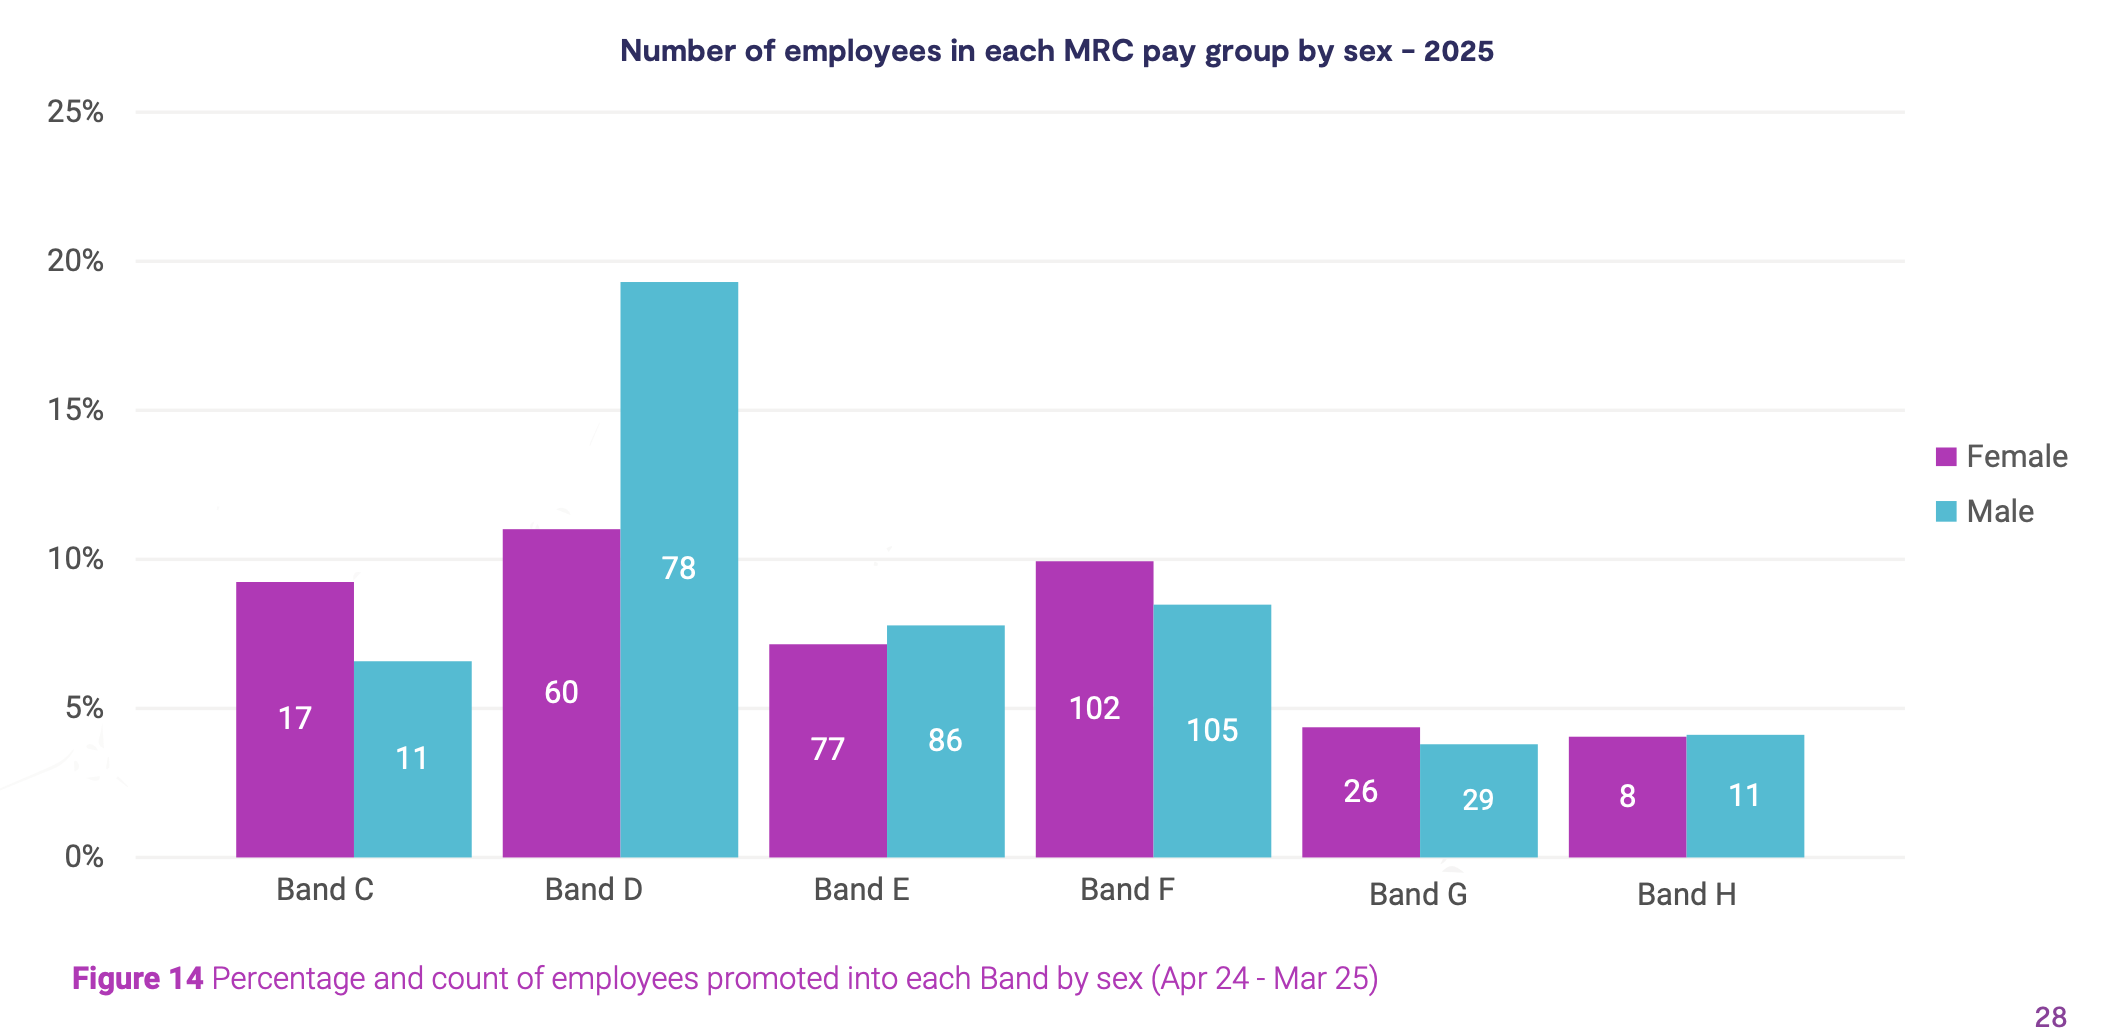
Figure 14: Percentage of employees, and count of employees promoted into each band by sex between April 2024 and March 2025
Overtime
Figure 15 illustrates the number of employees claiming overtime over the past year. It should be noted that this analysis includes employees who are apprentices and placement students.
The data indicates that, across UKRI, a higher number of males claim overtime compared to females. However the areas of UKRI with the highest number of employees claiming overtime are STFC National Labs (508 employees) and STFC Chief Operating Officer group (125 employees), where the proportion of males is 76% and 68% respectively, including apprentices and placement students. Further analysis reveals that 15% of female employees at STFC National Labs claim overtime, compared to 21% of male employees.
The average annual overtime payment for those who claim it is £3430 for males and £1,310 for females.
Overall, the total number of employees claiming overtime has decreased by 34% since 2024, 45% fewer females and 30% fewer males.
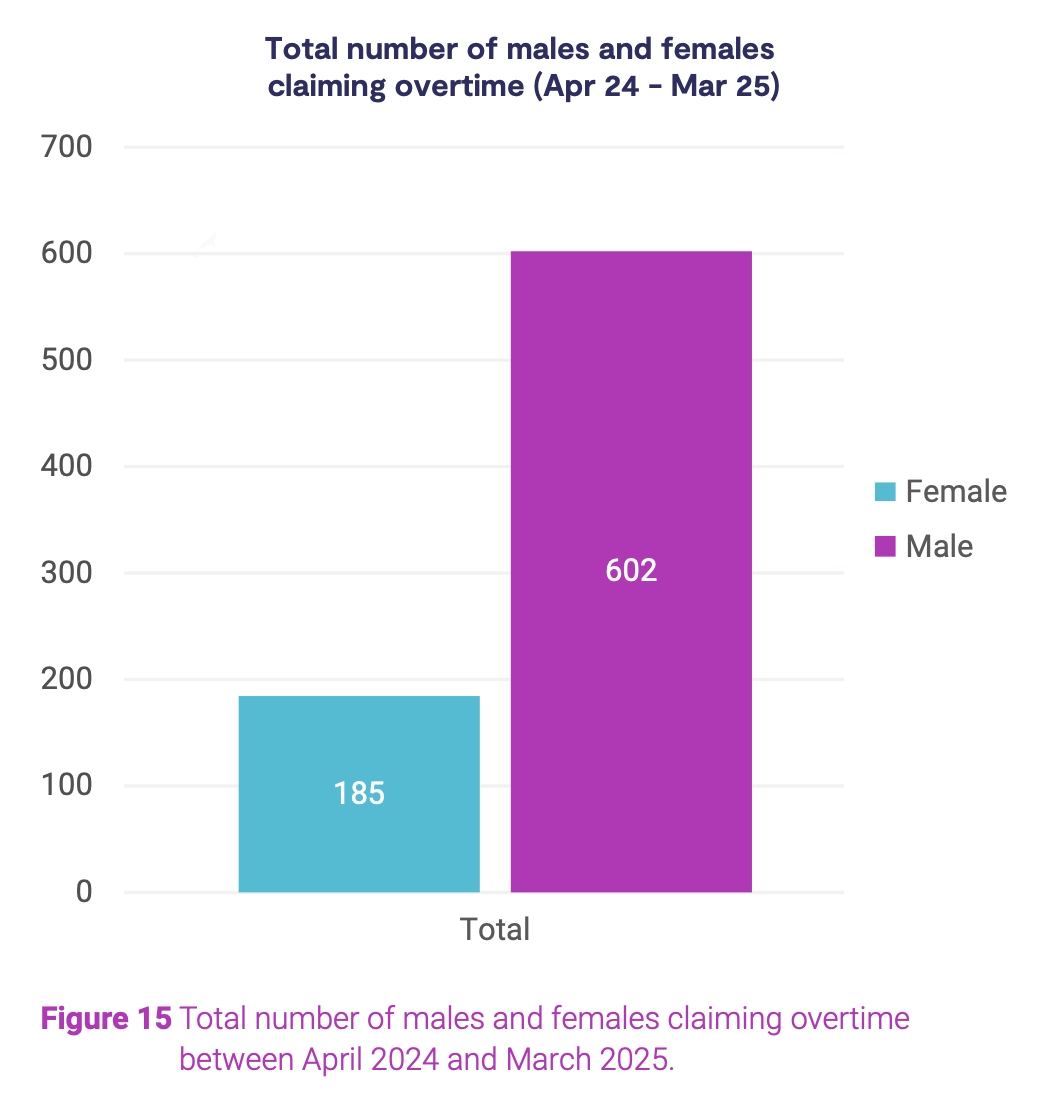
Figure 15: Total number of males and females claiming overtime between April 2024 and March 2025
Bonus analysis
UKRI provides an end-of-year bonus based on employee performance ratings, with those rated as ‘exceeding expectations’ receiving a higher bonus than those rated as ‘achieving expectations’. All employees eligible for the scheme are included, which includes some employees on non-standard pay scales. It should be noted that employees on the MRC Special Award Scheme (SAS) bonus scheme have been included in this bonus analysis with employees receiving the ‘excellent’ and ‘outstanding’ rating being included in the ‘exceeds expectation’ category.
Employees can also receive an ‘not achieved expectations’ rating, however this has been excluded from analysis as the proportion of employees receiving this rating was less than 0.5%.
Figure 16 depicts the distribution of these performance ratings by sex for the performance year April 2023 to March 2024. Among female employees, 75% received an ‘achieves expectations’ rating, and 25% received an ‘exceeds expectations’ rating. The distribution for male employees is comparable, with 76% receiving an ‘achieves expectations’ rating and 24% receiving an ‘exceeds expectations’ rating. These findings are consistent with the previous EPA conducted in 2022.
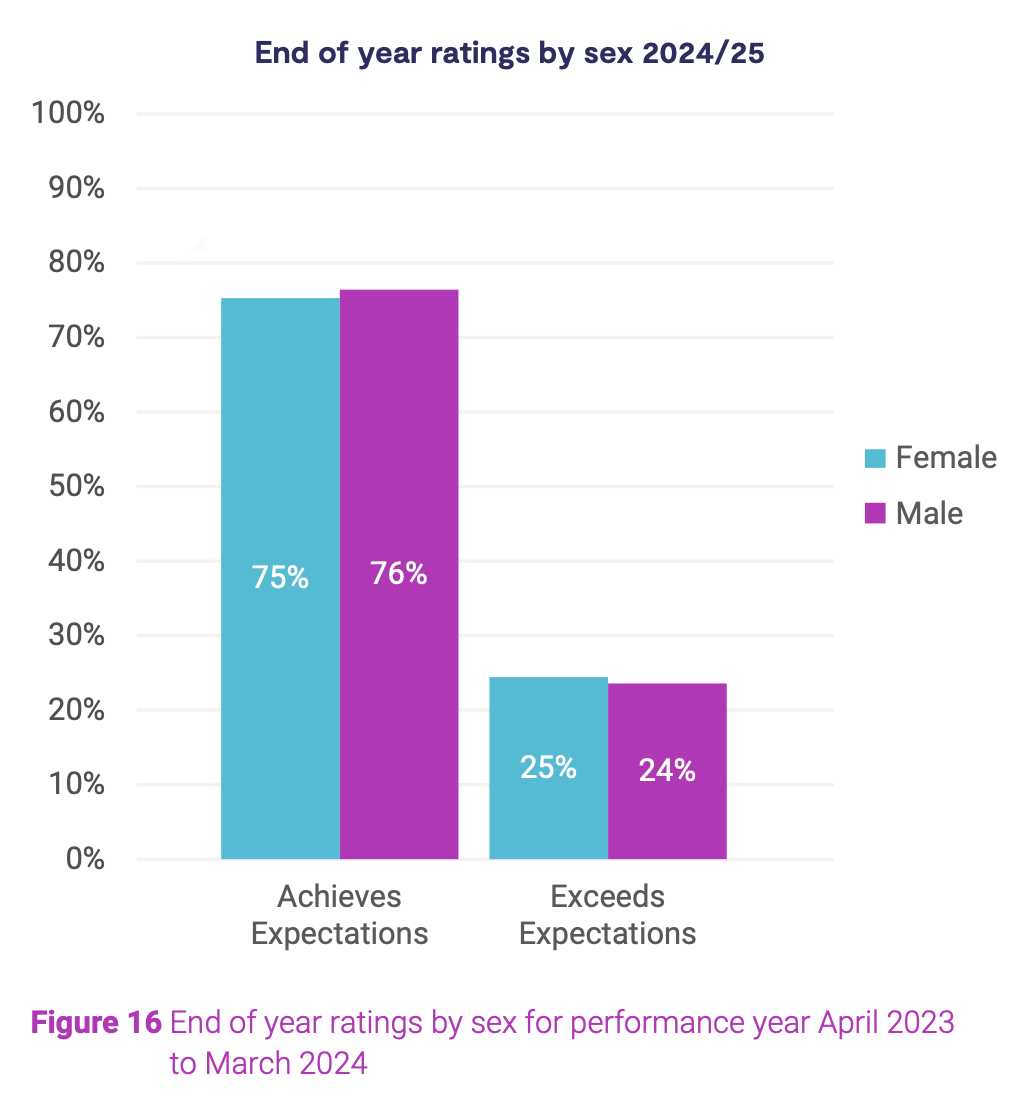
Figure 16: End of year ratings by sex for performance year April 2023 to March 2024
Figure 17 shows the distribution of each rating by full time and part time employee. It shows that proportion of part time employees receiving an ‘exceeds expectations’ rating is three percentage points lower than the proportion of full-time employees receiving the ‘exceeds expectation’ rating. This gap has reduced from the 2021 analysis in the 2022 EPA which showed a seven percentage point difference, indicating that action to highlight and address this difference has been effective, and we will continue to monitor progress on this.
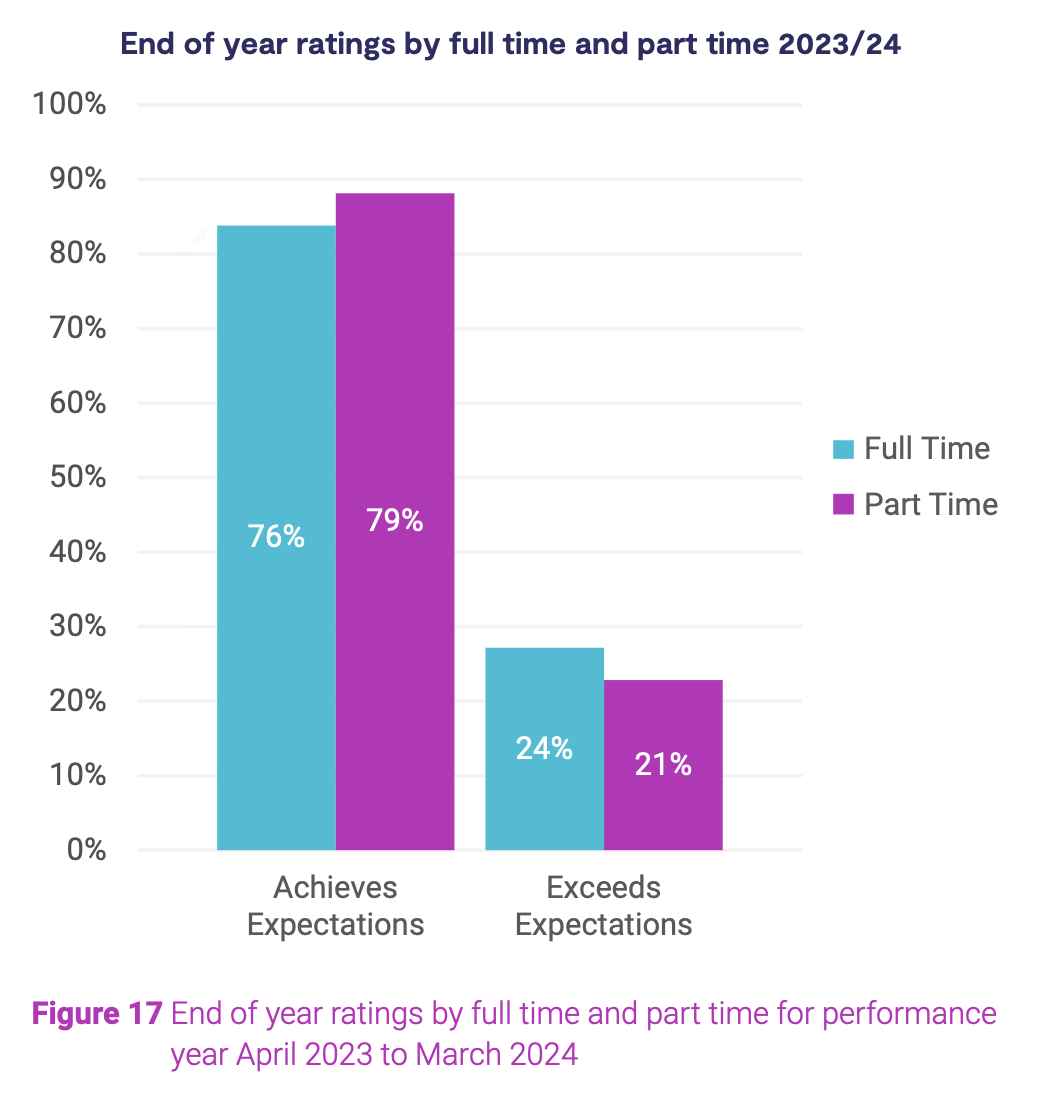
Figure 17: End of year ratings by full time and part time for performance year April 2023 to March 2024
Figure 18 shows the distribution of end of year ratings by ethnicity. It shows that the proportion of minority ethnic employees receiving and “exceeds expectations” is just over one percentage point less than that of White -British employees.
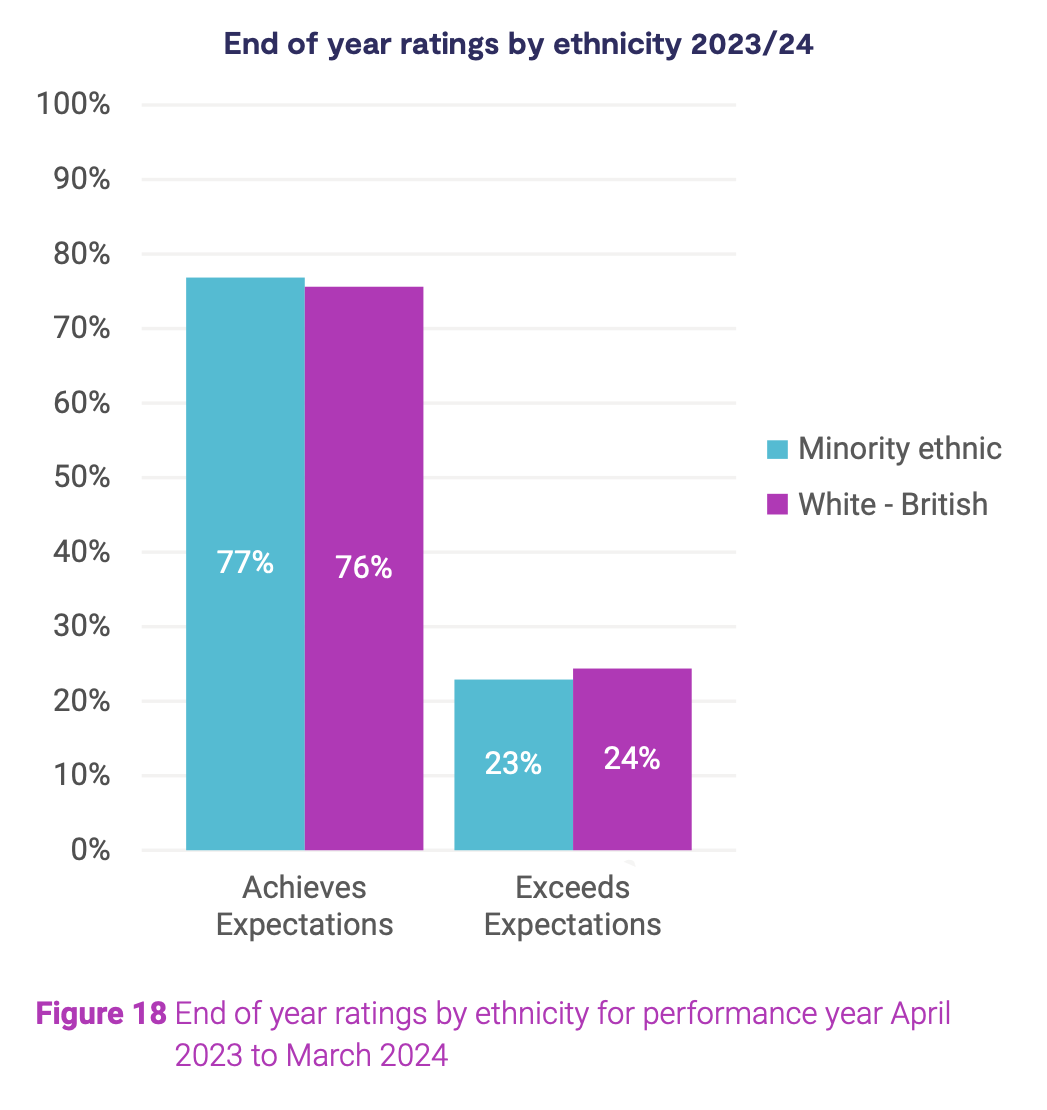
Figure 18: End of year ratings by ethnicity for performance year April 2023 to March 2024
Conclusions
We are assured by the findings of this audit that within pay bands of each pay scale, pay differentials are minimal, and that there is no significant difference in pay for equal work as defined by the EHRC as a difference of greater than 5%.
UKRI has robust pay policies with effective controls and good governance. We are committed to fair and transparent pay decisions which support UKRI’s commitment to creating the conditions in which our staff can thrive and we will continue to monitor pay benchmarking and recruitment and retention issues, which underpinned the introduction of differentials in pay scales for differing role categories.
The distribution of males and females contributes to UKRI’s GPG, and through our wider equality, diversity and inclusion work, we will continue to take action to identify and remove barriers to employment and progression at all levels based on sex.
It is reassuring that the inconsistency in end of year ratings for part-time and full-time employees which was discovered in the 2022 EPA has been reduced to only a three percentage points, however we will continue to monitor progress in this area.
We will continue to work on improving our data on protected characteristics such as ethnicity and disability. Currently, our data on these characteristics is far from complete and this impedes our ability to draw meaningful conclusions. Improving this data, by exploring and addressing the reasons for under-reporting, will enable us to interrogate data intersectionality and give further insights into our workforce profile and pay landscape.
We hope that the audit will provide reassurance to staff that UKRI’s pay is fair and equitable. This exercise, of course, is an audit, not a comprehensive view of the pay of each individual employee. Therefore, the conclusions reached are based on comparisons by band and should not be read as concluding that there are no potential equal pay issues within UKRI.
How we're addressing pay disparity
UKRI is committed to creating an inclusive culture that supports a diversity of people, ideas and skills, where people can flourish and achieve their full potential. We continue to deliver on the priorities set out in our workforce EDI plan. Progress against our priorities is shared in our annual workforce equality monitoring report.
Building a culture of dignity, respect and inclusion
We are making progress towards building a culture of dignity, respect and inclusion. In July 2024, we published our action plan for tackling bullying, harassment and discrimination which embodies our commitment to addressing systemic causes, ensuring a workplace where everyone feels safe, respected, valued and empowered in their work. Through this programme and our broader initiatives on employee experience, we are creating an environment where diverse perspectives, skills and experiences are valued and contribute to a successful research and innovation system.
Inclusive recruitment
We are taking action to ensure that we have inclusive and equitable recruitment and selection processes that attract diverse talent. A priority action has been analysing our recruitment data to identify any existing biases or disparities in outcomes. Following this, we will review our entire recruitment and selection process, at all levels, to eliminate any biases and ensure our practices are fair and inclusive for all.
Developing leaders
We have embedded inclusive leadership behaviours into our development programmes, equipping our leaders with the skills and awareness to create an environment where everyone feels and is heard, valued and respected.
Supporting diverse talent
Research and Innovation success is underpinned by our ability to attract, develop and invest in a diversity of people, ideas and skills. In 2024, working with the 10,000 Interns Foundation, we welcomed 23 black and disabled interns offering them an insight into careers in research and innovation. The programme supports our pipeline of early career colleagues who bring unique ideas and skills to UKRI, and four of the 2024 cohort secured fixed term or permanent roles at UKRI. In 2025, we will be welcoming another 17 interns to UKRI.
We have also utilised analytics to target a broad range of universities to support attraction of a diverse range of graduates into our early career schemes and are continuing to use an augmented writing tool to shape our jobs adverts in an inclusive way.
In the coming year, we will continue to embed equality diversity and inclusion across our Talent Attraction Framework, Career Frameworks and strategic workforce planning to support our objective of attracting and retaining a diverse workforce. We will also build a robust evidence base to develop and implement effective programmes for diverse talent. This will enable us to tailor our talent and development initiatives to target the needs of all groups in UKRI.
Next steps
Our next steps are to:
- continue to monitor our data, specifically where equal pay differences are above 3%, as part of our annual pay award strategy and ensure no adverse impact on sex
- conduct a detailed analysis of the pay differences within band H S2. This will include reviewing the current salary distribution, identifying any patterns of inequality, and understanding the root causes of these disparities. Factors to consider include skills and experience on recruitment, job responsibilities, and qualifications
- take steps to improve our declaration rates for other characteristics to enable us to interrogate any pay differences using robust data and configure future system requirements to enable more categories to be recorded
- continue to review the output from performance assessments to ensure they are fair and equitable