
Summary
UKRI publishes annual diversity data on the funding profile of applicants and awardees to aid transparency in our funding and enable high-level monitoring of trends. This report provides data for the 2020 to 2021 financial year and adds to our previous publications describing diversity data and detailed ethnicity analysis for the 2019 to 2020 financial year.
The report primarily presents a high-level annual overview of our diversity data at UKRI level.
Interpreting our diversity data is complex, however, as it is based upon thousands of applications to hundreds of funding opportunities administered by 7 different research councils. Annual changes in the types of opportunity launched, or external factors such as the COVID-19 pandemic, impact upon our data and the interpretation of trends over time.
Where possible, data for individual research councils is provided in accompanying data tables. Figures from analysis at council level, funding stream level or funding opportunity level are also discussed where they can inform our understanding of UKRI-level trends. Building this more detailed understanding is vital to support priority 6.2 (make UKRI an efficient, effective and agile organisation) of our 5-year strategy, published in March 2022, focused on strengthening our insights and analyses, to inform how we act.
Key findings
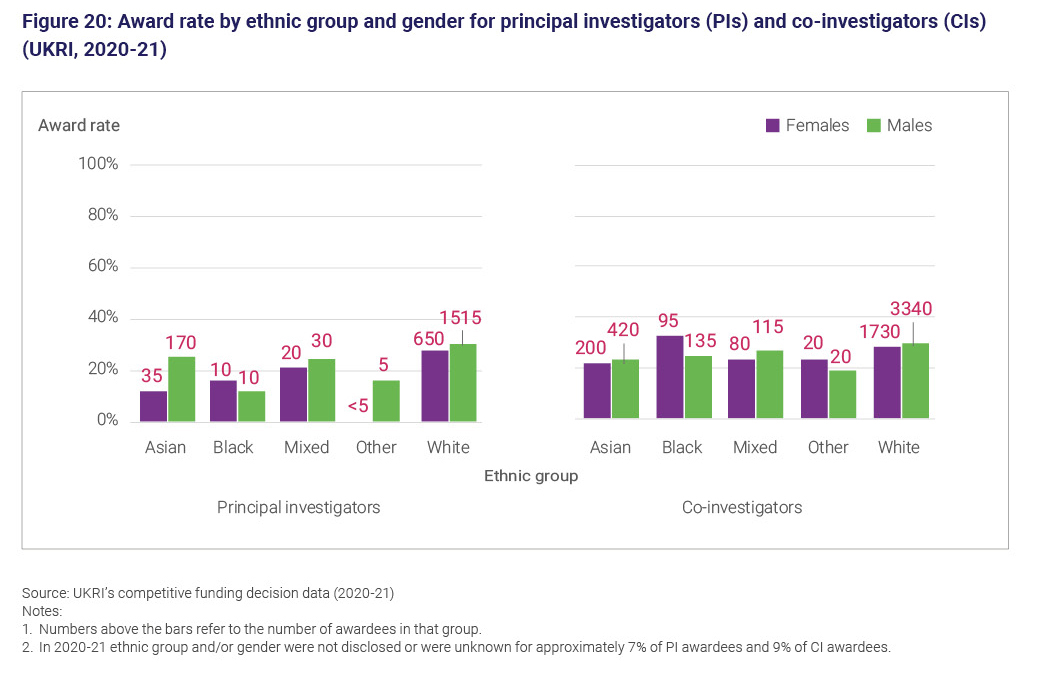
1. For the first time, data on the intersection of age, ethnicity and disability with gender is included. Breakdowns by gender and ethnicity show that White males received the largest percentage of awards as both principal investigators and co-investigators (co-investigators), receiving 57% of principal investigator awards and 49% of co-investigator awards.
2. Representation of female grant holders overall was 28% for principal investigators and 33% for co-investigators. For both role types, this is below a benchmark for the wider academic population, at 42% (for more information see the ‘benchmarks’ heading). Representation of female grant holders was above this benchmark for fellows, at 49%.
3. After the White ethnic group at 81%, the highest percentage of principal investigator awardees was from the Asian ethnic group, at 8%. The percentage of principal investigator grant holders from the Black, Mixed, and other ethnic groups was lower, at 1%, 2% and less than 0.5% respectively.
4. The award rate for principal investigators was lowest for the Black and other ethnic groups at 13% and 12% respectively. This compares with award rates of 29% for the White ethnic group, 23% for the Mixed ethnic group and 21% for the Asian ethnic group
5. The percentage of principal investigator and co-investigator grant holders reporting a known disability remains low at 2%. This is below benchmarks for wider academic staff at 4%, and the wider labour market (employed) population at 13%.
6. Disability status was not disclosed for 6% of principal investigator grant holders and 6% of co-investigator grant holders. Ethnicity was not disclosed for 8% of principal investigator awardees and 9% of co-investigator grant holders. Further investigation is needed to understand why there are higher levels of non-disclosure for disability and ethnicity than for the other legally protected characteristics, and the impact this has on our data.
7. Among UKRI’s funded postgraduate research students, representation of female students and students reporting a disability is below benchmarks for the wider postgraduate research student population. 45% of UKRI studentship starts were female compared with a benchmark of 50%, and 8% reported a disability, compared with a benchmark of 12%. A high level of ‘non-disclosure’ or ‘unknown’ for ethnicity remains for UKRI-funded studentship starts, at 32%.
Benchmarks
Benchmarks for the wider academic population are constructed from Higher Education Statistics Agency (HESA) data and include academic staff on a contract that includes ‘both teaching and research’. Both fixed-term and permanent contracts are included, as are full-time and part-time work patterns.
Contracts that are ‘research only’, ‘atypical’ or ‘dormant’ are excluded. Differences in time periods, geographic coverage and inclusion criteria mean that the HESA population is not directly comparable with the people funded by UKRI.
Figures are provided as an approximate benchmark to help with interpreting the data. Difference from the benchmark can be attributed to:
- differing funding levels across the councils
- the fact that not all those funded are UK based, (making the HESA benchmark less relevant)
- the fact that there may be success rate differences associated with gender
Benchmarks for wider postgraduate research students are also constructed from HESA data and include doctoral students and research-based masters students. Differences in time periods, geographic coverage and inclusion criteria mean that the HESA population is not directly comparable with who UKRI funds. Figures are provided as an approximate benchmark to help with interpreting the data.
Introduction
We are committed to publishing diversity data on applications and awards against 4 diversity characteristics (age, disability, ethnicity and gender) annually, as part of our business-as-usual activities.
We are reviewing our data collection processes through development of the new funding service. Within this, we will review how data is collected on these 4 characteristics and will also widen data collection to include other protected characteristics.
The current funding services asks applicants to provide information on gender with male, female or not disclosed as response options. For this reason, we use the terminology male and female to describe gender categories throughout this document. We appreciate that gender and sex terminology are more nuanced and highly personal and will reflect this through data collection in the new funding system.
The data is broken down by role type, principal investigators, co-investigators, fellows, and studentship starts, and the data included covers 7 financial years (2014 to 2015 to 2020 to 2021). Discussion within this report is primarily focused on data for the latest financial year. Developing the capability to explore trends over time is an important next step in improving our analysis.
We publish this data to aid transparency in our funding and enable high-level monitoring of trends.
For 2020 to 2021, the data continues to reveal under-representation of females, ethnic minority groups and individuals with a declared disability when compared to the benchmark for the UK academic community and the UK workforce.
We are using this data, together with other evidence, and engagement with the research and innovation community, to support priority 6.2 of our 5-year strategy published in March 2022. This aims to strengthen our insights and analyses to inform how we act, drawing on the breadth and depth of our expertise to respond to the rapidly changing research and innovation landscape.
The 2020 to 2021 financial year was unprecedented, with the impact of the COVID-19 pandemic, and so in many ways was an atypical year for funding applications.
Our independent process review of UKRI’s response to COVID-19 revealed that we received a substantially larger volume of applications at a much faster pace than normal, with COVID-19 response applications adding around 30% to our typical annual application volume.
Success rates were also impacted, with a success rate of just over 10% for the main COVID-19 response funding opportunities, compared with an overall award rate for UKRI of 21% (although this varies substantially by opportunity and award type).
Emergency funding opportunities, set up as part of our response to COVID-19 are not included within the data in this report (COVID rapid response funding is not included. There are 3 COVID funding opportunities included in the data: MS COVID SPF 2020; SPF COVID19 Rapid Knowledge; UKRI GCRF urgency COVID funding). Separate analysis of the diversity profile for these funding opportunities is included in Annex D of the independent process review.
Early analysis of data for UKRI does not indicate substantial changes in the diversity profile of applicants and awardees because of the pandemic. However, further work including the monitoring of trends in future years, will enable us to understand the impact of the COVID-19 pandemic on funding applicants and awardees more fully.
An impact evaluation for our COVID-19 response is ongoing and will explore to what extent (and how) projects have fostered equal, diverse, and inclusive research and innovation environments.
What is included
This report is based upon competitive UKRI funding to named individuals from across the 7 research councils and pan-UKRI funds, which are centrally run schemes.
This does not reflect all of UKRI’s budget. For example, it does not include strategic funding (such as block grants to institutes), or funding from Research England and Innovate UK. The majority of Innovate UK and Research England funding goes to organisations and therefore all Innovate UK and Research England funding is excluded from this report.
Innovate UK will be publishing a report on the diversity of Innovate UK competition applicants and recipients early in 2023. In addition, a new equality, diversity and inclusion survey was introduced for applicants in May 2022 and data from this survey will be published annually.
Results are included against 4 characteristics (age, disability, ethnicity, and gender) for each of the 7 research councils, Arts and Humanities Research Council (AHRC), Biotechnology and Biological Sciences Research Council (BBSRC), Engineering and Physical Sciences Research Council (EPSRC), Economic and Social Research Council (ESRC), Medical Research Council (MRC), Natural Environment Research Council (NERC), Science and Technology Facilities Council (STFC), for pan-UKRI funds, and for UKRI as a whole.
Data is available for the 7-year period from 2014 to 2015 to 2020 to 2021. Results for UKRI’s research grants and fellowships are broken down by role type, principal investigators, co-investigators and fellows, and data is included separately for council-funded studentship starts.
For more detail on the methodology, see the methodology annex.
This year, we have made a few changes to improve the content of the report.
We have disaggregated ethnicity and included intersectionality for the first time. In the next report we will develop estimates of expected variation over time and develop methods to assess statistical significance.
External benchmark data is used to provide context and comparison to our diversity data. We use it to understand how the diversity of our applicants and awardees compares to the make-up of those eligible to apply for our funding, and the wider population.
We have used the latest data available from the Higher Education Statistics Agency (HESA) for the diversity population of the UK higher education institutes (HEIs) and the ONS Labour Force Survey, which provides the percentage of people from each ethnic group employed in the UK (see Annex A).
It should be noted that neither benchmark is a perfect comparator. Some UKRI funding opportunities allow for international applicants or researchers outside of UK HEIs, while student benchmarks for the HESA data are for UK-domiciled students only.
Discussion within this report is primarily focused upon data for the latest financial year. Changes over time are only discussed where we can provide additional evidence to support the conclusions.
Developing the capability to explore trends over time is an important next step in improving our analysis.
The following results are included:
- the proportion of applicants and awardees for research grants and fellowships
- award rates (number of awardees as a percentage of the number of applicants) for research grants and fellowships
- mean and median application and award values for successful applicants for research grants and fellowships
- award rate by value (the value of the total amount awarded as a percentage of the total amount applied for) for research grants and fellowships
- the proportion of doctoral studentship starts
- estimates of UK academic staff and postgraduate research student populations for each council, based on HESA data, to understand whether the applicants and awardees reflect underlying populations of staff and students in higher education
Mean and median award amounts are without indexation to enable comparison with application amounts. Results for median award amounts are discussed in this report rather than mean award amounts. This is due to the skewed nature of grant funding with some very large award amounts being awarded. These large awards can affect comparisons between groups when using the mean.
Caution must be used when comparing to HESA staff and student population. Different time periods, geographic coverage and inclusion criteria mean that the populations are not directly comparable with the people funded by UKRI. Figures are provided as an approximate benchmark to help with interpretation of the data.
Data for the cross-UKRI Future Leaders Fellowships (FLF) is included within the totals for fellows under ‘pan-UKRI funds’ in council-level breakdowns but is not separately identified. Separate data for the programme is also provided alongside this report for individual financial years. Results for the FLF programme are not discussed in this narrative, as these are already reported on and discussed separately on a round by round basis.
Intersectionality analysis is also limited to applications, awards, and award rates at this stage. We recognise that further work is needed to understand the intersection between protected characteristics more fully and will continue to develop and improve this analysis in future release.
The impact of council-level differences on UKRI-level data
Where possible, data for individual research councils is provided in accompanying data tables. Insights from analysis at council level, funding stream level or funding opportunity level are also discussed where they can inform our understanding of UKRI-level trends.
There is large variation in application numbers, award rates and award amounts across UKRI’s funding portfolio, including between research councils. These reflect differences in process and reporting methods.
The variation in award value can be due to the higher consumable and equipment costs that are necessary for some areas of research. Councils are looking into their data individually, and this substantial evidence base is directly influencing equality, diversity and inclusion workplans.
The distribution of applicants by number across councils for 2020 to 2021 is:
- AHRC 3,850
- BBSRC 3,585
- EPSRC 7,150
- ESRC 4,625
- MRC 7,845
- NERC 4,410
- STFC 1,170
- pan-UKRI 3,305
MRC has the highest number of applicants compared to the other councils and STFC the fewest.
Within this distribution of applicants there are differences in diversity characteristics and application patterns across the 7 research councils. Figure 1 shows the distribution of UKRI’s applicants across age, disability, ethnicity, and gender by the 7 research councils and pan-UKRI.
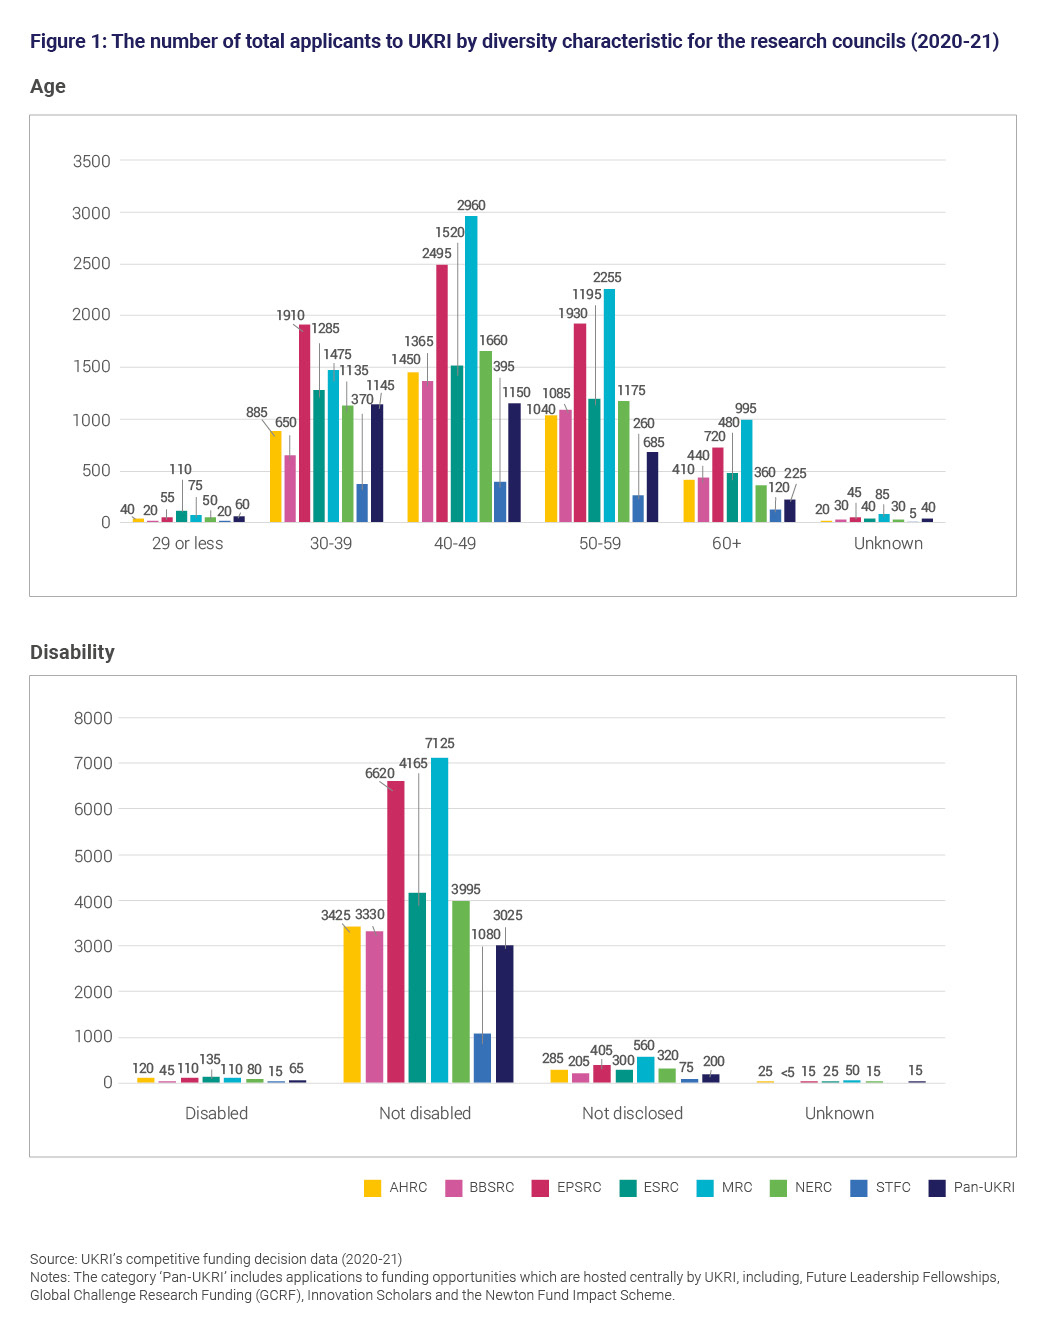
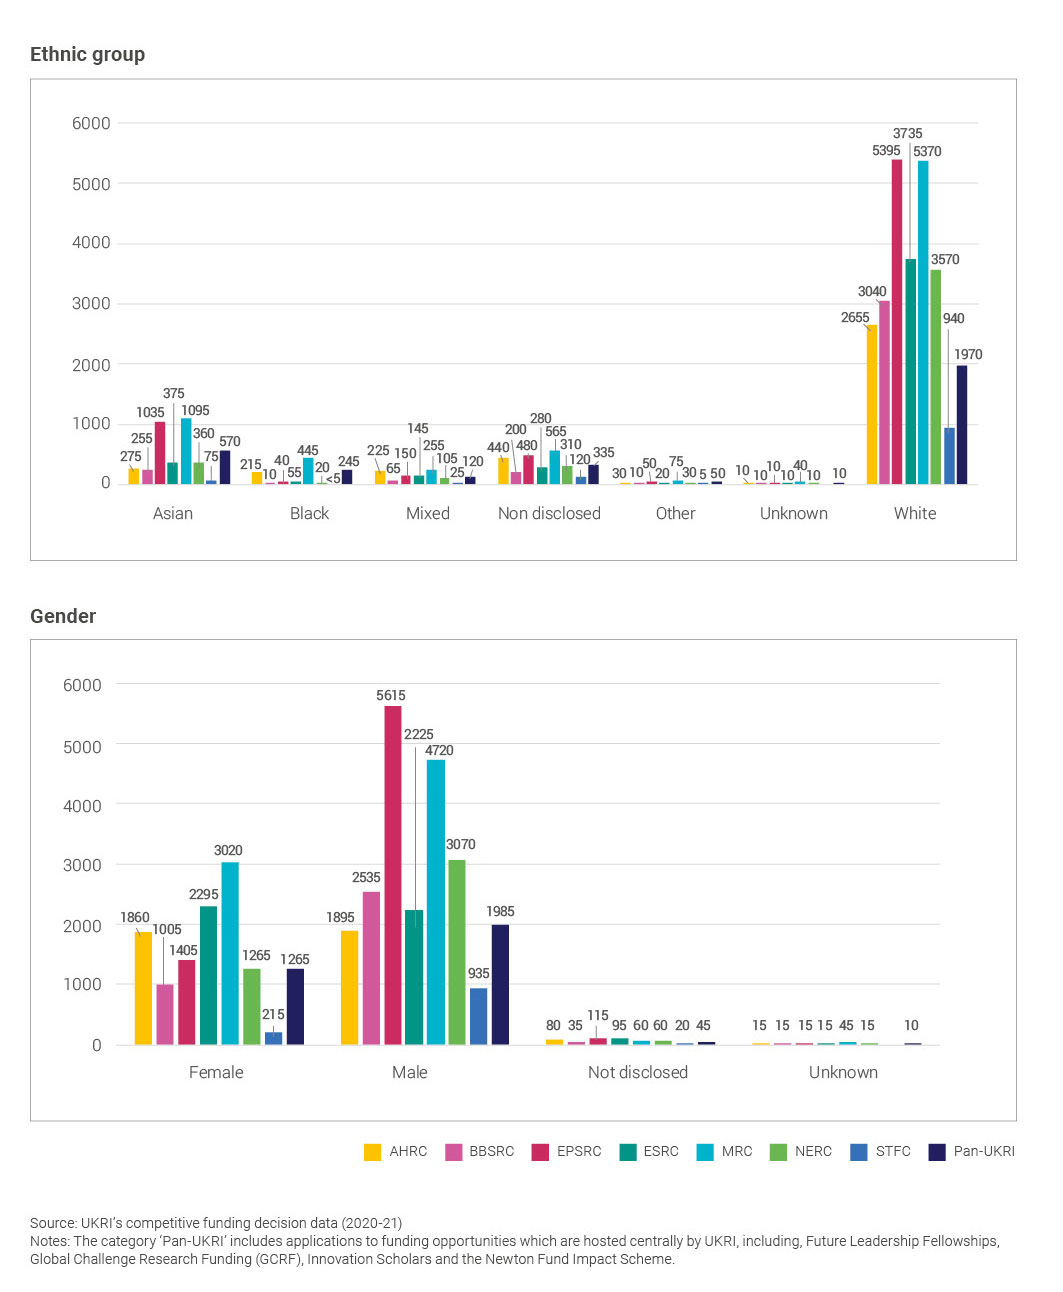
This highlights the fact, for example, that at UKRI level the 40 to 49 age group has the highest proportion of applicants. MRC and EPSRC have a higher number of applicants aged 40 to 49 than the other councils. EPSRC has the highest number of applicants across all age groups, and STFC and pan-UKRI funds have the lowest.
The White ethnic group has the highest number of applicants. STFC and pan-UKRI have the lowest number of applicants in this group, and Asian applicants to EPSRC are higher than both. In terms of gender, AHRC and ESRC have similar numbers of male and female applicants.
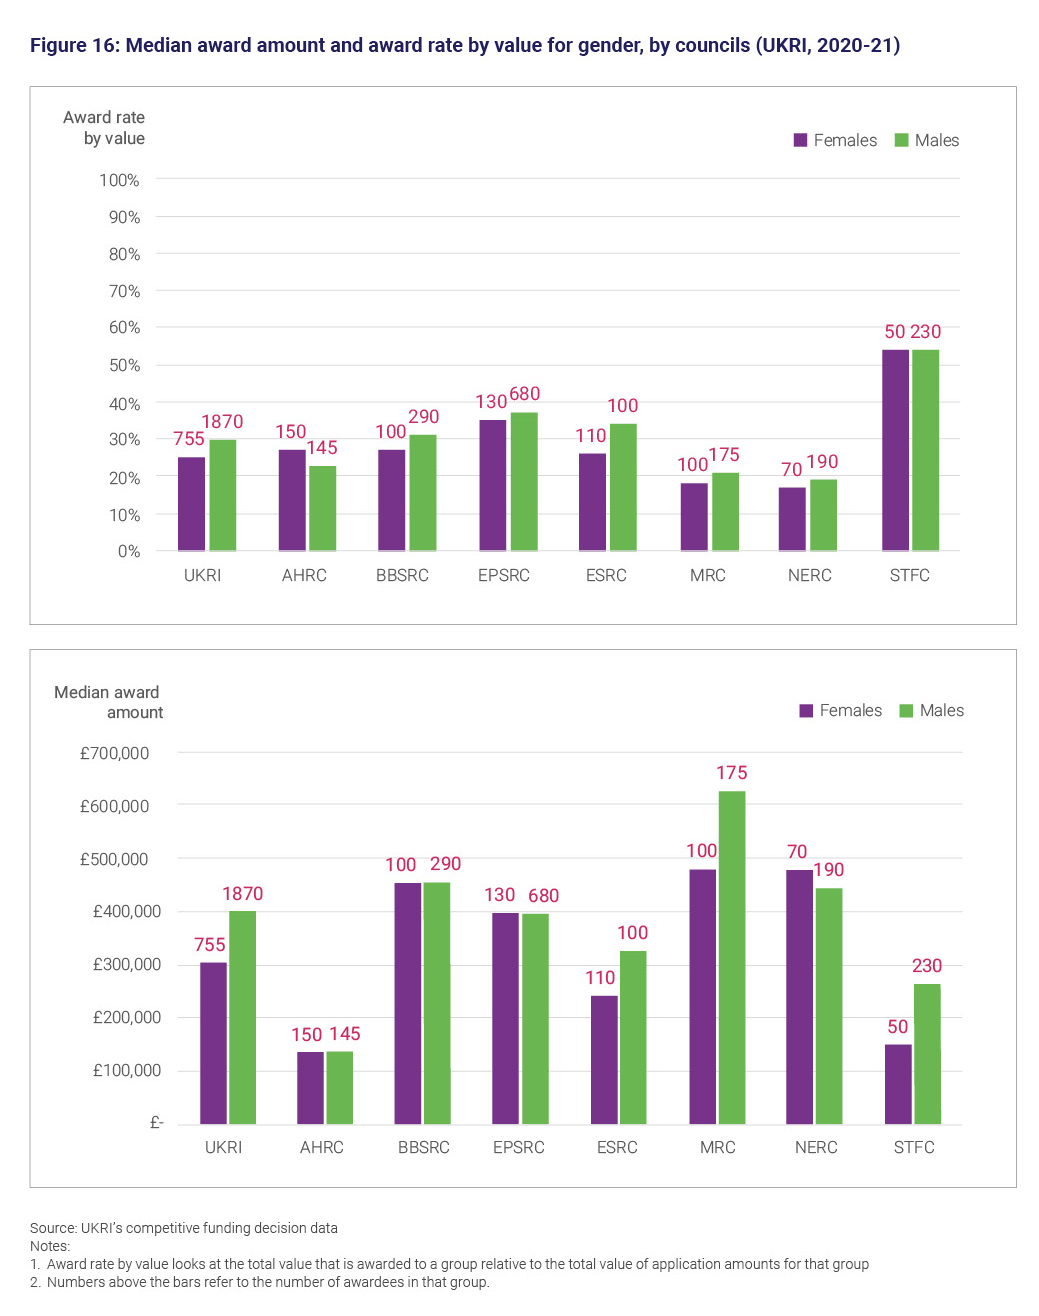
In 2020 to 2021, overall award rates for research and innovation grants ranged from 17% at MRC to 72% at STFC. Similarly, median award amounts for principal investigators ranged from approximately £135,250 at AHRC to approximately £593,536 at MRC.
At UKRI level in 2020 to 2021, the median award amount for male principal investigators was approximately £400,000, compared with approximately £300,000 for female principal investigators. However, the council-level data shows that this difference is not consistent across all the councils.
At AHRC, BBSRC, EPSRC and NERC, differences in median award amount by gender for principal investigators were smaller than at UKRI level (all the differences were less than £40,000).
Differences were larger at ESRC, MRC and STFC, where the median award amount was higher for male principal investigators than for female principal investigators.
At UKRI level, award rates were also higher for principal investigator males in 2020 to 2021 (at 29%), compared with 25% for principal investigator females.
At council level, however, the picture is mixed. Principal investigator award rates by gender were very similar (within 2 percentage points of each other) at all councils except STFC, where principal investigator females had an award rate 9 percentage points higher than males. The higher award rate for males at UKRI level is a consequence of a higher percentage of male applicants and awardees at EPSRC and STFC, which are also the 2 councils with the highest award rates.
It is therefore important to consider council-level data, alongside UKRI-level data, when comparing amounts and award rates between demographic groups.
We advise against using these findings alone to draw causal inferences regarding the relationship between the diversity characteristic and application and award rates. Further analysis is needed to control for the effects of other background factors.
Results
This section discusses key findings for the 7-year period (2014 to 2015 to 2020 to 2021). The data can be explored further using the accompanying Excel downloads and interactive dashboard.
Overall distribution in 2020 to 2021
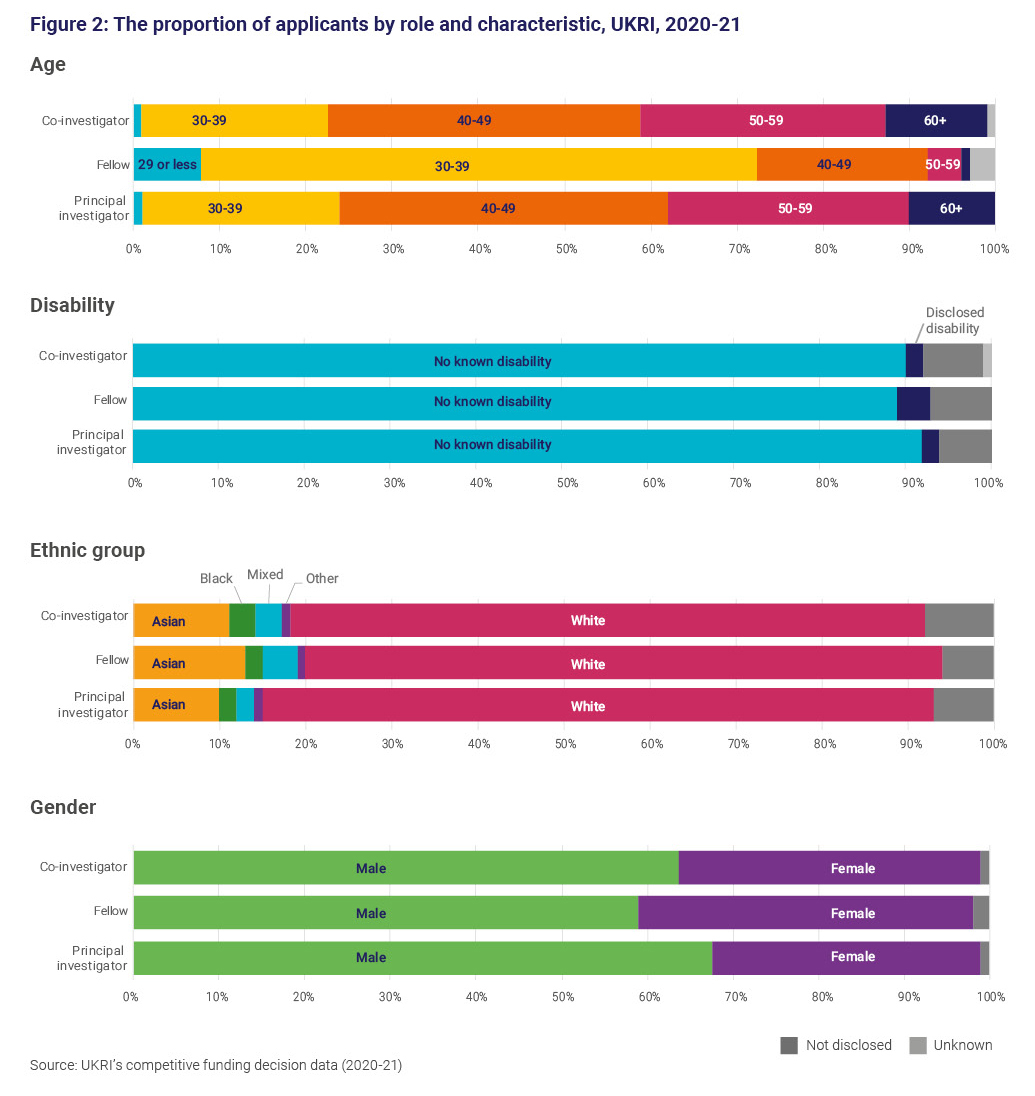
Figure 2 shows the overall composition of UKRI applicants by age, gender, ethnicity, and disability for the three role types – principal investigators, co-investigators and fellows – in 2020 to 2021. Key findings for each characteristic are discussed in more detail below for principal investigators, co-investigators and fellows, and for studentships starts.
Principal investigator and co-investigator
Age
The age distribution of principal investigators and co-investigators has remained relatively stable over the 7-year period. For principal investigators and co-investigators in 2020 to 2021, the 40 to 49 age group continued to account for the largest share of awardees at 38% for principal investigators and 37% for co-investigators.
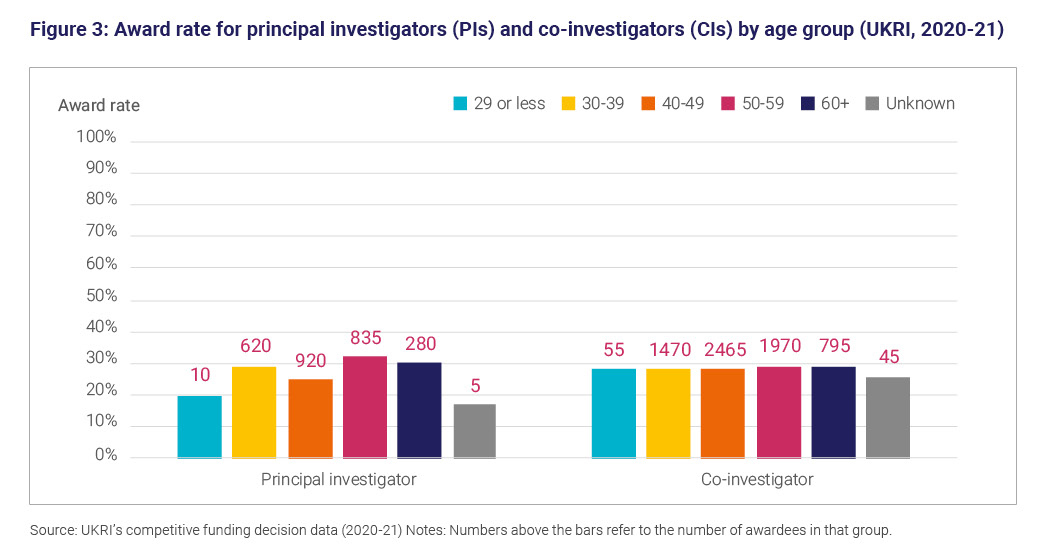
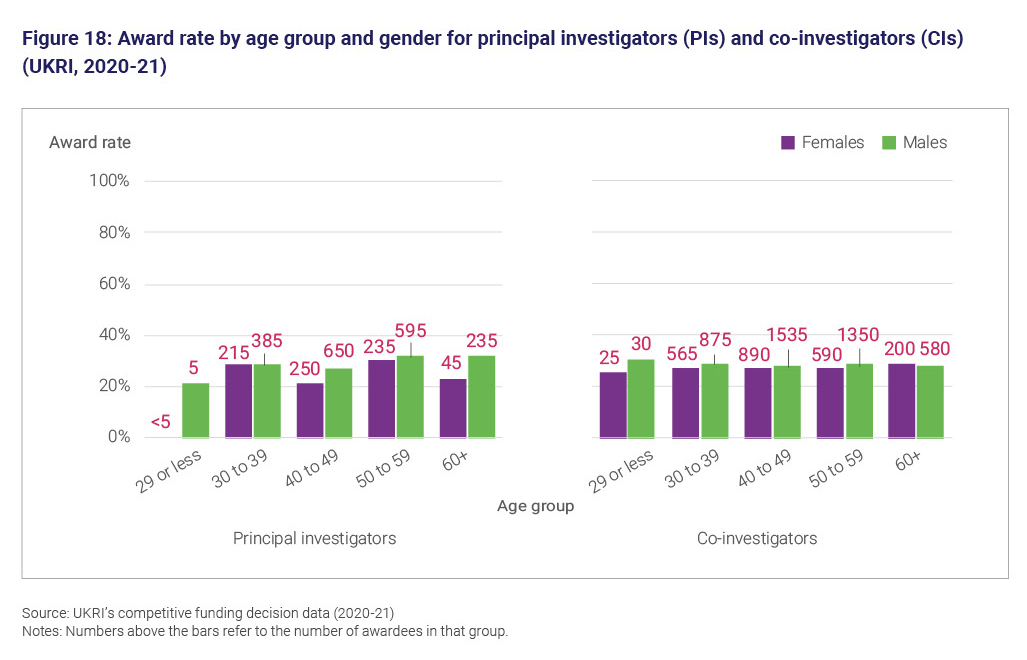
Differences in award rates by age group also remained stable in 2020 to 2021 if we exclude ‘unknown’. For co-investigators, there was little variance in award rate by age, ranging between 28% and 29% for all age groups. For principal investigators, award rates ranged from 20% for those aged 29 or less to 32% for those aged 50 to 59 (Figure 3).
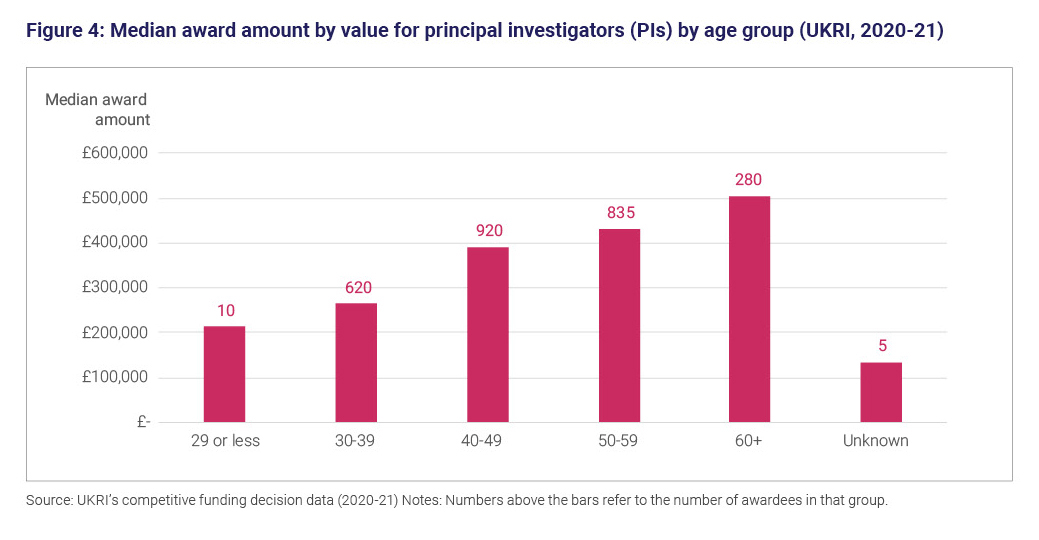
Consistent with previous years, the median award amount for principal investigators in 2020 to 2021 increased with age, with the highest median award amount being for the 60-plus age group (£505,000), and lowest for the 29-or-less age group (£214,000), excluding the ‘unknown’ group. Award rate by value was also highest for the 60-plus age group (at 39%) and lowest for the 29-or-less age group (at 22%).
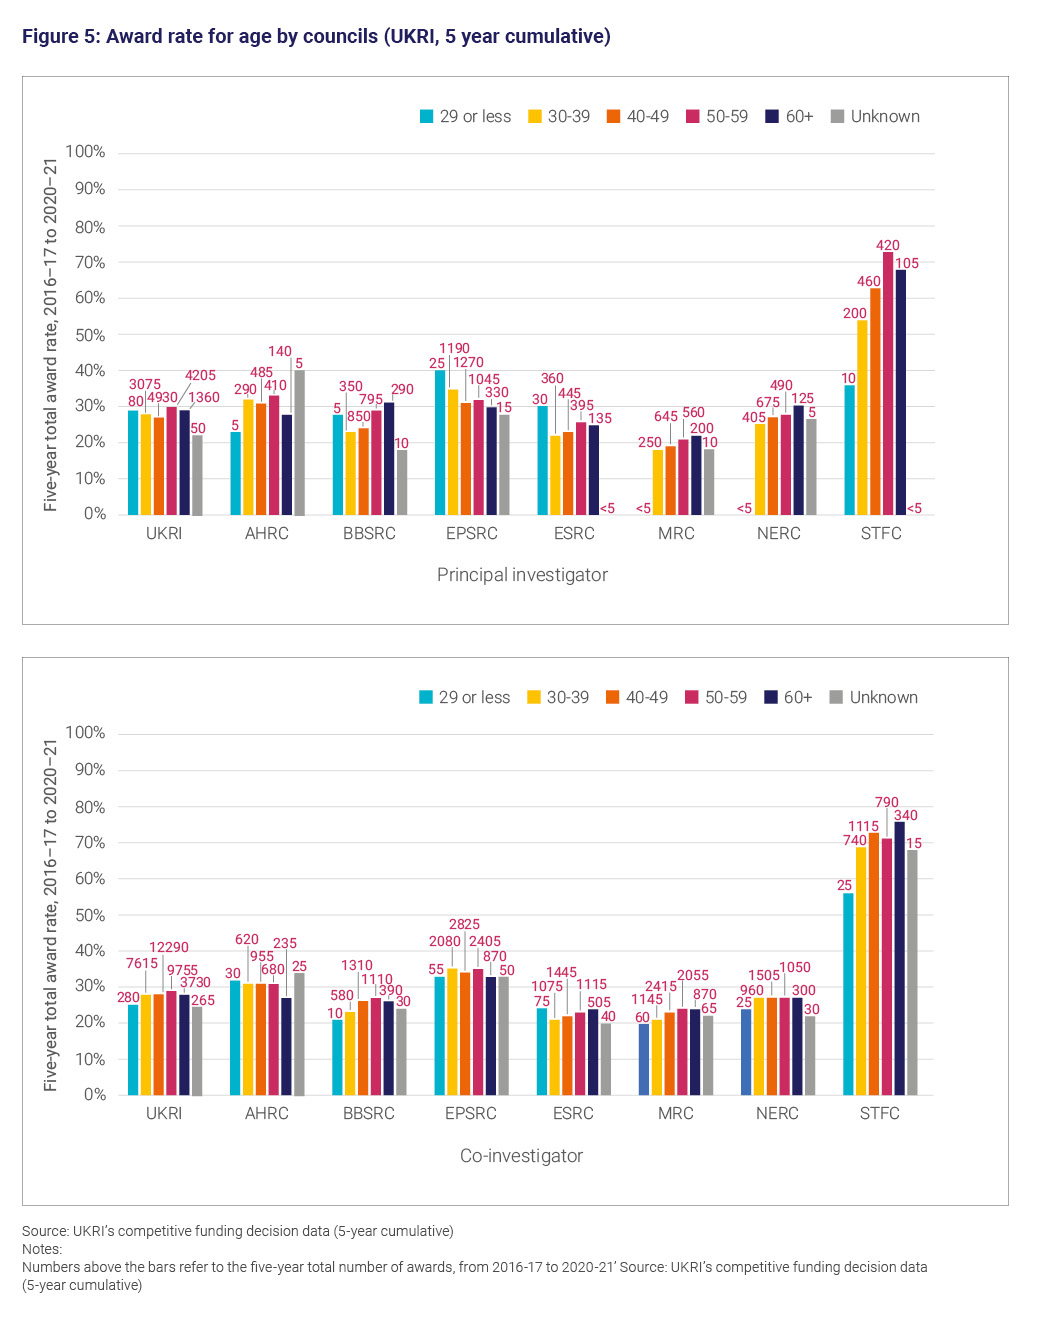
Disaggregating award rates by age across councils is challenging due to small and suppressed values. After rounding, we have used the 5-year cumulative data set.
There is a similar range across councils and age groups. STFC has a higher award rate across all age groups for principal investigators, with the highest being at 73% for the 50 to 59 age group.
Disability
Applications and awards
In 2020 to 2021, the percentage of principal investigator and co-investigator applicants and awardees reporting a disability was 2%. This is consistent with previous years, in which the percentage has fluctuated between 1% and 2%
It is lower than benchmarks both for HESA academic staff (at 5%) and the labour market (employed) population (at 13%). The percentage reporting a disability is also lower for all research councils than their corresponding benchmark for wider academic staff.
The percentage of applicants and awardees where disability status was not disclosed or ‘unknown’ continues to be high in 2020 to 2021 (between 6% and 8%). This is similar to that reported in relation to ethnicity (between 7% and 8%).
It is higher than the level of non-disclosure for age and gender (ranging from 0% to 2%) and for disability in the benchmark HESA data at 3%. Similar levels of non-disclosure or ‘unknown’ data occur at the council level for co-investigators, ranging from 6% at BBSRC, EPSRC and STFC to 9% at AHRC.
Further work is needed to understand both the reasons why applicants may choose not to disclose their disability status, and the nature of the barriers faced by disabled individuals.
Award rates
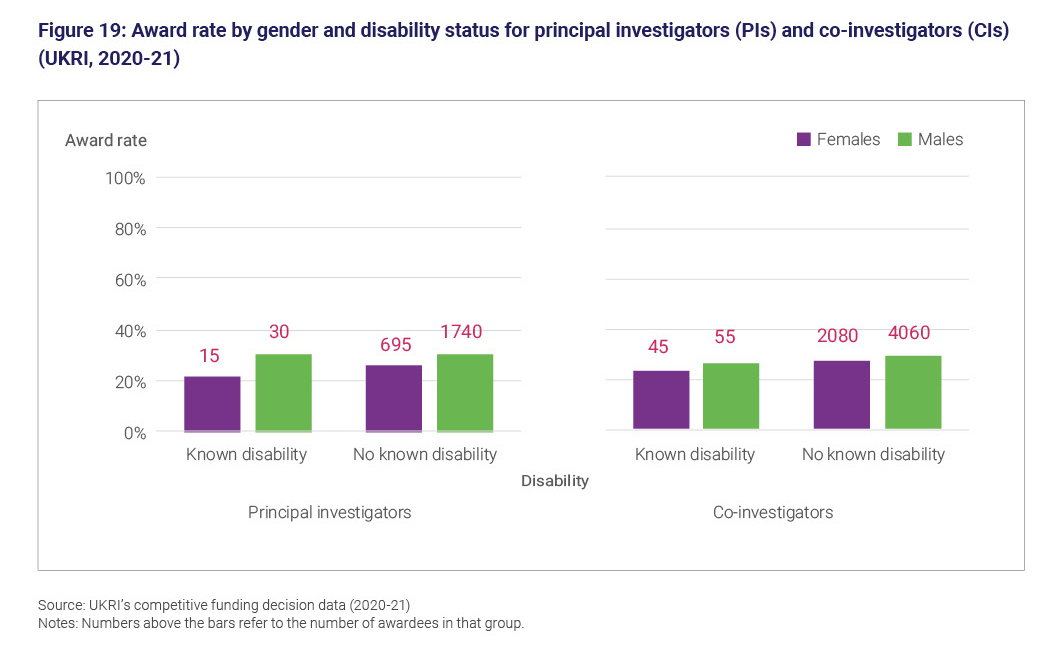
Differences in award rate by disability status remain consistent with previous years with a higher award rate for principal investigators and co-investigators reporting no known disability than individuals reporting a disability. In 2020 to 2021 this difference was 2 percentage points for principal investigators and 3 percentage points for co-investigators.
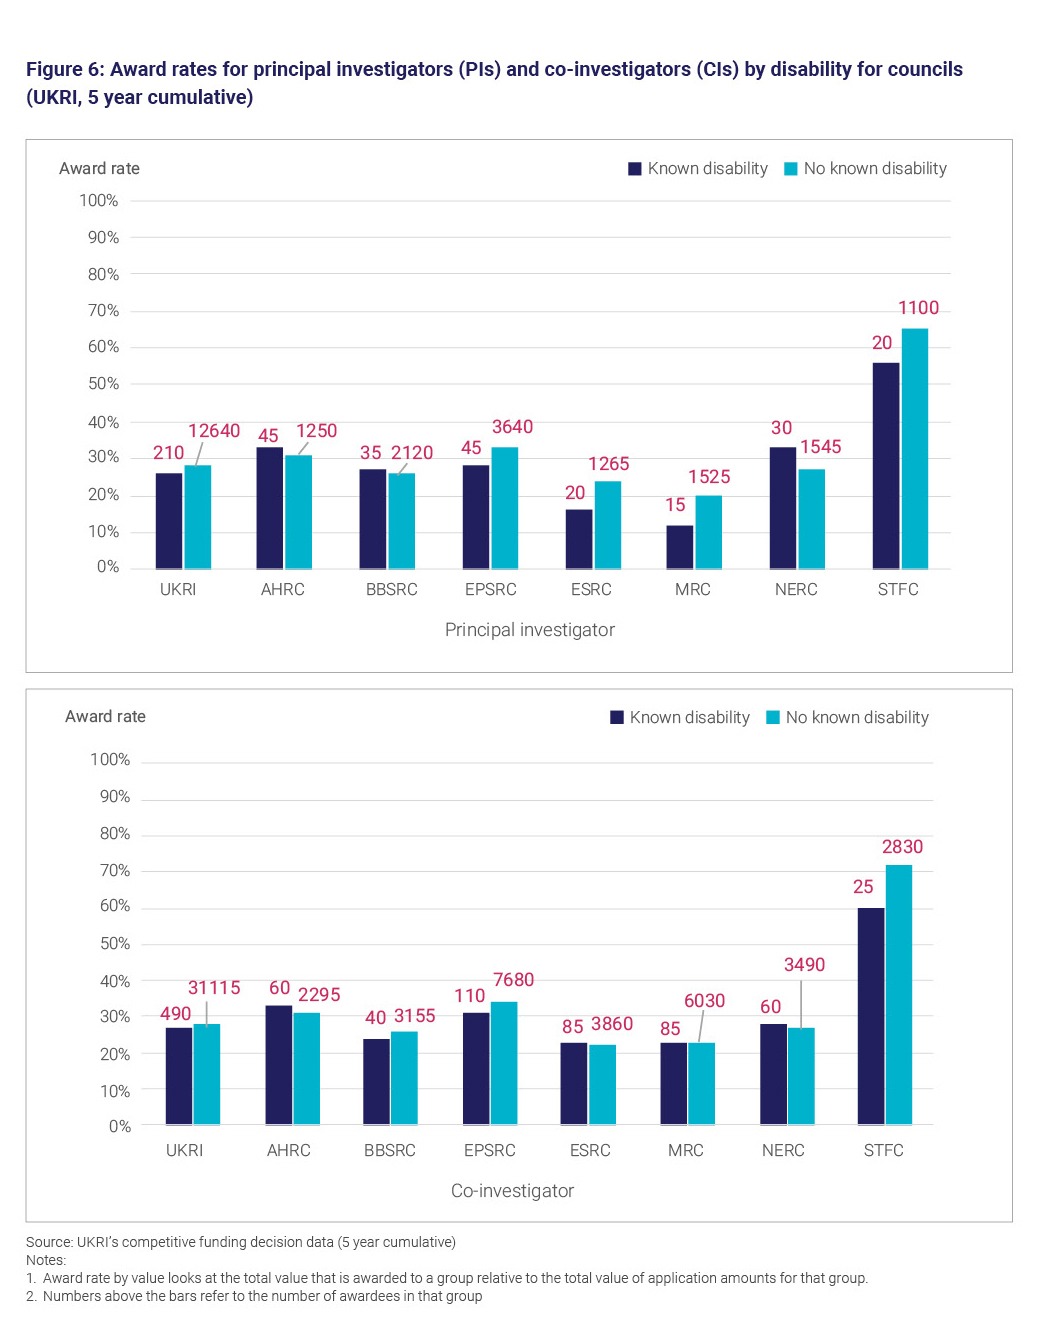
To compare award rates by disability status at research council level we use aggregated data over a 5-year period due to the small number of awardees.
For principal investigators and co-investigators there is a mixed picture across the research councils. For principal investigators, award rates were higher for applicants reporting a disability at AHRC, BBSRC and NERC. For co-investigators, award rates were higher for applicants reporting a disability at AHRC, ESRC and NERC, while they were on a par at MRC.
Award amounts
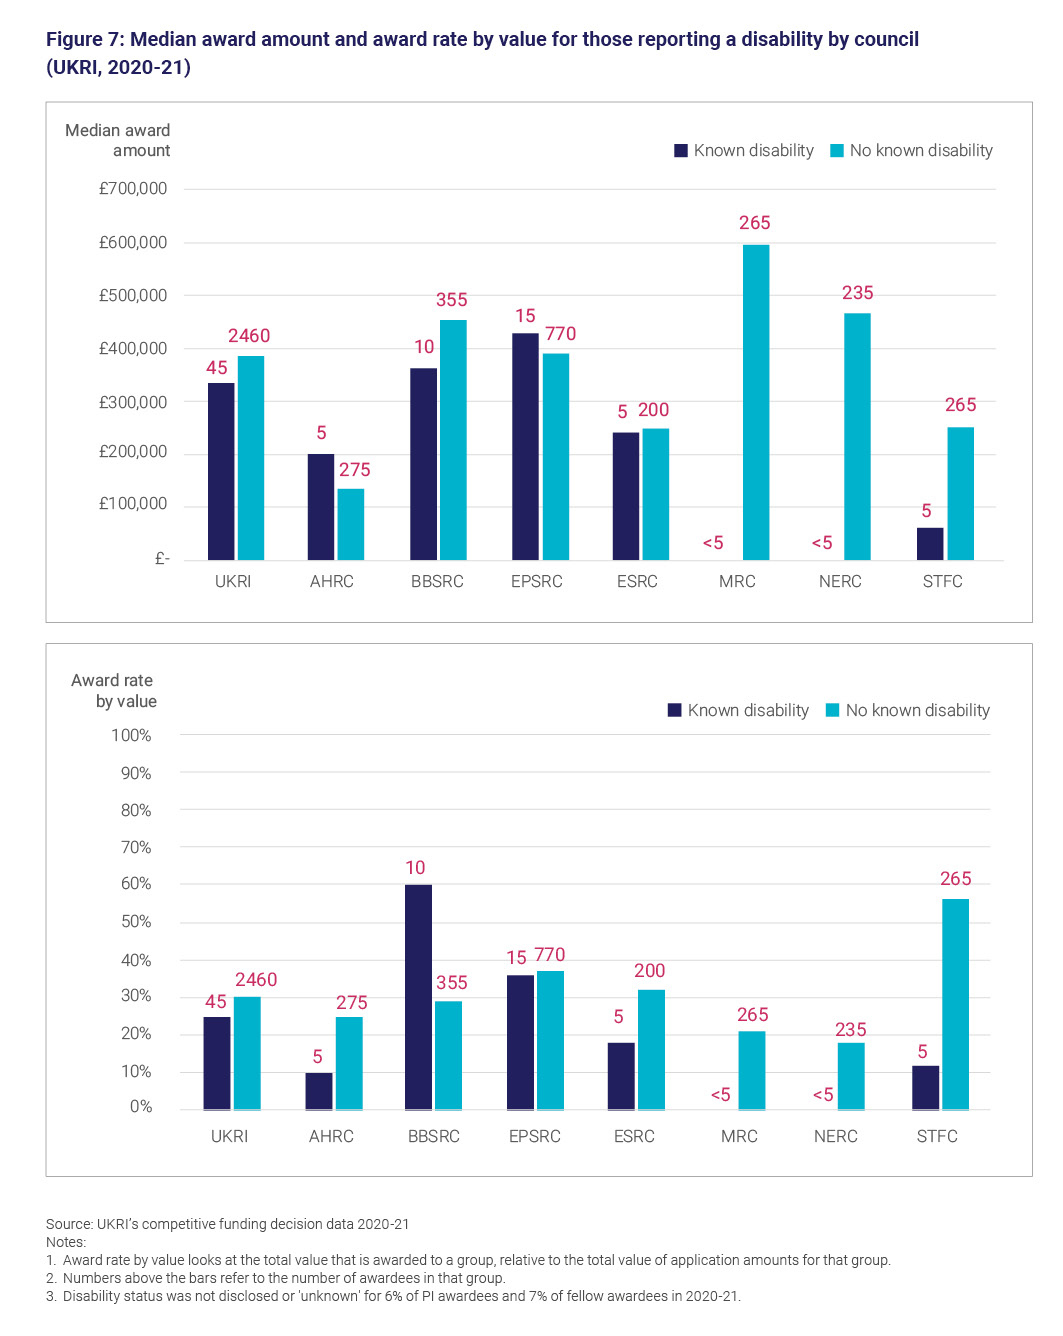
Figure 7 shows that in 2020 to 2021, the median award amount for principal investigators continued to be higher for applicants reporting no known disability than for applicants reporting a disability. This difference is consistent with previous years and is also reflected in the median application amounts for the 2 groups.
Award rate by value for principal investigators was also higher for applicants reporting no known disability at 30% compared with 25% for applicants reporting a disability.
Ethnicity
In this report, we have moved away from using binary ethnicity categories (ethnic minorities and White) and have disaggregated the data by ethnicity as much as possible. Due to the small number of awards at the level of individual ethnicities, data is primarily presented and discussed for the broad ethnic groups (Asian, Black, Mixed, other, and White).
In all years since 2014 to 2015, the highest percentage of principal investigator and co-investigator applicants and awardees were from the White ethnic group (81% of principal investigators and 75% of co-investigators in 2020 to 2021).
After the White ethnic group, the highest percentage of awardees was from the Asian ethnic group for both principal investigators and co-investigators. In 2020 to20 21, 8% of principal investigator awardees and 9% of co-investigator awardees were from the Asian ethnic group.
Representation of the Black, Mixed, and other ethnic groups remains low in 2020 to 2021 among both principal investigators and co-investigators. Representation was particularly low for principal investigators, where the percentage of awardees from the Black ethnic group was 1%, the Mixed ethnic group 2% and the other ethnic group below 0.5% (rounded down to 0%).
This low representation is also reflected in benchmark figures for the wider academic population, at 2% for each of these 3 ethnic groups.
In 2020 to 2021, ethnicity was either not disclosed or unknown for between 7% and 9% of applicants and awardees across the role types. This is higher than for the age and gender characteristics and is consistent with previous years. The HESA benchmark is 3% for not disclosed and 2% for unknown.
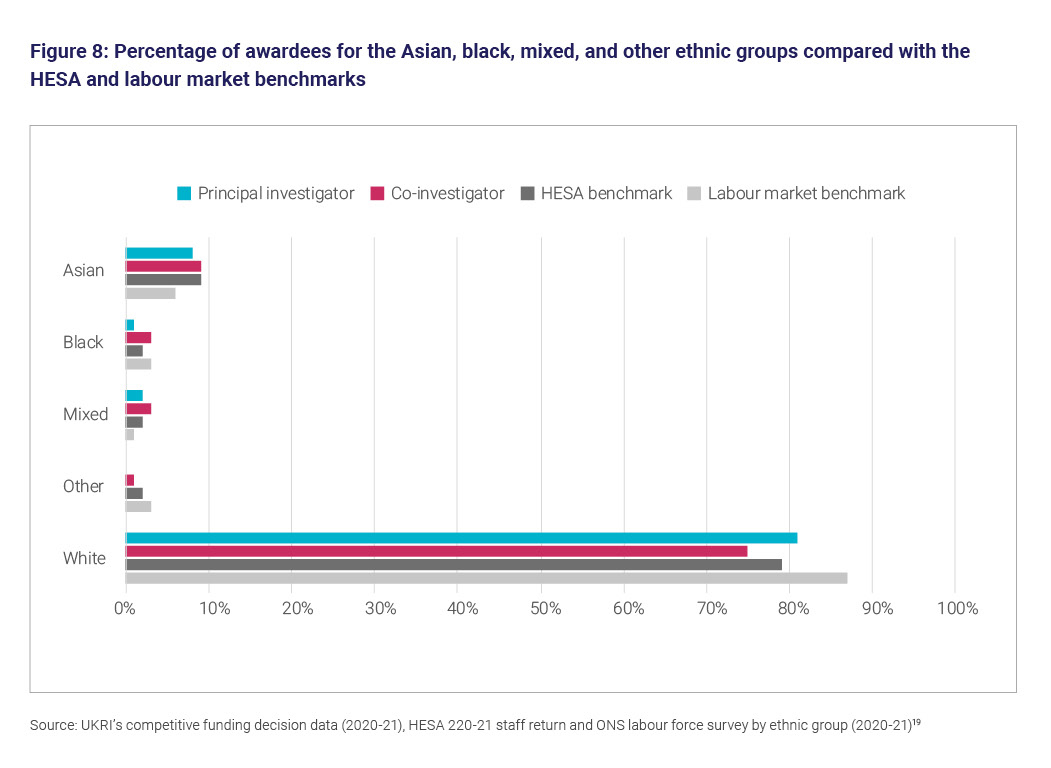
Figure 8 shows that the White ethnic group is the most prevalent for principal investigators (81%) and co-investigators (75%), though this is below the benchmark for the wider labour market (87%) and equivalent to the wider academic population (80%).
The representation of both principal investigators and co-investigators at 3% for the Mixed ethnic group is higher than the wider labour market (1%) and the wider academic population (2%).
The Black ethnic group is the lowest for principal investigators (1%) and co-investigators (3%), below the 3% benchmark for the wider labour market and the wider academic population (2%).
Asian co-investigators (10%) are above the benchmark for the wider academic population, and higher than the 6% of the wider labour market.
Within the ethnic minority groups, trends are consistent with previous years. For principal investigators, Chinese and Indian ethnicities formed the largest share within the Asian ethnic group, while ‘Black-African’ and ‘Mixed-other’ formed the largest shares of the Black and Mixed ethnic groups respectively.
For principal investigators in 2020 to 2021, the percentage of Bangladeshi, Black and Pakistani awardees is below benchmark figures for the academic staff and labour market (employed) populations.
For co-investigators, the same is true for the Bangladeshi ethnicity. For both principal investigators and co-investigators, the percentage of awardees reporting an ‘other’ ethnicity also falls below both benchmarks.
At research council level, only 5-year cumulative figures are presented, due to the small number of awardees.
Over the 5-year period 2016 to 2017 to 2020 to 2021 for principal investigators, the percentage of awardees from the Black ethnic group ranged between less than 0.5% (EPSRC) and 2% (MRC) in every council.
There was greater variation in the percentage of awardees from the Asian ethnic group, ranging from 3% at NERC to 12% at EPSRC.
For co-investigators, the highest percentage of Black awardees were at MRC (6%). As with principal investigators, there was greater variation in the percentage of awardees from the Asian ethnic group. At AHRC 5% of awardees were from the Asian ethnic group compared with 15% at MRC.
There have been some changes in the ethnic composition of applicants and awardees over time. However, we do not currently have estimates of expected annual fluctuation and, as such, it is hard to interpret whether changes are an expected annual variation or represent true change.
Developing measures of expected variation over time, and methods to assess the statistical significance of differences between groups are an important next step for this analysis.
Some of the changes in the representation of ethnic groups over time can be explored further by looking at changes in the programmes that are funded by UKRI each year. For example, Figure 9 shows how the percentage of Asian awardees has changed since 2014 to 2015 for principal investigators and co-investigators, alongside a benchmark for the wider academic population.
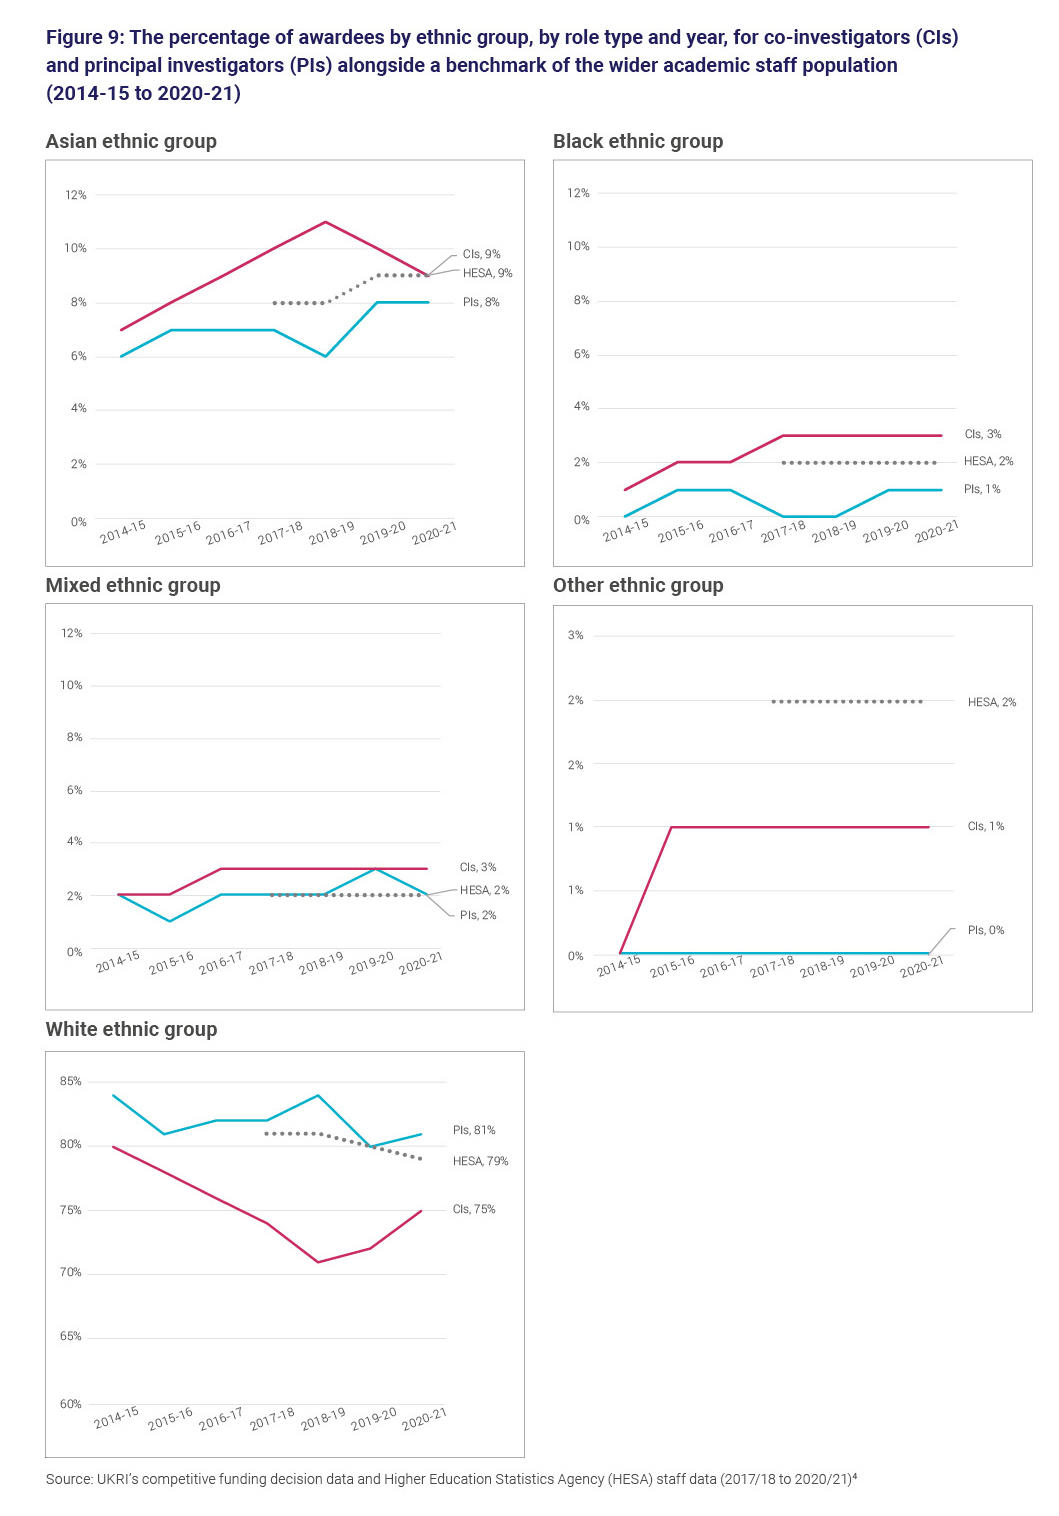
Representation of the Asian, Black and Mixed ethnic groups is higher amongst grants classified as Official Development Assistance (ODA) for both principal investigators and co-investigators, compared with the rest of UKRI’s funding.
For example, in 2018 to 2019, the percentage of ODA co-investigator awardees from the Asian ethnic group was 19%, compared with 8% for the rest of UKRI’s funding.
For the Black and Mixed ethnic groups, representation was also higher for ODA awardees, at 7% and 8% respectively, compared with 1% and 2% for other co-investigator awards.
Some of the changes in the representation of ethnic groups over time (such as those shown in Figure 9) are due to changes in the programmes funded by UKRI. For example, the number of ODA funding opportunities fell from 62 in 2018 to 2019 to 58 in 2019 to 2020, then fell again to 29 in 2020 to 2021.
This has led to a decline in the percentage of principal investigators and co-investigators awarded grants that classify as ODA funding. In 2018 to 2019 28% of co-investigator awardees were for ODA grants: this fell to 16% in 2020 to 2021. For principal investigators, the decline was from 13% of awardees to 7% in 2020 to 2021.
If co-investigators associated with ODA funding are removed from UKRI’s data, the percentage of co-investigator awardees from the Asian ethnic group has been stable at 8% in each of the last 3 years. If principal investigators associated with ODA funding are removed from UKRI’s data, the percentage of principal investigator awardees from the Asian ethnic group was 6% in 2018 to 2019, 8% in 2019 to 2020 and 7% in 2020 to 2021.
The reduction in the number of ODA funding opportunities has not affected the ethnic diversity of applicants and awardees for all councils equally, as some councils have a higher percentage of grants classified as ODA.
AHRC has seen the largest change in the percentage of principal investigators associated with ODA funding, with a peak of 12% in 2019 to 2020, declining to 2% in 2020 to 2021.
In 2020 to 2021 the distribution by ethnic group for ODA-related grants varies by research councils. The percentage of principal investigator awardees for the Asian ethnic group was between 3% (at AHRC) and 18% (at MRC). The Mixed ethnic group ranges from 2% at pan-UKRI to 17% at NERC.
Award rates
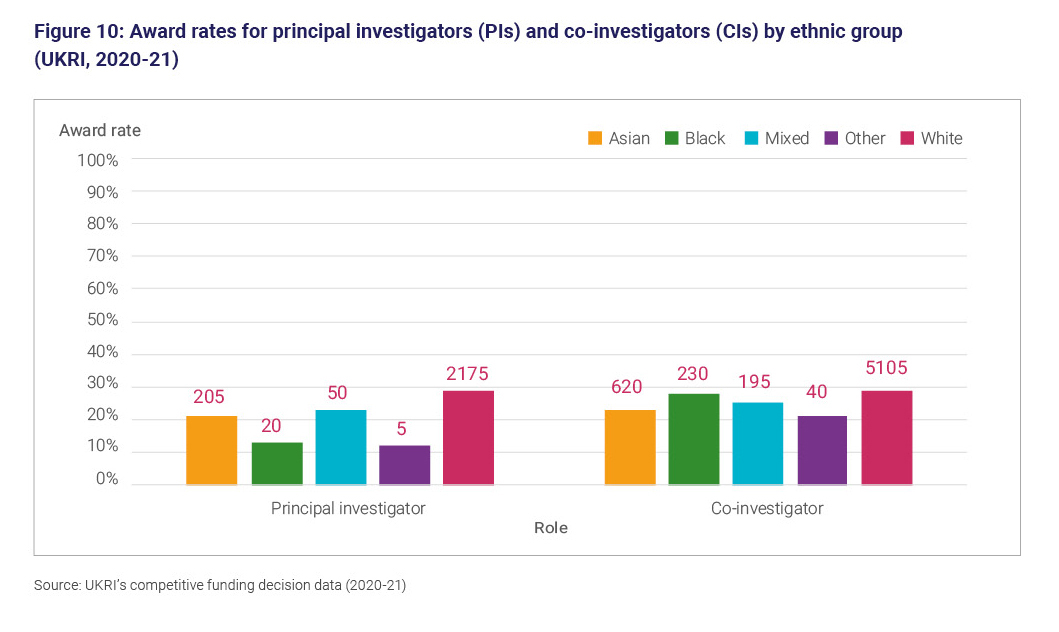
When looking at award rates by ethnic group for principal investigators, the White ethnic group had the highest award rate in 2020 to 2021 (at 29%), followed by the Mixed ethnic group at 23% and the Asian ethnic group at 21%.
Award rates were lowest for the Black and other ethnic groups at 13% and 12% respectively. Differences in award rate by ethnic group were smaller for co-investigators, where the award rate was highest for the White and Black ethnic groups (at 29% and 28% respectively) and lowest for the other ethnic group at 21%.
To explore award rates by ethnic group at the council level, we use aggregated figures over a 5-year period (2016 to 2017 to 2020 to 2021). This is due to the small number of awardees for some ethnic groups at this level of disaggregation.
Council-level data reveals large variation in trends. For example, MRC award rates ranged from 24% for the White ethnic group to 21% for the Asian ethnic group.
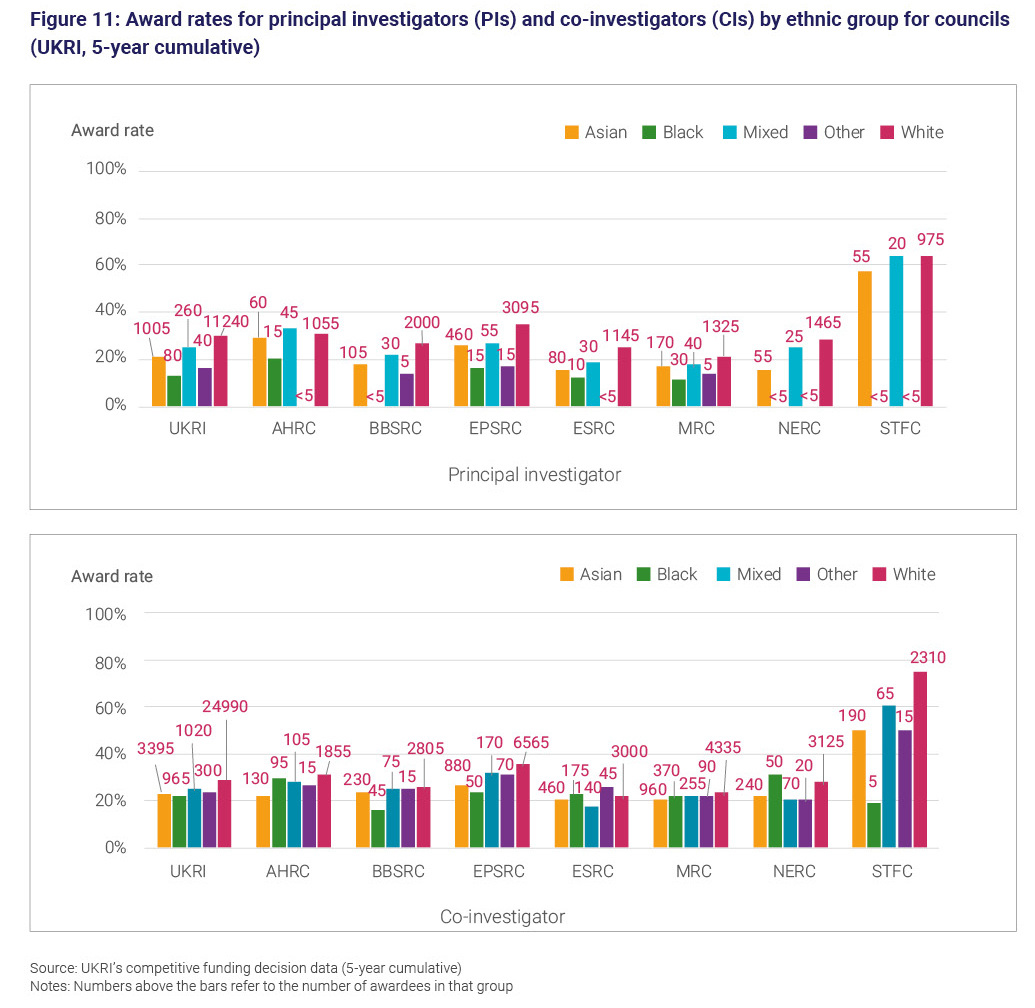
For principal investigators, there are suppressed values after rounding for Black and other ethnic groups in AHRC, BBSRC, ESRC, NERC and STFC. Award rates were highest for White ethnic group. For co-investigators, award rates were higher for White ethnic group, with award rates ranging from 16% Black ethnic group at BBSRC to 61% Mixed ethnic group at STFC.
Award amounts
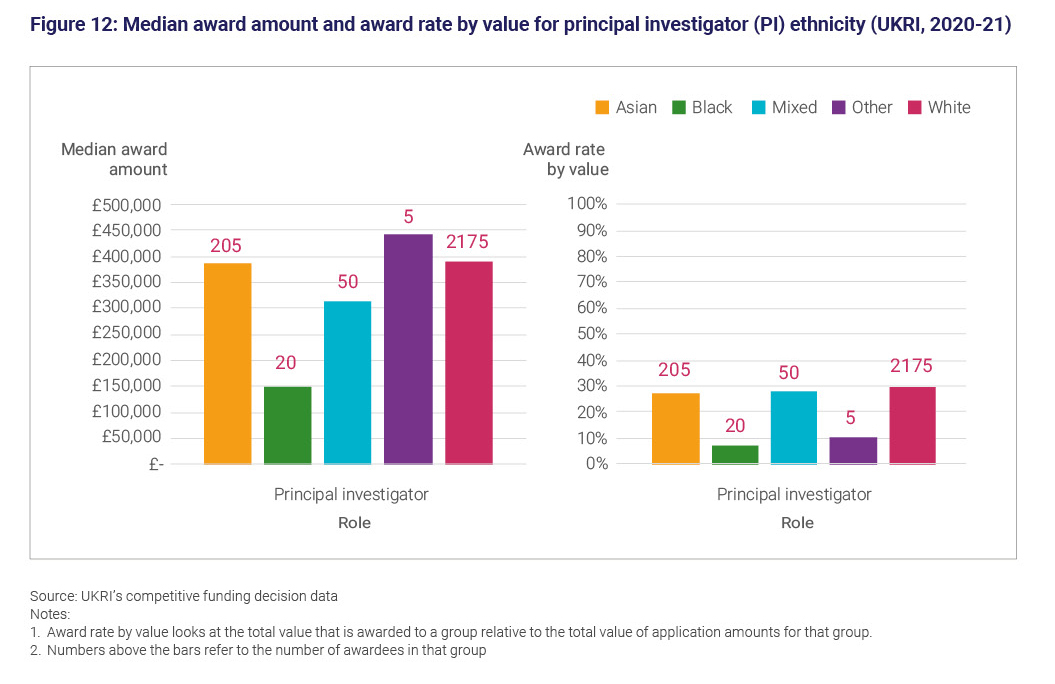
Due to the small number of awardees, award amounts are compared between the White ethnic group and ethnic minorities (excluding White minorities).
Consistent with previous years, principal investigators from White ethnicities continued to apply for and receive higher award values relative to ethnic minority (excluding White minority) applicants and awardees (Figure 12).
Different trends occur in award amount and award rate by value at research council level for principal investigators.
At BBSRC, ESRC and STFC in 2020 to 2021, median award amounts were higher for awardees from Asian ethnic groups than for the White ethnic group. The number of awardees that this represents ranges from 10 to 100, compared to 190 to 650 for White ethnic group across all councils.
Disaggregating award amounts at the council level by principal investigator is challenging for Black, Mixed, and other ethnic groups as the values are small, with suppressed values after rounding.
The award amounts vary across the councils and by ethnic groups. The median value of awards for principal investigators ranges from £120,000 for the mixed ethnic group at AHRC to £1,735,000 at MRC.
Gender
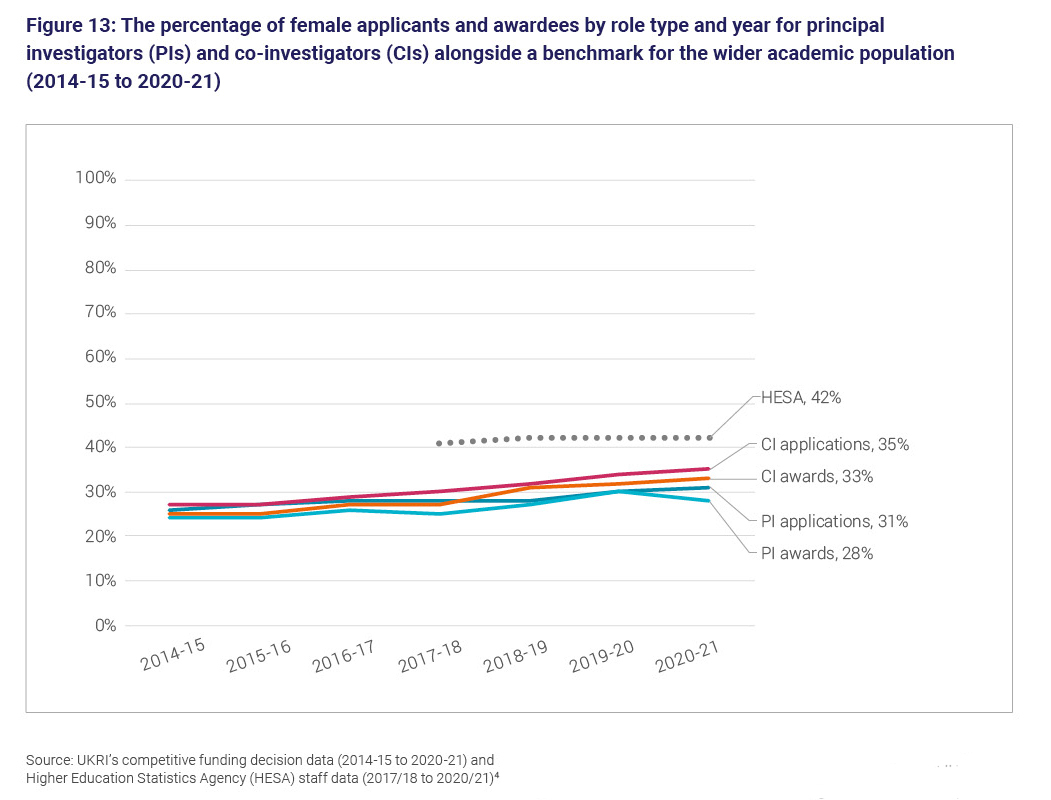
The percentage of both applicants and awardees reporting their gender as female has steadily increased for the co-investigator role type by 8 percentage points since 2014 to 2015.
For principal investigators, the trend is less clear and, while the percentage of female principal investigator applications has increased steadily (plus 5 percentage points overall), the percentage of female awards has fluctuated.
Despite some improvements in female representation for each role type, representation was below a benchmark for the wider academic population in all the last 4 years.
In 2020 to 2021, the benchmark for female representation was 42% compared with 33% for co-investigator awards and 28% for principal investigator awards.
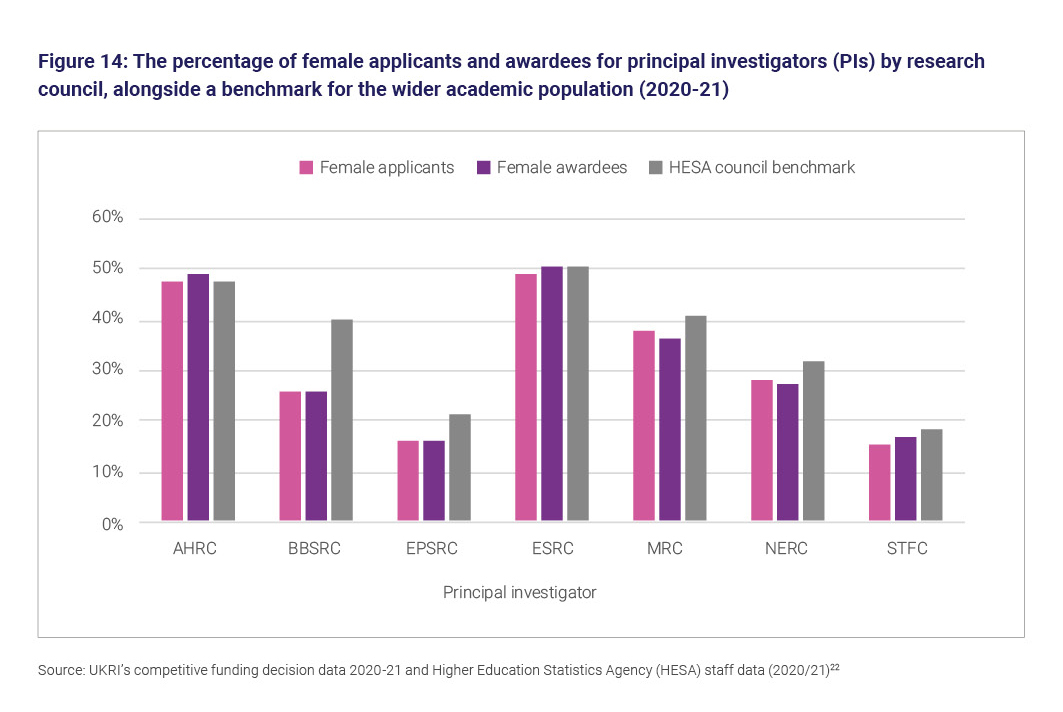
Trends in applications and awards by gender continue to vary considerably at research council level.
For principal investigators, AHRC and ESRC had the highest percentage of female applicants (48% and 49%) and awardees (49% and 51%) in 2020 to 2021, their respective HESA benchmark being 48% for AHRC and 51% for ESRC.
For all other councils, the percentage of principal investigator female applicants was below their HESA benchmark, ranging from BBSRC (with 26% of female awardees and applicants, compared to the benchmark of 40%) to MRC (with 36% and 41%).
Award rates
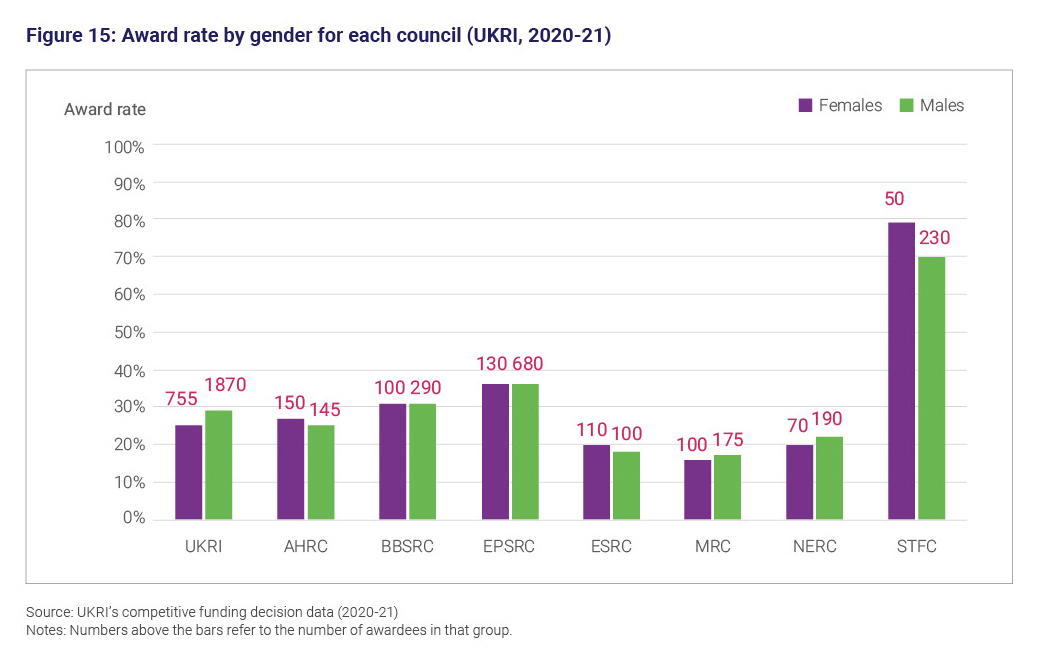
For UKRI overall, the proportion of grants awarded to principal investigators and co-investigators was higher for males in 2020 to 2021, with 70% for principal investigator and 64% for co-investigator, while the proportion of grants awarded to females overall was 28% for principal investigators and 33% for co-investigators.
However, disaggregating data for principal investigators reveals that for most councils, award rates for female principal investigators are greater than or equal to those of male principal investigators. The only exceptions are MRC (minus 1 percentage point) and NERC (minus 2 percentage points), which account for about 33% of all awardees.
Looking at award rates of co-investigators by gender, we find that the award rates are similar for all councils. The difference in favour of male co-investigators is in the range of 0.5 percentage points to 1 percentage point when disaggregated by council.
These trends vary at research council level where for principal investigators, higher award rates occurred for females at AHRC, ESRC and STFC and for female co-investigators at AHRC, EPSRC and STFC.
Award amounts
In 2020 to 2021 for principal investigators, median application and award amounts for females continued to be lower than for males.
The median application amount for male principal investigators in 2020 to 2021 was 20% higher than for females and the median award amount was 28% higher.
This difference partly reflects differences in the average award amounts of councils and the percentage of male and female principal investigators who are funded by each council.
For example, there is a higher percentage of female principal investigators funded by ESRC and AHRC, where average award amounts are lower than in some other councils.
Award rate by value for male principal investigators was also higher (at 30% compared with 25% for females Figure 16).
These trends vary at research council level, with higher median application and award amounts for female principal investigators funded by BBSRC, EPSRC and NERC.
The difference in the median application and award amounts is small: £1,000 for BBSRC and £3,000 for EPSRC. AHRC was the only research council in 2020 to 2021 with a higher award rate by value for female principal investigators, while STFC had gender parity for principal investigators in award rates by value.
Intersectionality with gender for principal and co-investigators
For the first time, this report includes data on the intersection of age, disability, and ethnic group with gender.
Data is currently limited to 1 financial year (2020 to 2021), however, and so developing our intersectional analysis to include trends over time is an important next step.
We have initially focused on the intersection of the characteristics with gender, due to the small number of applicants and awardees in some of these other groups.
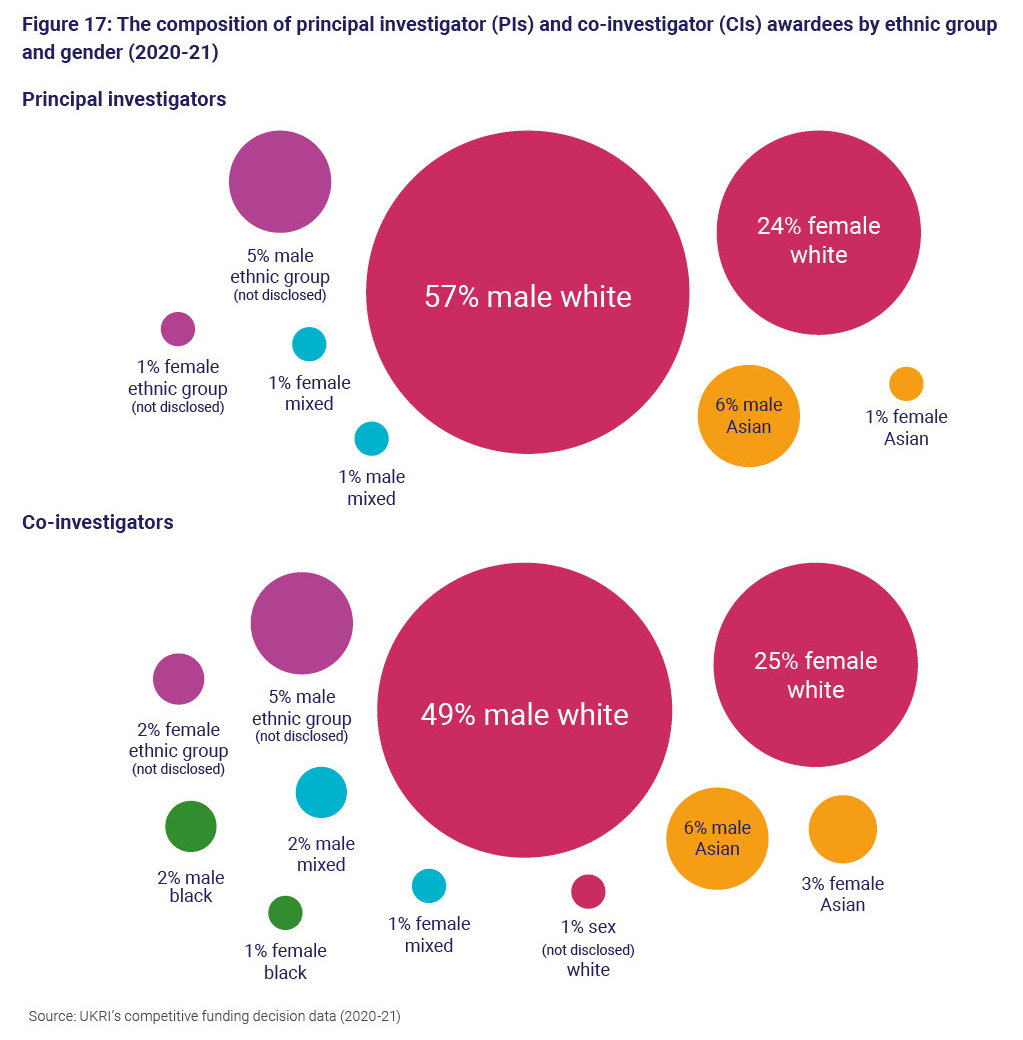
Figure 17 shows the composition of awardees for principal investigators and co-investigators in 2020 to 2021. For principal investigators, the largest group of awardees were white males, receiving 57% of awards, followed by white females, receiving 24% of awards.
The next largest group was Asian males with 6% of awards. The remaining groups each received between less than 0.5% (rounded down to 0%) and 1% of awards. Gender or ethnic group was either unknown or not disclosed for the remaining 7% of awardees.
The composition of co-investigator awardees was similar, with the highest percentage of awards received by white males (49%), white females (25%) and Asian males (6%).
Representation of Asian females amongst co-investigator awards was higher (at 3%) than for principal investigator awards. Similarly, although still low overall, representation of Black males (2%), Black females (1%) and males reporting a Mixed ethnicity (2%) were higher for the co-investigator than for the principal investigator role.
Intersection of age and gender
In 2020 to 2021, the highest proportion of principal investigator and co-investigator applications and awards was from males aged 40 to 49. For principal investigators, this was 24% of all awardees and for co-investigators 23% of all awardees.
For all age groups between age 30 and 60, the percentage of principal investigator and co-investigator awardees was higher for males. For both males and females there was little difference in the small percentage of awardees aged 29 or less.
For principal investigators and co-investigators, the award rate for males is higher than for females for all age groups except co-investigators aged 60-plus where award rate for females was 29% compared to 28% for male.
The largest difference in award rate by gender and age was for the co-investigator age group 29 or less, where the award rate for males was 5 percentage points higher than for females (at 30% and 25% respectively; the overall number of applicants in this group is low).
Intersection of gender and disability
For principal investigators and co-investigators, 1% of awardees in 2020 to 2021 were females reporting a disability and 1% were males reporting a disability. As males receive a higher proportion of principal investigator and co-investigator awards overall, this means that a higher proportion of female awardees reported a disability than male awardees. Only 26% of principal investigator awardees were females reporting no known disability compared with 65% of males.
For principal investigators in 2020 to 2021, male applicants reporting no known disability had the same award rates as males reporting a disability (30%). Female applicants reporting no known disability had a higher award rate than female applicants reporting a disability. Males also had a higher award rate than females regardless of disability status. For co-investigators, the award rate for females with no known disability was 27% compared with 23% for females reporting a disability.
Intersection of ethnicity and gender
For application and award proportions, differences by gender and ethnicity were largest for the principal investigator role.
In 2020 to 2021, White males received 57% of principal investigator awards, compared with 24% that were awarded to White females.
The next largest difference by gender was for the Asian ethnic group with Asian males receiving 6% of principal investigator awards, while only 1% were awarded to Asian females. Proportions from the Black, Mixed and other ethnic groups were similar in terms of the gender of principal investigators.
For co-investigators, the highest proportion of awardees in 2020 to 2021 was also among White males, at 49% compared with 25% that were awarded to White females. The next largest proportion of awards went to Asian males at 6%. Females from the Black and Mixed ethnic groups received 1% of co-investigator awards each.
As mentioned above, it is preferable to use 5-year cumulative figures when comparing award rates between ethnic groups due to the small number of awardees within some groups.
However, 5-year figures are not yet available for the intersection of ethnicity and gender so annual results for 2020 to 2021 are presented. These results should therefore be interpreted with caution. Additional data will be needed in future years to assess the robustness of these findings.
In 2020 to 2021, female co-investigators from the Black ethnic group had the highest award rate of all ethnic groups and genders, at 33%.
This trend was not observed for principal investigators, where Black females had one of the lowest award rates (at 16%). This was higher only than those for Black males and Asian females (at 12% each).
For principal investigators, White males and White females had the highest award rates at 30% and 28% respectively. The Asian ethnic group had the largest difference in award rate by gender for principal investigators, at 12% for Asian females and 25% for Asian males.
Fellows
The composition of UKRI’s fellows differs from the composition of other role types, with greater representation of females and individuals reporting a disability. For example, in 2020 to 2021, 4% of fellow awardees reported a disability, compared with 2% of principal investigator and co-investigator awardees. Additionally, 39% of fellow awardees were female, compared with 31% of principal investigators and 35% of co-investigators.
The age distribution of fellow awardees also differs substantially from principal investigators and co-investigators, with a much higher percentage of awardees being aged below 40. In 2020 to 2021, 73% of fellow awardees were aged below 40 compared with 24% of principal investigators and 23% of co-investigators.
Fellowships are typically targeted at researchers earlier in their careers, as they seek to transition to an academic role, and this is a factor in the age demographic that we observed.
For fellows in 2020 to 2021, there were some large differences in award rates and award amounts for different groups. However, the number of UKRI fellows is much lower than with other role types (approximately 525 fellowships were awarded in 2020 to 2021 compared with thousands of principal investigator and co-investigator awards).
Therefore, award amounts and award rates for fellows are more susceptible to year-on-year changes in individual funding opportunities.
One funding opportunity that has a large impact on UKRI’s fellowship data is ESRC’s postdoctoral fellowship funding opportunity, which accounted for 24% of all UKRI fellowships awarded in 2020 to 2021.
ESRC’s postdoctoral fellowships differ from other fellowship opportunities provided by UKRI. The fellowships run for only 1 year, and they have a capped award amount of approximately £100,000.
We also do not hold data for unsuccessful applicants for these fellowships and, as such, the award rate artificially appears as 100% in our data. The characteristics of this opportunity can, therefore, affect UKRI-level data in 3 ways by:
- lowering average award amounts
- increasing award rates
- increasing award rates by value
Data for the cross-UKRI Future Leaders Fellowships (FLF) is included in the totals for fellows under ‘pan-UKRI funds’ in council-level breakdowns, but is not separately identified.
Separate data for the UKRI FLF is also provided alongside this report for individual financial years. Results for the Future Leaders Fellowships are not discussed in this narrative as these are already reported on and discussed separately on a round-by-round basis.
Age
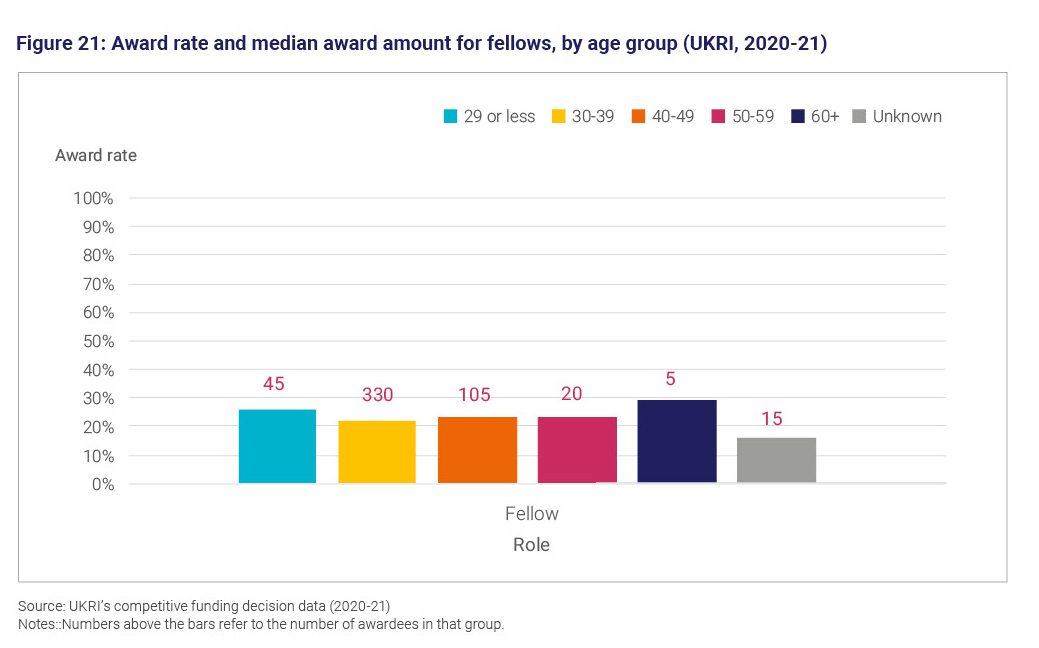
In 2020 to 2021, variation in award rates by age for fellows ranged from 22% for 30 to 39 year-olds to 29% for fellows aged 60 plus.
Median award amounts for fellows were highest for the 40 to 49 and 30 to 39 age groups and lowest for the 29-or-less age group.
The median award amount for 40 to 49 year-olds was £942,000 compared with £102,000 for the 29-or-less age group.
This difference is affected by the types of fellowship that different age groups were awarded. For example, 64% of fellows aged 29 –or less were ESRC postdoctoral fellows, for which award amount was capped.
Disability
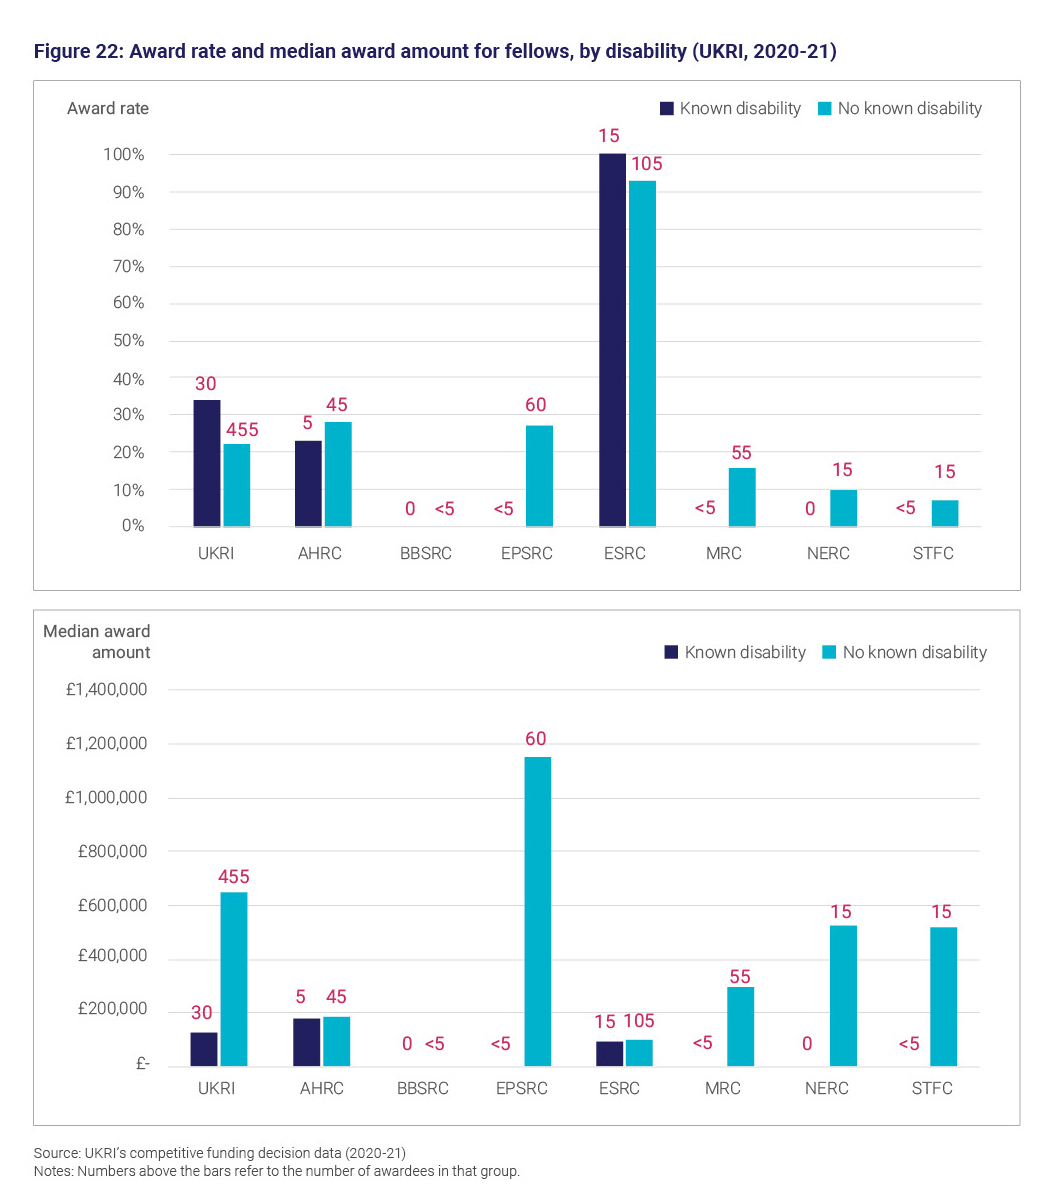
For UKRI fellows, the percentage of applicants and awardees reporting a disability increased in 2020 to 2021 to 4% for applications and 6% for awardees.
This is the highest level since the start of the time series and compares to the HESA benchmark of 5%. The percentage of fellows with disability status that was not disclosed or unknown in 2020 to 2021 was stable at 7% for both applications and awards.
In contrast to principal investigators and co-investigators, the award rate was higher in 2020 to 2021 for fellows reporting a disability (34%) than fellows reporting no known disability (22%).
However, these award rates are affected by ESRC’s postdoctoral fellowships, which have a higher percentage of fellows reporting a disability (11%) and an artificial success rate of 100%.
If these are removed from the data, the difference between the 2 award rates is smaller, but it is still higher for applicants reporting a disability.
After removing this opportunity, the award rate for fellows reporting a disability was 22% compared with 18% for fellows reporting no disability.
Award amounts by disability status for fellows are also affected by the ESRC postdoctoral fellowship. Overall, median award amounts were over 5 times higher for applicants reporting no disability (£645,000) than for applicants reporting a disability (£123,000).
However, 47% of fellows reporting a disability were ESRC postdoctoral fellows (whose award amounts were capped), compared with 23% of fellows reporting no disability.
If this opportunity is removed from the data, the difference between the 2 groups is smaller, with a median award amount of £926,000 for fellows reporting no disability and £877,000 for those reporting a disability.
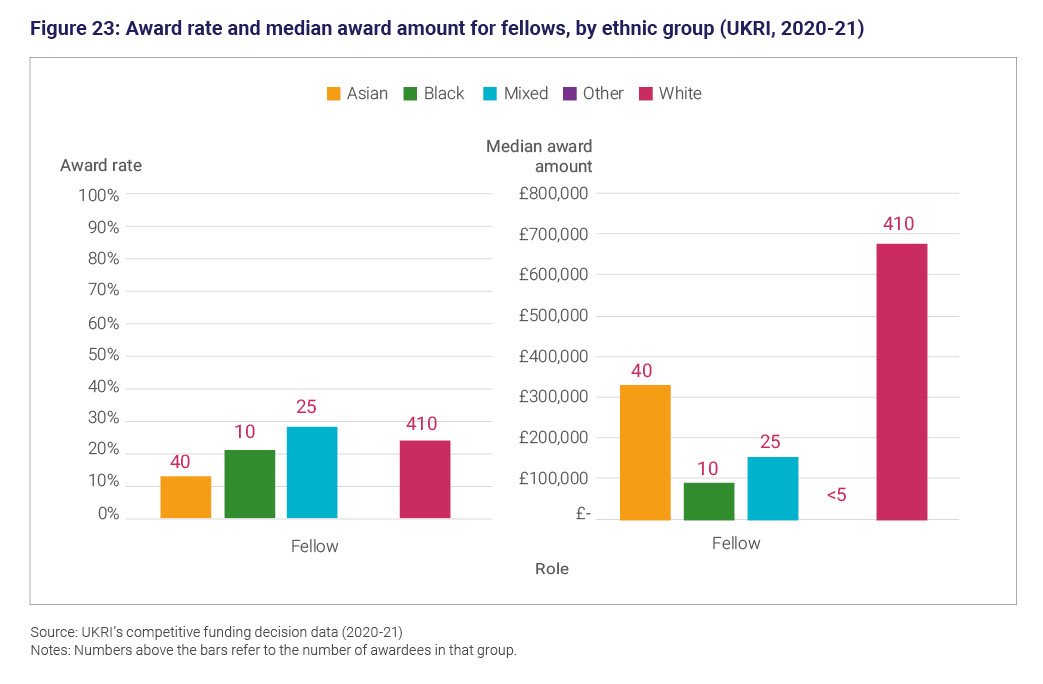
Ethnicity
In all the years since 2014 to 2015, the highest percentage of awardees was from the White ethnic group, ranging from 77% to 85%.
The Asian ethnic group has the next highest percentage of awardees at 8% in 2020 to 2021 while Black and Mixed represent 2% and 5% respectively. Not disclosed for ethnicity is at 6%, twice the level in the HESA data.
There is variation across councils. Over the 5-year period 2016 to 2017 to 2020 to 2021 for fellows the percentage of awardees ranges between no available values for BBSRC and MRC, less than 1% for STFC and NERC, and over 9% for ESRC.
The award rate for Black ethnic group also varies, with ESRC reporting 100% award rate over the 5 years, compared with a UKRI value of 19%.
Gender
As with principal investigators, male fellows applied for larger amounts on average and were awarded larger amounts, than females in 2020 to 2021.
This trend is consistent with previous years, though in 2020 to 2021 the difference in median application and award amount between males and females increased, with the median application amount for males being £682,000 compared to £553,000 for females and the median award amount for males being more than 3 times greater than for females.
This large difference for fellows in 2020 to 2021 is largely driven by the composition of fellowship types by gender. In particular:
- 24% of UKRI fellowships were ESRC postdoctoral fellowships. The award amount is capped, and there was a median award amount of approximately £96,000 for females and approximately £98,000 for males in 2020 to 2021. Over 70% of ESRC postdoctoral fellowships in 2020 to 2021 were awarded to females, and this accounts for 35% of UKRI fellowships to females overall
- a higher percentage of male fellows were awarded by EPSRC and NERC, where award amounts are higher than they are at some other councils (at over £1 million for EPSRC and over £500,000 for NERC)
- the difference in median award amount by gender was larger at MRC than in previous years, with a median award amount of £952,000 for males and £300,000 for females
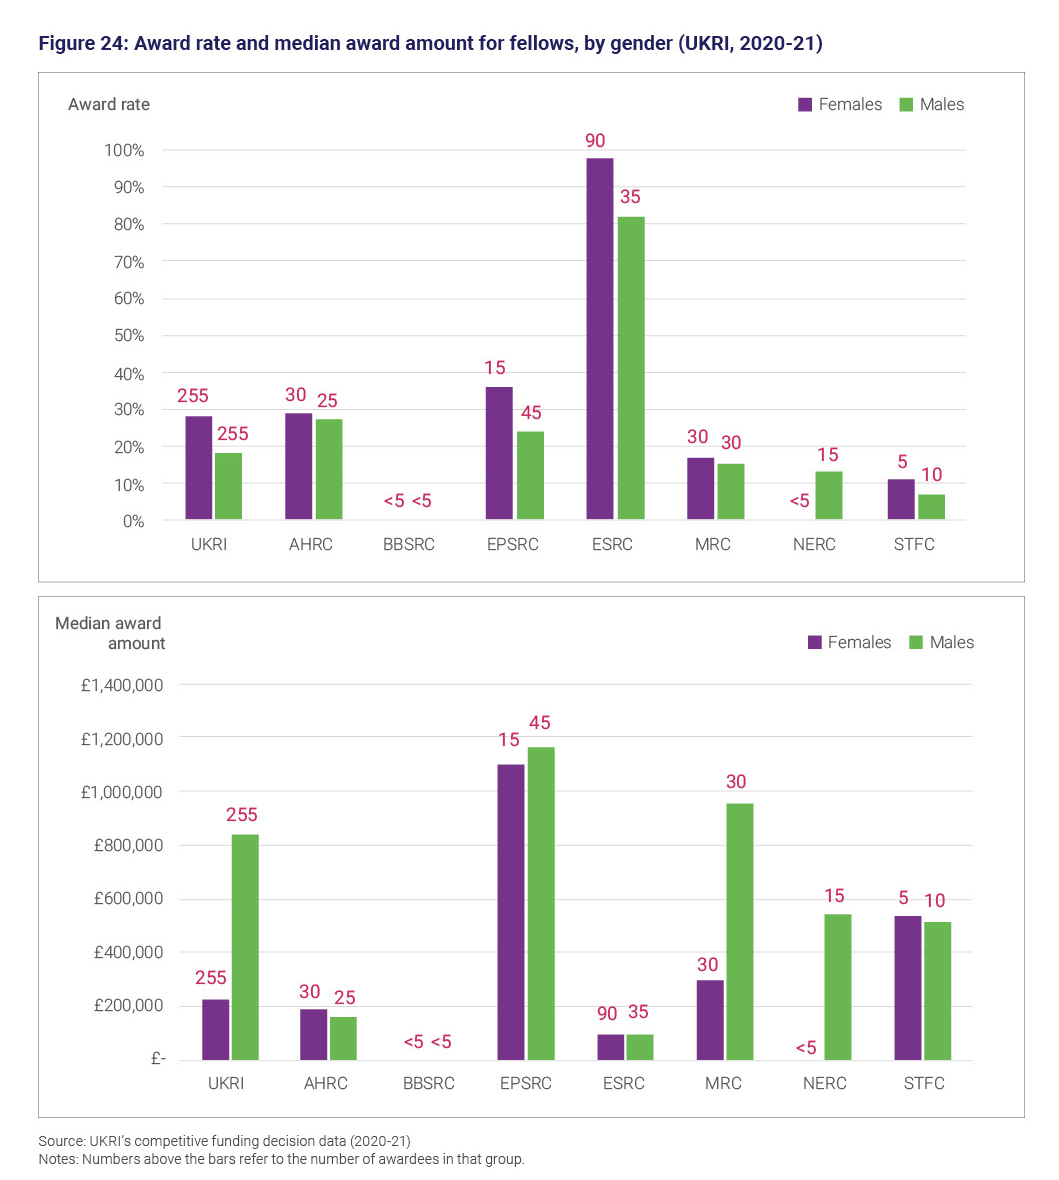
The award rate by value in 2020 to 2021 was higher for female fellows than male fellows at 23% and 19% respectively). This trend is consistent with previous years and shows that female fellows on average were awarded a higher proportion of what they applied for than males.
The percentage of female fellow awardees at ESRC was particularly high in 2020 to 2021 at 71% (compared with a HESA benchmark of 51%). This was due to the high proportion of females who received awards through ESRC’s postdoctoral fellowship.
The impact of ESRC’s postdoctoral fellowship on average award amounts can be seen this year in breakdowns by gender.
At UKRI-level in 2020 to 2021 the median award amount for male fellows was approximately £840,000, compared with approximately £223,000 for female fellows.
If ESRC’s postdoctoral fellowship is removed from the data, differences in award amounts between the 2 groups are much smaller, with a median award amount of approximately £961,000 for male fellows and £921,000 for female fellows.
Intersectionality with gender for fellows
Intersection of age and gender
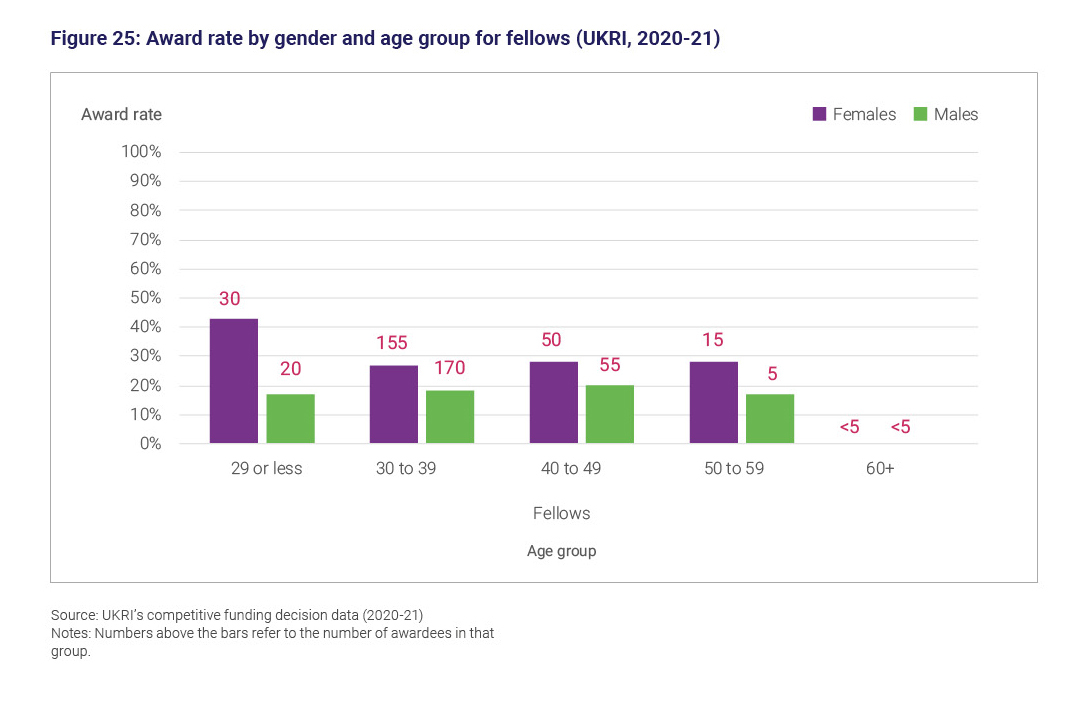
For fellow awardees the age distribution of males ranged from 1% to 32% across all age groups. For females the highest proportion was 29% in the 30 to 39 age group, with the other age groups ranging between 1% and 10%.
When looking at intersectional data for fellows there are a small number of awardees in some groups, meaning that award rates should be compared with caution.
For fellows in 2020 to 2021, the award rate for females was higher than that of males for all age groups.
The largest difference was for the age group 29 or less, where the award rate for females was 43% compared with 17% for males.
This large difference is due to the high proportion of female ESRC postdoctoral fellowships in this age group, in which award rates were 100%. For female fellows aged 29 or-less, 75% were ESRC postdoctoral fellows compared with 47% of male fellows in this age group.
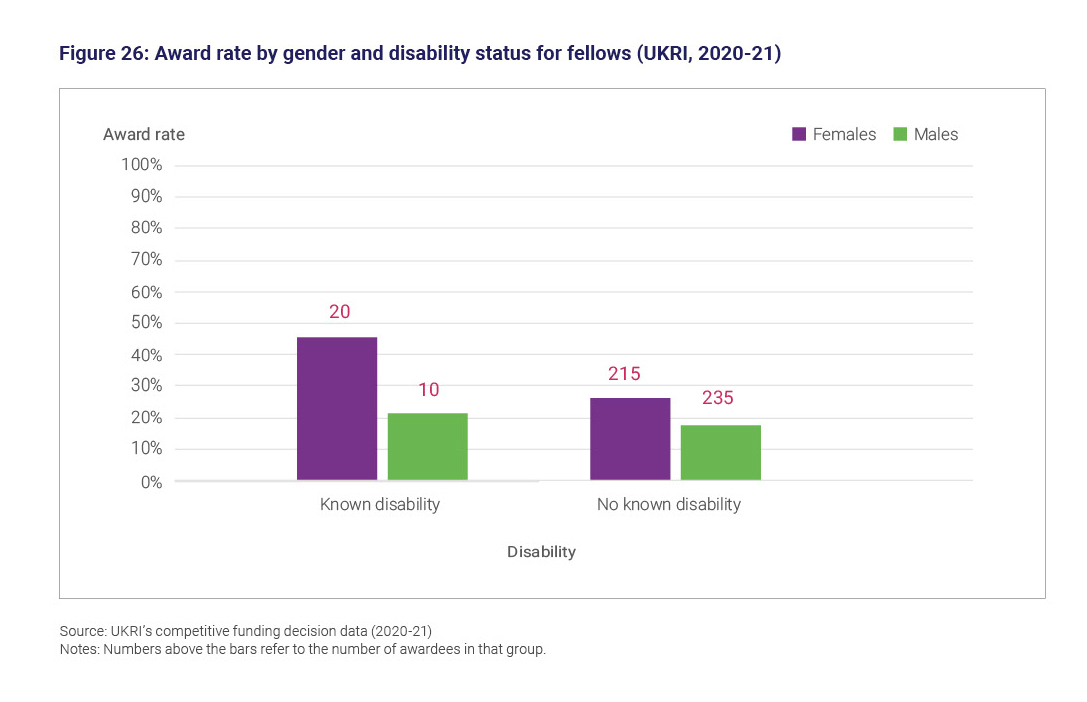
Intersection of gender and disability
For fellows’ applications and awards, a higher proportion of females also reported a disability in 2020 to 2021. Female fellows reporting a disability received 4% of awards, compared with 2% for males. There was little difference between groups reporting no disability, at 41% for females and 45% for males.
For fellows, differences in award rate were larger and trends were reversed.
For both males and females, applicants reporting a disability had a higher award rate than applicants reporting no known disability.
The highest award rate was for females reporting a known disability, at 46% compared with 18% for males reporting no known disability who had the lowest award rate in 2020 to 2021 (Figure 26).
It is important to note that at this level of granularity award numbers are small and individual funding opportunities can have a large impact on findings.
For example, of the approximately 20 female fellow awardees reporting a known disability in 2020 to 2021, approximately 57% are ESRC postdoctoral fellowships, which have an award rate of 100% due to the exclusion of application data from the dataset.
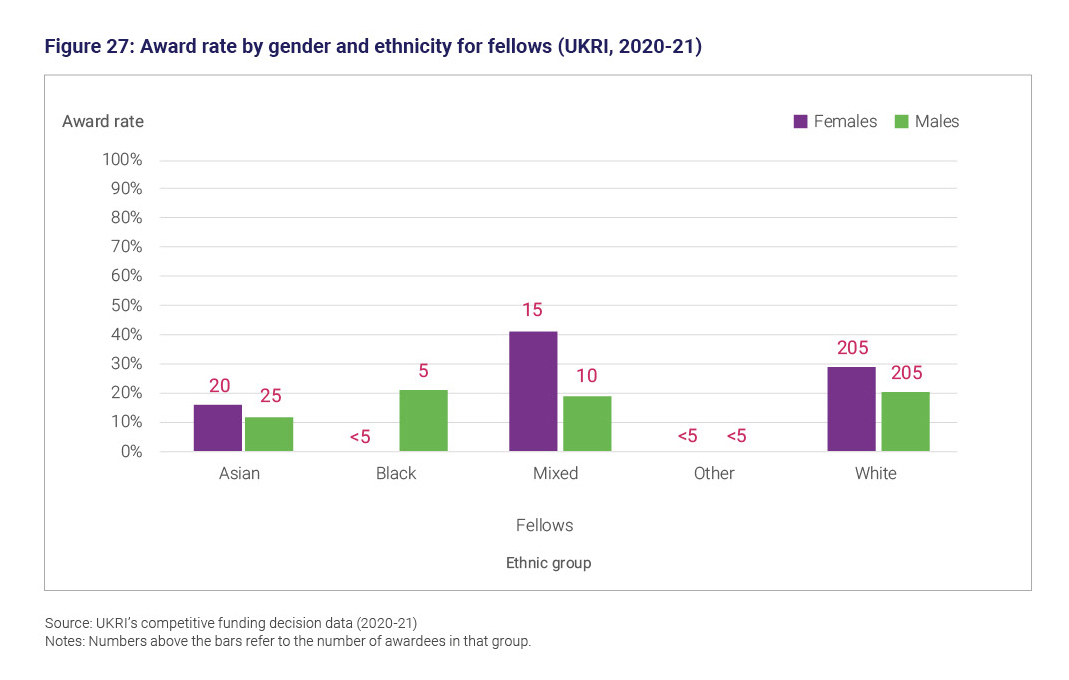
Intersection of gender and ethnicity
For fellows in 2020 to 2021, there was very little difference on applications and awards between the gender and ethnic groups.
The 2 largest groups were White males and females, each receiving 39% of awards. Following this, Asian males received 4% and Asian females 3% of awards. All other groups received between 1% and 3% of awards.
The highest award rate was for females reporting Mixed ethnicity, with an award rate of 41% compared to 19% for males of Mixed ethnicity. This can be compared to females of White ethnicity (at 29%) and those of Asian ethnicity (at 16%).
Studentship starts
Results for studentship starts are discussed separately from the other role types, as the source data differs from the data that is used for UKRI’s research grants and fellowships (see under ‘Data sources and limitations’ in Annex A for more details).
As a result, application data and award rates are not included for studentship starts and instead the findings below focus on the distribution of awards. Next time we will expand this to include intersectionality.
In 2020 to 2021, UKRI had 5,370 new studentship starts. There is a large variation in the distribution of the studentship starts across the research councils.
EPSRC has 47% of all new studentships starts, while the share ranges from 6% to 13% for all other councils.
Age, gender, and disability status
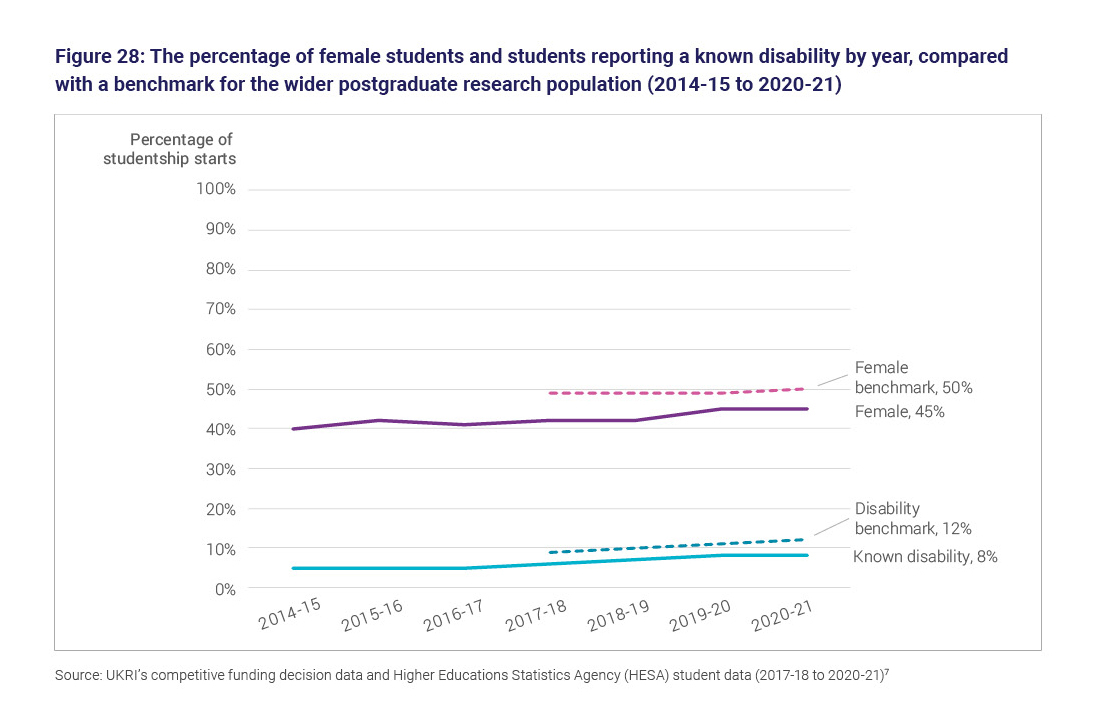
Figure 28 shows change over the 7-year period in the proportion of studentship starts of females and those students with a known disability aged 29 or less.
For most of the characteristics, change during the 7-year period has been small. The percentage of studentship starts aged 29 or less was the same in 2020 to 2021 as in 2014 to 2015 at 82%.
The percentage of studentship starts reporting their gender as female has increased from 40% in 2014 to 2015 to 45% in 2020 to 2021 but remains below the HESA benchmark for the wider postgraduate research population (at 50%).
Studentship starts reporting a known disability has increased from 5% in 2014 to 2015 to 8% in 2020 to 2021, but also remains below the HESA benchmark for the wider postgraduate research population (12%).
At research council level, all councils had an increase in studentship starts reporting their gender as female during the 7-year period.
The largest increases during this time were at MRC and NERC each with a 10 percentage point increase in female representation since 2014 to 15. At MRC, 65% of studentship starts reported their gender as female in 2020 to 2021 and 57% at NERC.
Similarly, all research councils have had an increase in the percentage of studentship starts reporting a disability since 2014 to 2015.
The largest increase during this time was at MRC where in 2014 to 2015 4% of studentship starts reported a disability compared with 10% in 2020 to 2021.
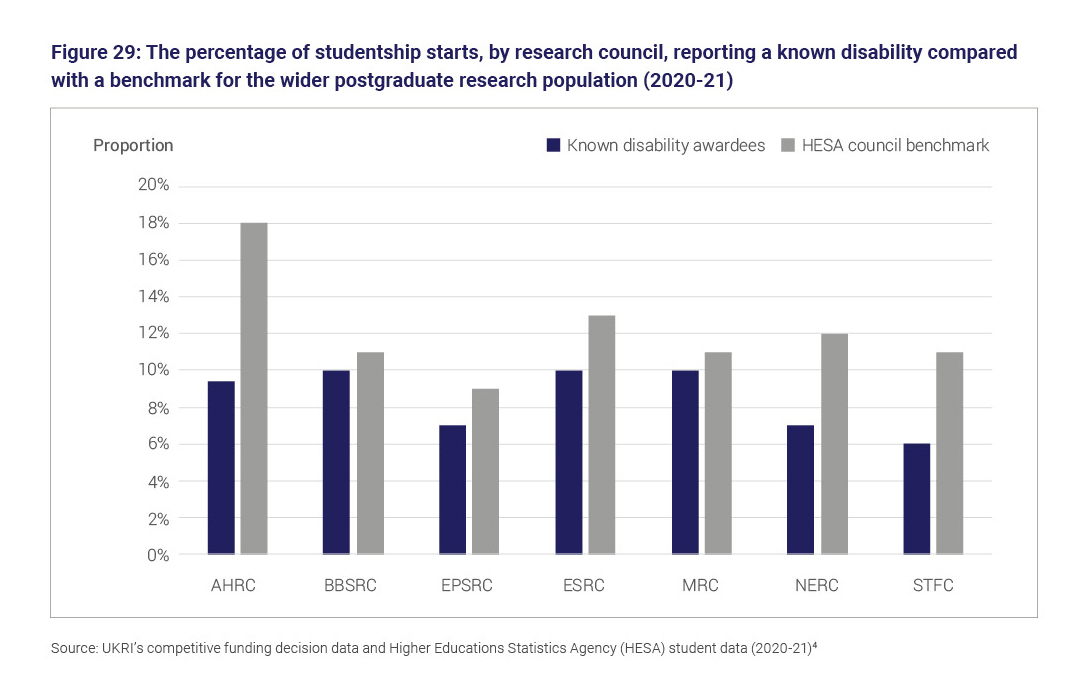
The percentage of studentships starts reporting a disability falls below the benchmark for the wider postgraduate research population for all research councils.
While the average disability benchmark is 12%, there is variation at the research council level, with the benchmark ranging from 18% for AHRC to 9% for EPSRC.
For all research councils, those reporting a known disability remain below the benchmark for the wider postgraduate research population.
Ethnicity
The percentage of studentship starts whose ethnicity was not disclosed or unknown has been consistently high since the start of the time series.
In 2020 to 2021, ethnicity was not disclosed or unknown for 32% of studentship starts, meaning that our understanding of ethnicity for studentships is partial.
This level of non-disclosure is much higher than in HESA data for the wider postgraduate research population, with ethnicity not disclosed or unknown for 4% of postgraduate research students (Figure 30).
This makes it difficult to draw meaningful comparisons with HESA data across the ethnic groups. Figure 30 shows that in 2020 to 2021, the percentage of studentship starts for all ethnic groups was below the wider postgraduate research population.
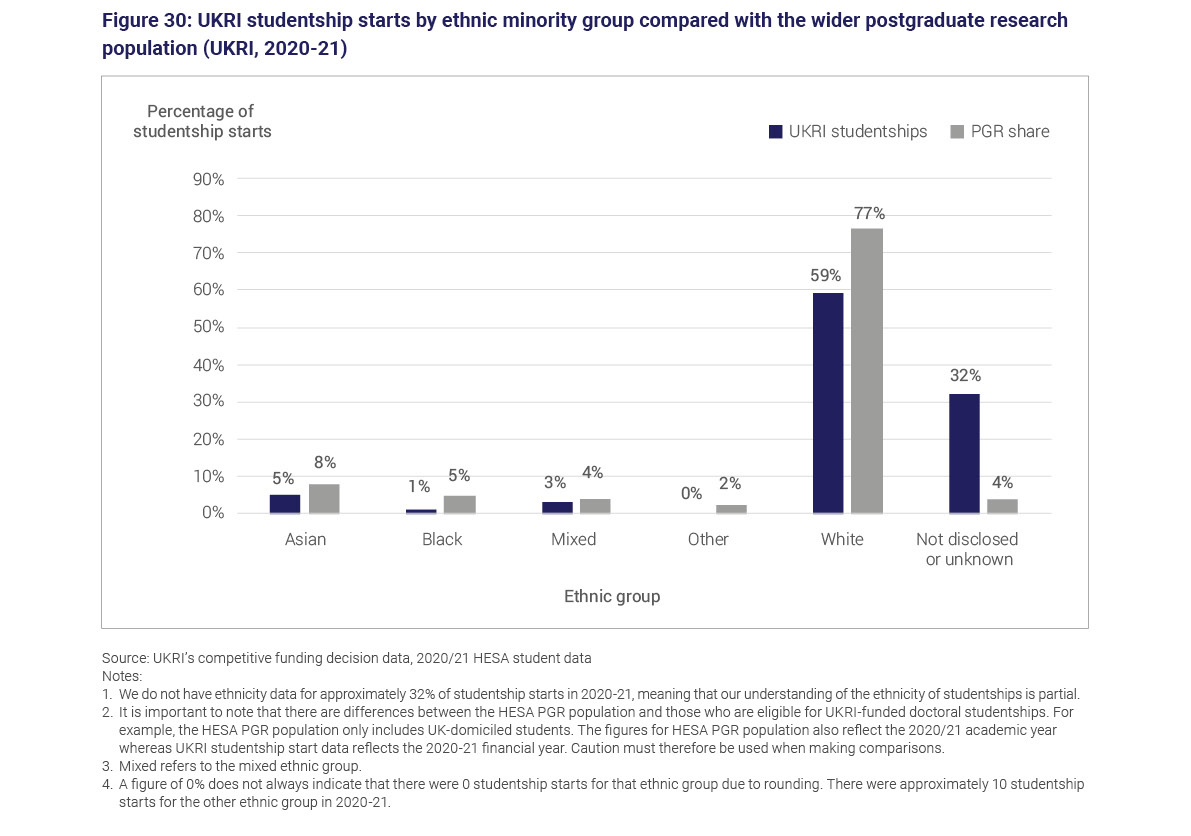
After the White ethnic group, the highest proportion of studentship starts in 2020 to 2021 were from the Asian ethnic group (5% of studentship starts), followed by the Mixed (3%), Black (1%) and other (0%) ethnic groups.
Within the ethnic minority groups trends are consistent with previous years:
- students from Indian and Chinese ethnicities continued to have the largest share in 2020 to 2021 at 32% and 25% of Asian studentship starts respectively
- African ethnicities continued to make up the largest share of the Black ethnic group in 2020 to 2021 at 72% of studentship starts
- students reporting a ‘Mixed-other’ ethnicity make up the largest share at 51% of Mixed ethnic group studentship starts in 2020 to 2021
Annex A: Methodology
Presentation of the data
Data is presented:
- through descriptive narrative in this document
- in MS Excel files available for download
- via an interactive dashboard to enable visualisation of the data
The narrative primarily presents findings for UKRI. However, council-level results are also discussed where they deviate substantially from the UKRI average or change over time.
Detailed results for individual councils are provided in the Excel downloads and interactive dashboard. Council-level data for intersectionality is not provided within this report due to the small number of awardees at this level of disaggregation.
In summary, the data tables that are available for download alongside this narrative are:
- UKRI applications, awards and award rates for principal investigators, co-investigators and fellows, including full time-series data (2014 to 2015 to 2020 to 2021) for individual financial years and a 5-year cumulative total (2016 to 2017 to 2020 to 2021). Intersectionality data is also included in these tables for the financial year 2020 to 2021
- average award amounts and award rate by value for principal investigators and fellows for individual years in the full time-series (2014 to 2015 to 2020 to 2021)
- studentship starts for individual years in the full-time series (2014 to 2015 to 2020 to 2021) and a 5-year cumulative total (2016 to 2017 to 2020 to 2021)
- applications, awards, and award rates for UKRI’s Future Leaders Fellowships (FLF) scheme for individual financial years (2018 to 2019 to 2020 to 2021) and a 3-year cumulative total
- average award amounts for UKRI’s FLF scheme for individual financial years (2018 to 2019 to 2020 to 2021)
Rounding and suppression
Results for groups with between 1 and 4 members are suppressed. Counts of 5 or more are rounded to the nearest multiple of 5. Counts of 0 are shown.
Proportions are calculated based on unrounded numbers.
Award values are rounded to the nearest £1,000.
For Higher Education Statistics Agency (HESA) data, we follow HESA’s rules of rounding and suppression.
Guidance on interpreting data
Throughout this narrative, data is primarily presented and discussed at UKRI level. However, this aggregation of data can mask significant variation at research council or individual funding opportunity level.
To understand the reasons for differences between groups, or changes over time, it is therefore important to interrogate the data at the most granular level possible. For example, the composition of 1 opportunity in a particular year can impact heavily upon figures for UKRI as a whole.
Therefore, where necessary, further context is provided to explain changes in UKRI-level findings over time.
Where data is presented at a granular level, the number of applications and awards for certain groups can become very small, challenging the robustness of conclusions.
For example, decisions on individual awards can have a large impact on award rates for a particular group where the overall number of awards is small.
This can be a particular challenge for the fellow role type where the overall number of awardees is smaller than for principal investigators and co-investigators.
Where possible, groups with a small number of applications or awards have therefore been flagged, and we urge caution when exploring the data for these groups.
In addition to the above, we would like to offer the following further notes of guidance when interpreting the data:
- our analysis is based on applications, not unique applicants. An applicant can put in multiple applications in the same year and be counted more than once
- applications are grouped into financial years based on when the decision was made and not when the application was made
- fellowships with multiple fellows and research grants with multiple principal investigators are excluded from the data as identifying the original investigator is not possible in our funding system
- changes in award rates over time should not be used as evidence to understand progress or problems. Award rates fluctuate annually and are a function of other factors such as budgetary availability and demand for funding
- we cannot use this data to draw conclusions on the relationship between personal characteristics and application and award rates without controlling for the effects of other factors both on an individual and an organisational level. These include career stage, discipline, geographic location, and type of organisation of the applicant
- monitoring of award rates for a group should be done in the context of other measures such as overall award rate as well as the award rate of the counterpart. For example, award rate of female applicants should be understood in the context of changes in award rates of male applicants
- differences in demand and the nature of funding mean that award rates should not be compared across councils. For example, STFC has a higher award rate than other councils as STFC uses a method of demand management for some grants that requires a group or department to submit all their projects as 1 overall grant. The individual projects are peer reviewed and ranked discreetly, which also ensures that STFC aim to fund the best research within a large, consolidated grant
- cross-council comparisons of the proportion of applicants and awardees should only be made after accounting for baseline population estimates of research populations. We have provided HESA staff and student estimates for each council, which can be used to understand the diversity profile of underlying subjects. Please note that the diversity profiles based on cost codes and Higher Education Classification of Subjects (HECoS) codes, respectively for research and student populations, are indicative only, due to limitations described in table 2
- for studentship funding, ethnicity data is not disclosed for approximately 30% of awardees in all years. This extent of unknown data limits the strength of the conclusions that can be drawn about the ethnicity profile of studentship starts
Diversity characteristics
Our funding service currently gathers data on 4 protected characteristics, age, disability, ethnicity and gender. Description of variables and modification below describes how the data is collected and presented.
We are reviewing our data collection processes through development of the new funding service. Within this, we will review how data is collected against the characteristics below and will also widen our data collection to other protected characteristics.
We will engage with the community to understand areas of interest and will continue engaging with UK data specialists and regulators about ways to collect and present our information.
When discussing ethnicity in this report, Cabinet Office guidance has been considered and followed where possible.
Recommendations include disaggregating ethnicity as much as possible and moving away from use of the term ‘BAME’. Therefore, within this report, data is presented and discussed at as granular level as possible.
Where the numbers within ethnicity categories are small, we aggregate ethnicities into Asian, Black, Mixed, other and White ethnic groups following the Government Statistical Service harmonised ethnicity standard.
We recognise that aggregation of data in this way can mask the experiences of individual groups, but this is as granular as we are able to present the data, without risking disclosure of information or the robustness of conclusions.
We also recognise that our current ethnicity categories are not appropriate for our international applicants.
Description of variables and modification
Age
Based on applicant’s date of birth and date of decision.
Results are presented as:
- 29 or less
- 30 to 39
- 40 to 49
- 50 to 59
- 60 plus
- unknown
Disability
The following options are presented to applicants:
- an unseen disability
- autistic spectrum disorder
- blind or partially sighted
- deaf or hearing impairment
- dyslexia
- mental health difficulties
- wheelchair user or mobility difficulties
- multiple disabilities
- a disability not listed above
- no known disability
- not disclosed
- unknown
Results are presented by disability status:
- known disability
- no known disability
- not disclosed
- unknown
Ethnicity
How ethnicities are presented (with the options in brackets):
- Asian (Bangladeshi, Chinese, Indian, Pakistani, any other Asian background)
- Black (African, Caribbean, any other Black/African/Caribbean background)
- Mixed (White and Asian, White and Black African, White and Black Caribbean, any other Mixed or multiple ethnic background)
- Other
- White (White British, White Irish, any other White background)
- unknown
- not disclosed
- Asian, Black, Mixed and Other together are also presented as ethnic minorities (excluding white minorities)
Gender
The options were male, female or not disclosed.
The current funding service asks applicants to provide information on gender with male, female or not disclosed as response options. For this reason, we use the terminology male and female to describe gender categories throughout this document.
We appreciate that gender and sex terminology is more nuanced and highly personal and plan to reflect this through data collection in the new funding system.
Not disclosed and unknown
‘Not disclosed’ refers to when respondents have consciously chosen to not disclose their personal information and selected the ‘not disclosed’ option.
‘Unknown’ is where individuals have not provided their details and therefore we have no usable information.
The application system used to collect the data asks applicants to provide information on gender, with male, female and not disclosed as response options. For this reason, we use the terminology male and female to describe gender categories throughout this document. We appreciate that gender and sex terminology is more nuanced and highly personal and plan to reflect this through data collection in the new funding system. In 2020 to 2021 gender was either not disclosed or unknown for 1% to 2% of applicants across the role types. This is consistent with previous years.
Data sources and limitations
Research grants and fellowships (principal investigators, co-investigators, fellows)
Time period: 2014 to 2015 to 2020 to 2021 awardees are grouped into financial year based on the date on which UKRI decided on the application, not the date the application was submitted.
Data source: Source data used is the same as the competitive funding decision data used in UKRI’s annual reports, but with Innovate UK and Research England applications and awards removed.
Sources included are:
- the Joint electronic Submission system (Je-S) for the research councils
- additional funding decisions captured outside of Je-S such as rapid response funding (including ‘UKRI response to COVID’), opportunities administered by funders outside of UKRI and grants awarded to MRC institutes, units and centres
Note that grants where we cannot link to person level data are removed from the dataset (less than 1% of grants).
Limitations: Non-disclosure of data:
- approximately, 5% to 9% of respondents did not share their ethnicity in 2020 to 2021 across the 3 roles
- in 2019 to 2020, non-disclosure of disability status was approximately 6% to 8% across the 3 roles
- for a small percentage of opportunities, data is not included for applications. These artificially appear to have a 100% success rate. Due to the small percentage of these opportunities, this should not affect comparisons between groups
Studentship starts
Time period: 2014 to 2015 to 2020 to 2021 student starts are based on the first financial year that the studentship award was active, a time stamp that typically represents a student’s intake year.
Data source: Individual studentship information submitted by research organisations (to research councils via the cross-council Je-S studentship detail functionality.
(Funding for studentships is mainly provided to research organisations as a block grant. They then select candidates for specific studentship projects or fund an independent project proposal.)
Limitations: UKRI does not collect equality, diversity and inclusion data for studentships through the application process. Instead, it is provided by the research organisation through the Je-S studentship detail functionality.
Data provided in this way only covers studentship starts and does not include application data (It is provided to UKRI annually through a summary annual report completed by each research organisation. However, inconsistencies between organisations in the way that this data is collected and provided to UKRI mean that it cannot currently be collated and analysed at UKRI level. Data is therefore only included on awards for studentships starts and award rates cannot be calculated. UKRI is reviewing its data collection process for studentships and endeavours to improve the quality of application data collected through this annual report.). Therefore, award rates are not included for studentship starts.
Ethnicity data is not disclosed or unknown for approximately 30% of awardees in all years.
Diversity profile of wider academic community for UKRI and each council
Time period: 2020 to 2021 academic year. This is the most recent year available to create council level benchmarks.
Data source: HESA data based on cost codes for academic populations. Using the HESA 2020 to 2021 staff return, staff full-person equivalent, academic staff (excluding atypical), academic employment function, both teaching and research contracts.
HECoS codes for postgraduate (masters and doctoral research) students and full person equivalent. Common aggregation hierarchy level 3 is used.
Limitations: HESA data reflects the diversity population of the UK higher education institutes (HEIs), whereas some UKRI funding opportunities do allow for international applicants or researchers outside of UK HEIs.
For ethnicity, data is for UK-domiciled students only.
HESA data is based on academic years rather than financial years. The 2020 to 2021 academic year used here only overlaps with the first 4 months of the 2020 to 2021 financial year.
Staff were included within council level HESA benchmarks, based upon the cost centre their contract(s) were allocated to. Cost centres that were allocated proportionately to councils based upon the funding distribution of cost centres by councils during the 2020 2021 financial year reported in HESA finance data.
Students were included within council level HESA benchmarks based upon the subject or subjects appropriate to their course. Subjects were allocated proportionately to councils based upon the council funded student headcount in 2020 to 2021 HESA student data.
Diversity profile of labour market (employed) population
Time period: April to June 2020 to January to March 2021 disability and ethnicity.
Data source: ONS Labour Force Survey disability and ethnicity.
Limitations: Data from the ONS Labour Force Survey on disability and ethnicity is available on a quarterly basis rather than a financial year basis. Data for the 4 quarters of the 2020 to 2021 financial year has been used to calculate a weighted average.