
This report contains information on UKRI’s historic annual spend on studentships and fellowships, alongside associated starts and stock at aggregate and council level.
Introduction
This publication provides information on UK Research and Innovation (UKRI’s) historic annual spend on studentships and fellowships alongside associated starts and stock at both aggregate and council level. High level graphs indicating trends can be found within the narrative in the main body of the report, with detailed data tables provided towards the end of the report. The data quality statement to accompany this information can be found at the end of this report.
Investment in talent continues to be an important strategic priority for UKRI, with the budget allocated to collective talent increasing from £571 million (7.3% of UKRI’s allocation) in 2021 to 2022, when collective talent was initiated, to £726 million (8.2%) in 2024 to 2025. Of UKRI’s SR25 settlement, 9% is allocated to collective talent, with £907 million (9.1%) allocated to collective talent by 2029 to 2030.
Total UK studentship numbers and the proportion funded by UKRI
Annual studentship starts by HESA reporting year
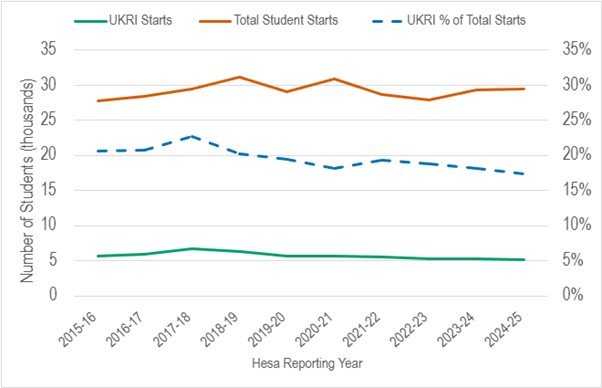
Figure 1: Annual studentship starts by Higher Education Statistics Agency (HESA) reporting years 2015 to 2025. The solid green line shows the number of UKRI-funded studentship starts, the solid orange line shows total UK student starts, and the dashed blue line shows UKRI-funded starts as a percentage of UK total starts (righthand axis).
Description of figure 1
This chart shows trends in doctoral studentship starts in higher education across HESA reporting years from 2015 to 2025. It compares UKRI-funded studentship starts with total UK studentship starts, alongside UKRI’s share of the total. The chart shows that UKRI supported 5,115 student starts in reporting year 2024 to 2025.
Overall, there were 29,445 UK studentship starts in reporting year 2024 to 2025, 6% higher than reporting year 2015 to 2016, resulting in the proportion of starts funded by UKRI decreasing from 21% in reporting year 2015 to 2016 to 17% in reporting year 2024 to 2025.
Additional context for figure 1
There was an increase in UKRI-funded student starts in reporting year 2017 to 2018 and reporting year 2018 to 2019 to over 6,000 starts per year, due to additional government funding boosting research and development through the National Productivity Investment Fund (NPIF). Since then, UKRI-funded student starts have generally been falling.
Looking by financial year, the number of UKRI funded starts in financial year 2024 to 2025 is 22% lower than the number of starts in financial year 2015 to 2016, despite a 32% cash terms increase in annual spend.
Our minimum stipend has increased significantly since 2021, driven by high inflation and concerns over the cost of living. Following a review of UKRI stipend levels in 2024, UKRI has revised its policy position to ensure that stipends are at least equivalent to the take-home income from the national living wage.
In real terms, students on the minimum stipend in January 2026 are 6% better off than their peers in January 2021 (36% in cash terms). This real-terms increase to the stipend reflects our ongoing commitment to attracting, retaining and developing people.
The unit cost of doctoral training is expected to rise in future years. Additional unit cost increases are anticipated following the postgraduate research full economic cost review outlined in the post-16 education and skills white paper.
Provision has been made for cost increases in UKRI budgetary planning with the aim of broadly maintaining new student starts at 2024 to 2025 levels, assuming co-investment remains at current levels. The exception to this is planned reductions in Arts and Humanities Research Council (AHRC) student recruitment following their portfolio rebalancing exercise in 2023.
Annual studentship stock by HESA reporting year
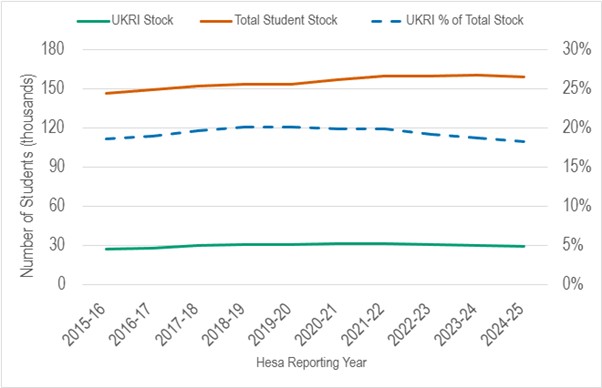
Figure 2: Annual studentship stock by HESA reporting year, from 2015 to 2025. The solid green line shows the number of UKRI-funded students, the solid orange line shows total students, and the dashed blue line shows UKRI-funded students as a percentage of total students (right-hand axis).
Description of figure 2
This chart shows trends in doctoral studentship stock in higher education across HESA reporting years from 2015 to 2025. It compares UKRI-funded studentship stock with total UK studentship stock, alongside UKRI’s share of the total.
Overall, total studentship stock increases gradually over the period, with 146,585 active students in reporting year 2015 to 2016 and 159,640 in reporting year 2024 to 2025.
UKRI student stock was 27,315 in reporting year 2015 to 2016, with a peak of 31,850 in reporting year 2021 to 2022, declining to 29,265 by reporting year 2024 to 2025. UKRI funded 18% of the total student population stock in reporting year 2024 to 2025.
Additional context for figure 2
The UKRI stock of studentships generally follows the trend of UKRI student starts spread over multiple years. The exception to this is the impact of COVID-19, which increased stock in reporting years 2020 to 2021 and 2021 to 2022, as a result of funding extensions provided to students because of the pandemic.
Studentship starts, stock and spend by funder
UKRI-supported studentship starts by research council
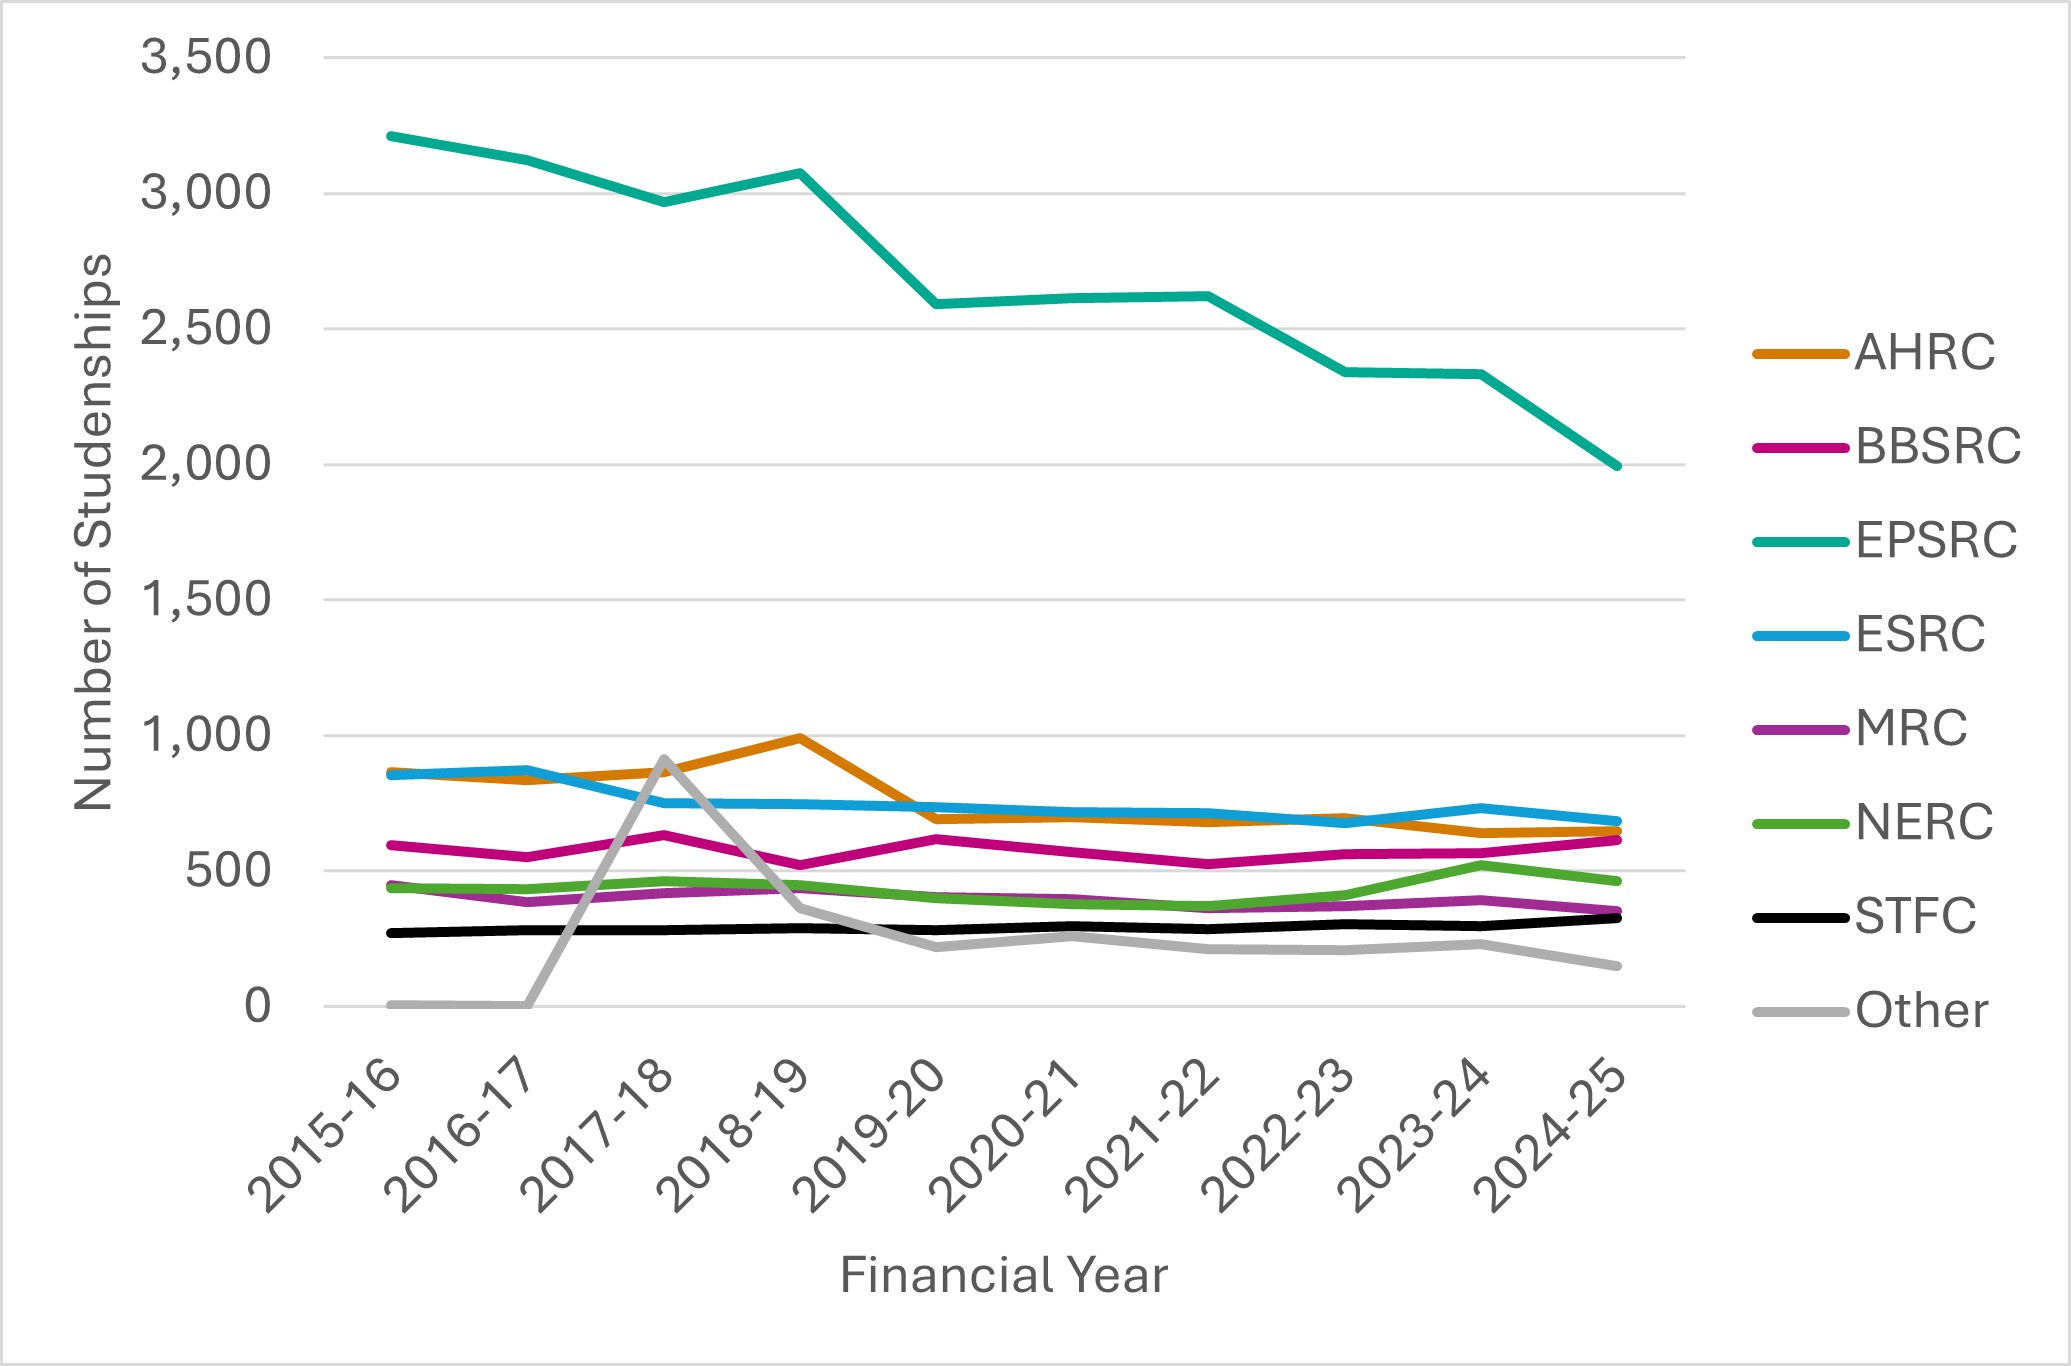
Figure 3: UKRI-supported studentship starts by research council between the financial years 2015 to 2025
Description of figure 3
This figure shows the number of UKRI-supported studentship starts between the financial years 2015 to 2025 by research council. Each line represents a different council, AHRC, the Biotechnology and Biological Sciences Research Council (BBSRC), the Engineering and Physical Sciences Research Council (EPSRC), Economic and Social Research Council (ESRC), the Medical Research Council (MRC), the Natural Environment Research Council (NERC), the Science and Technology Facilities Council (STFC) and ‘other’.
The category ‘other’ includes cross‑council programmes, for example AI Centres for Doctoral Training, and investments funded via additional government programmes such as the NPIF.
A peak around 2017 to 2018 and 2018 to 2019 is visible across several councils, with most councils showing moderate fluctuations over time and EPSRC numbers generally reducing.
Additional context for figure 3
The first year shown in figure 3, 2015 to 2016, represents the historic peak in EPSRC student starts, following growth from around 2,500 starts in 2012 to 2013. This peak in capacity was linked to the 2013 Centres for Doctoral Training (CDTs), which increased student numbers through additional partner co‑investment from higher education institutions (HEIs), industry and government.
While co‑investment remains an important feature of CDTs, considerations of financial sustainability across the HEI sector meant that this uplift in capacity was not maintained in the 2018 CDT cohort.
The 2023 CDTs are expected to support similar overall student numbers to the 2018 cohort. However, profiling effects meant that only 42 of the 65 funded CDTs recruited for the 2024 to 2025 intake leading to a temporary dip in numbers of students supported. Some centres are also operating ramped recruitment profiles, with lower numbers in 2024 to 2025 expected to be offset by higher recruitment in subsequent years.
UKRI-supported studentship stock by research council
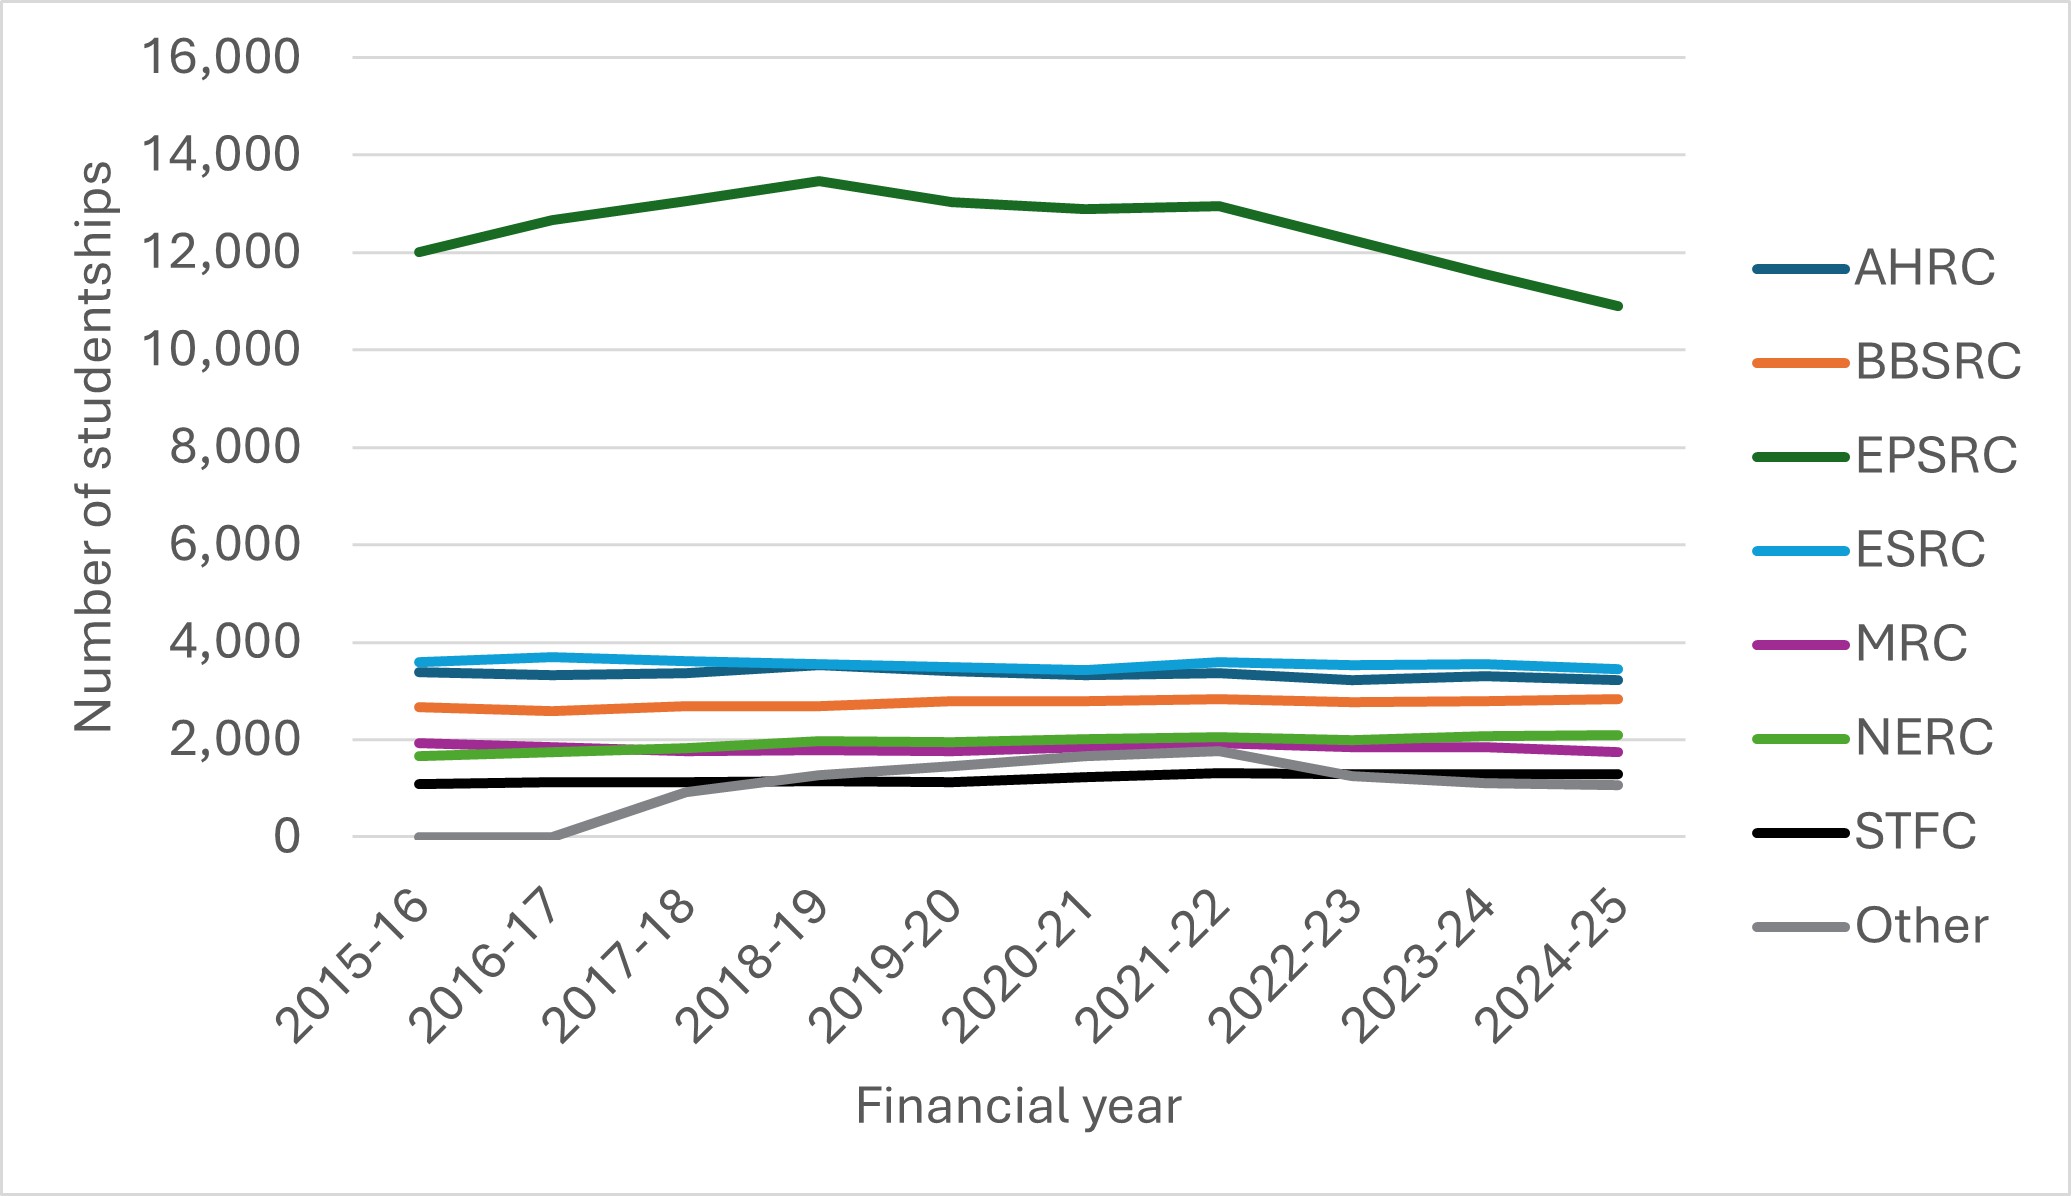
Figure 4: UKRI-supported studentship stock by research council between the financial years 2015 to 2025
Description of figure 4
This figure shows the number of UKRI-supported studentships active between the financial years 2015 to 2025 by research council. Each line represents a different council, AHRC, BBSRC, EPSRC, ESRC, MRC, NERC, STFC and ‘other’.
The category ‘other’ includes cross‑council programmes, for example AI Centres for Doctoral Training, and investments funded through additional government programmes, such as NPIF.
Except for EPSRC, supporting over 10,000 students per year, the number of students supported by each council remains below 4,000 in every year.
UKRI spend on studentships by research council
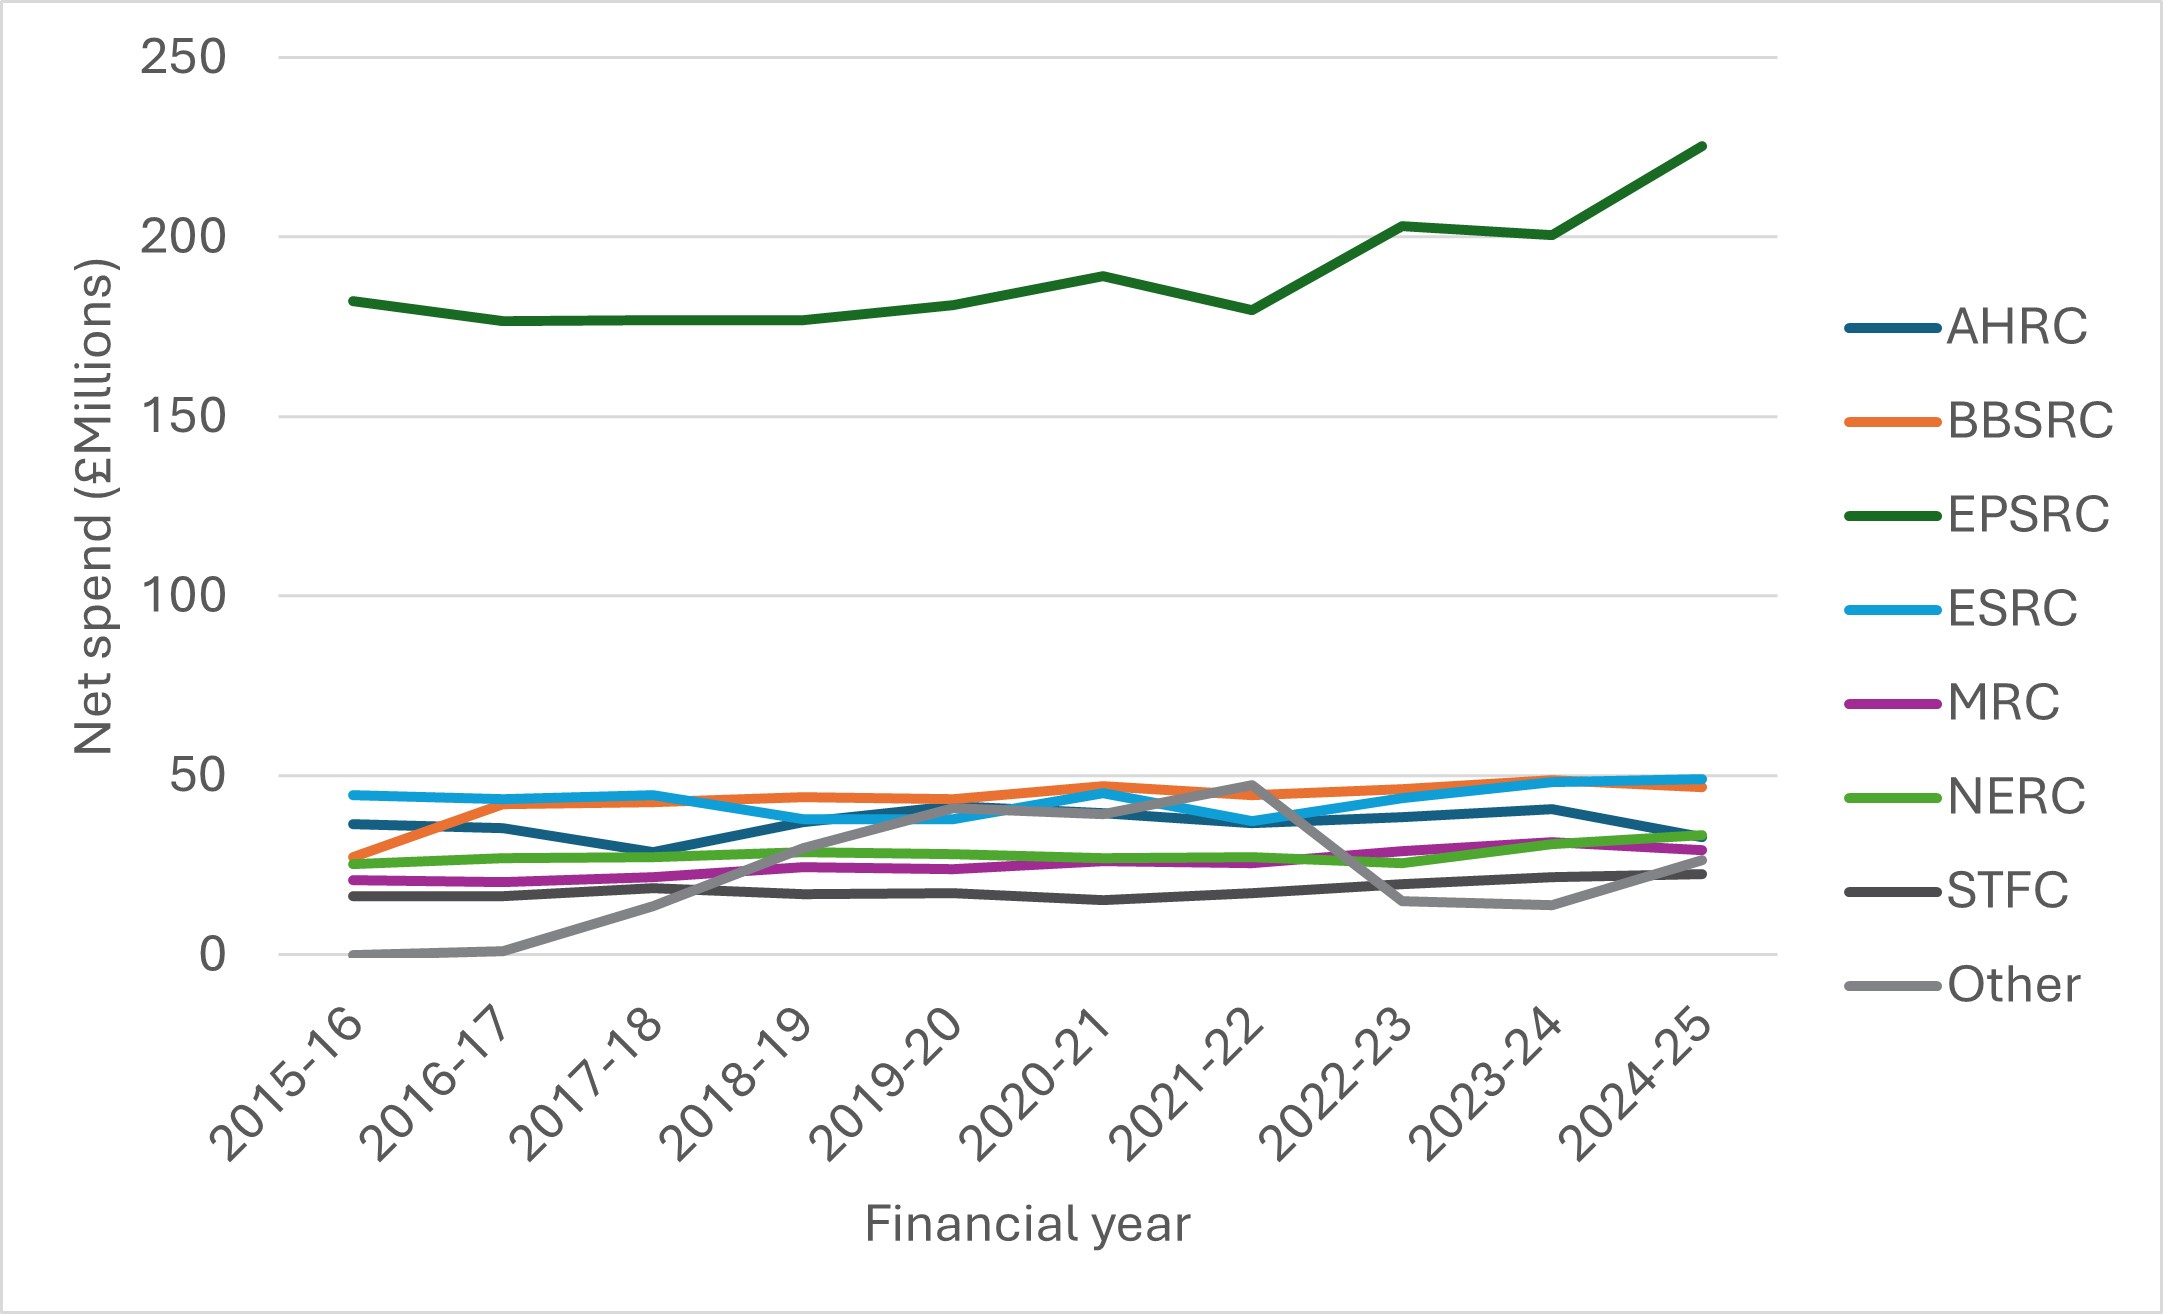
Figure 5: UKRI spend on studentships by research council between the financial years 2015 to 2025
Description of figure 5
This figure shows UKRI net spend on studentships by research council between the financial years 2015 to 2025, measured in millions of pounds sterling. Each line represents a different council, AHRC, BBSRC, EPSRC, ESRC, MRC, NERC, STFC and ‘other’.
The category ‘other’ includes cross‑council programmes, for example AI Centres for Doctoral Training, and investments funded via additional government programmes such as NPIF.
EPSRC spent around £180 million in 2015 to 2016, with increases in recent years leading to spend of £225 million in 2024 to 2025. Spending across the other councils is lower, generally ranging between £20 million and £50 million per year.
Additional context for figure 5
Doctoral investment cycles and the balance between different award types varies across councils and so some fluctuation in student starts and stock is to be expected. The spend indicated is by UKRI only, with the studentship starts and stocks including co-investment from partners, which increases the numbers of students supported.
Fellowships starts, stock and spend by funder
UKRI-funded fellowships starts by research council and total UKRI
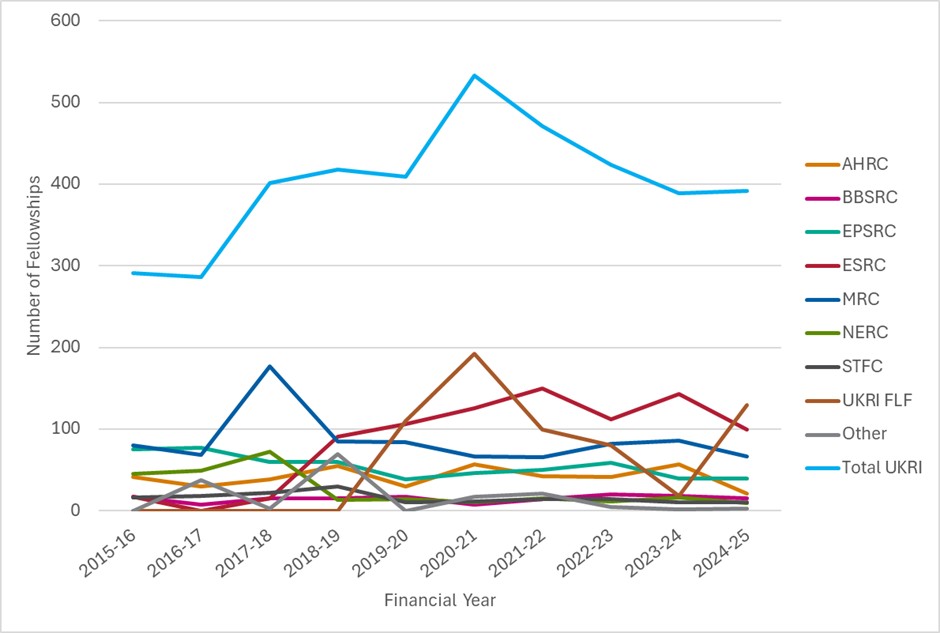
Figure 6: UKRI-funded fellowships starts by research council and total UKRI between the financial years 2015 to 2025
Description of figure 6
This figure shows the number of UKRI-funded fellowships starts between the financial years 2015 to 2016 and 2024 to 2025 by research council and in aggregate. Each line represents a different council, AHRC, BBSRC, EPSRC, ESRC, MRC, NERC, STFC, alongside ‘other’, UKRI Future Leaders Fellowships (FLF), and a total UKRI line.
The category ‘other’ includes investments delivered cross-council, such as UKRI Innovation Fellowships, Stephen Hawking Fellowships and Turing AI Fellowships.
UKRI supported 392 new fellows in 2024 to 2025, an increase from 291 in financial year 2015 to 2016. This is largely due to increases in the number of fellowships funded by ESRC and the introduction of UKRI Future Leaders Fellowships.
Additional context for figure 6
The fellowship numbers provided include fellowships delivered under collective talent and those delivered as part of strategic programmes.
Each fellowship scheme is aligned to one of the three distinct purposes set out in our fellowships investment framework so will either provide support for career transitions, capacity building or sector transitions. Our current fellowship schemes vary in length from one to seven years, with relevance to different career stages varying by scheme.
Fellowship schemes are regularly reviewed to ensure they address need, and so fellowship starts and stock are expected to fluctuate. There is also some variation in annual starts due to this and the timing of funding opportunities sometimes resulting in starts slipping to the next financial year.
Over the current Spending Review period, UKRI will broadly be maintaining overall fellowship capability with growth in targeted areas including Policy Fellowships and Enterprise Fellowships. AHRC incorporated fellowships within their responsive mode portfolios in 2023 to better reflect their purpose.
In future years EPSRC will only run fellowships in targeted areas such as mathematical sciences, quantum technologies and AI to enable funding previously allocated to fellowships to be used to fund other activities in curiosity-driven research. This is likely to support more postdoctoral and other early career researchers.
UKRI-funded fellowships stock by research council and total UKRI
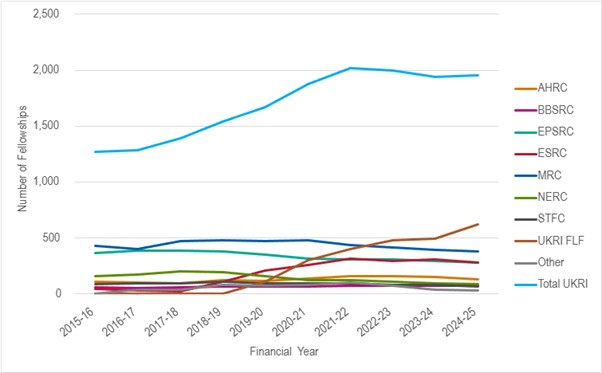
Figure 7: UKRI-funded fellowships stock by research council and total UKRI between the financial years 2015 to 2016 and 2024 to 2025
Description of figure 7
This figure shows the number of UKRI-funded fellowships active between the financial years 2015 to 2016 and 2024 to 2025 by research council and in aggregate. Each line represents a different council, AHRC, BBSRC, EPSRC, ESRC, MRC, NERC, STFC, alongside ‘other’, UKRI Future Leaders Fellowships (FLF) and a total UKRI line.
The category ‘other’ includes investments delivered cross-council such as UKRI Innovation Fellowships, Stephen Hawking Fellowships and Turing AI Fellowships.
The total number of active UKRI fellowships increases steadily from 1,268 in 2015 to 2016 to a peak of 2,017 in 2021 to 2022, reducing to 1,955 by 2024 to 2025.
Additional context for figure 7
The increases to stock are largely because of increases in fellowship stocks for ESRC, which are mostly short one-year fellowships, plus NPIF Fellowships and UKRI FLFs. Covid grant extensions also had an impact on stock in 2020 to 2021 and 2021 to 2022.
UKRI FLFs launched with funding from NPIF in 2018 to address a key early career pinch point, with initial funding supporting two cohorts a year to boost capacity. To ensure a sustainable footing across our portfolio, UKRI now funds one cohort per year as business as usual.
As a result, stock numbers in 2024 to 2025 were starting to reach their peak but will decrease in future years as the fellows funded through the earlier rounds start finishing their seven years of funding. UKRI has committed more than £885 million of funding to 709 fellows across nine rounds of the scheme to date.
UKRI spend on fellowships by research council and total UKRI
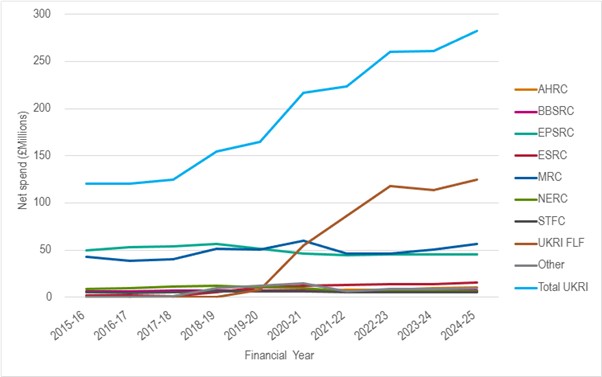
Figure 8: UKRI spend on fellowships by research council and total UKRI between the financial years 2015 to 2025
Description of figure 8
This figure shows UKRI net spend on fellowships between the financial years 2015 to 2016 and 2024 to 2025 by research council and in aggregate. Each line represents a different council, AHRC, BBSRC, EPSRC, ESRC, MRC, NERC, STFC, alongside ‘other’, UKRI FLF and a total UKRI line.
The category ‘other’ includes investments delivered cross-council such as UKRI Innovation Fellowships, Stephen Hawking Fellowships and Turing AI Fellowships.
Total UKRI spending on fellowships increases steadily over the period, rising from £120 million in 2015 to 2016 to £282 million in 2024 to 2025. This overall increase is largely driven by the introduction of the FLF scheme with a spend of £125 million by 2024 to 2025, the largest component spend of UKRI’s fellowship investments.
Among the individual research councils, MRC and EPSRC account for the highest levels of spend, each fluctuating between around £38 million and £56 million. Other councils, including AHRC, BBSRC, ESRC, NERC and STFC, account for smaller shares of total spending, below £15 million per year.
Postdoctoral research assistants
A minority of UKRI fellowships target support to the immediate postdoctoral stage in reflection of support provided by other funders including the National Academies and opportunities provided through Horizon Europe.
UKRI supports a large postdoctoral workforce through our grants, around 16,000 full-time equivalent per year. The data will be updated with additional graphs or tables similar to those for studentships and fellowships when available, noting that this will involve proxies for mapping postdoctoral research assistants to funding system roles.
Data tables
Table 1: Annual doctoral student starts and total student stock by HESA reporting years from 2015 to 2025, disaggregated into UKRI-funded and non-UKRI-funded students. ‘Starts’ refers to new student commencements within each financial year, while ‘stock’ refers to the total number of active students in the system during that year.
| Studentships by HESA reporting year | 2015-16 | 2016-17 | 2017-18 | 2018-19 | 2019-20 | 2020-21 | 2021-22 | 2022-23 | 2023-24 | 2024-25 |
|---|---|---|---|---|---|---|---|---|---|---|
| UKRI starts | 5,725 | 5,900 | 6,690 | 6,305 | 5,665 | 5,620 | 5,545 | 5,240 | 5,345 | 5,115 |
| Non-UKRI starts | 22,040 | 22,575 | 22,805 | 24,895 | 23,385 | 25,235 | 23,125 | 22,710 | 24,050 | 24,330 |
| Total student starts | 27,765 | 28,475 | 29,495 | 31,200 | 29,050 | 30,855 | 28,670 | 27,950 | 29,395 | 29,445 |
| UKRI % of total starts | 21% | 21% | 23% | 20% | 20% | 18% | 19% | 19% | 18% | 17% |
| UKRI stock | 27,315 | 28,465 | 30,115 | 30,960 | 31,080 | 31,380 | 31,850 | 30,910 | 30,250 | 29,265 |
| Non-UKRI stock | 119,270 | 121,455 | 122,575 | 122,850 | 122,740 | 125,925 | 128,190 | 129,450 | 130,835 | 130,375 |
| Total student stock | 146,585 | 149,920 | 152,690 | 153,810 | 153,820 | 157,305 | 160,040 | 160,360 | 161,085 | 159,640 |
| UKRI % of total stock | 19% | 19% | 20% | 20% | 20% | 20% | 20% | 19% | 19% | 18% |
Table 2: Annual UKRI-funded studentships by research council and financial years, from 2015 to 2025. ‘Starts’ refers to new studentships commencing within each financial year, ‘active’ refers to the total number of ongoing studentships supported during the year, and ‘spend’ represents annual expenditure on studentships in millions of pounds sterling (£m).
Data is presented for the seven UKRI research councils, AHRC, BBSRC, EPSRC, ESRC, MRC, NERC and STFC, as well as a residual ‘other’ category and total UKRI-funded activity.
| Studentships (by Financial Year) | 2015-16 | 2016-17 | 2017-18 | 2018-19 | 2019-20 | 2020-21 | 2021-22 | 2022-23 | 2023-24 | 2024-25 |
|---|---|---|---|---|---|---|---|---|---|---|
| AHRC starts | 863 | 834 | 864 | 988 | 691 | 697 | 680 | 693 | 639 | 645 |
| AHRC active | 3,392 | 3,334 | 3,368 | 3,539 | 3,413 | 3,321 | 3,359 | 3,229 | 3,309 | 3,225 |
| AHRC spend (£m) | 36.5 | 35.3 | 28.7 | 37.1 | 41.6 | 39.5 | 36.8 | 38.5 | 40.6 | 32.8 |
| BBSRC starts | 594 | 552 | 632 | 520 | 617 | 568 | 525 | 562 | 564 | 614 |
| BBSRC active | 2,668 | 2,578 | 2,686 | 2,687 | 2,795 | 2,796 | 2,832 | 2,779 | 2,798 | 2,839 |
| BBSRC spend (£m) | 27.3 | 42.1 | 42.7 | 44 | 43.5 | 47.1 | 44.5 | 46.3 | 48.7 | 46.7 |
| EPSRC starts | 3,210 | 3,121 | 2,966 | 3,075 | 2,589 | 2,611 | 2,621 | 2,339 | 2,334 | 1,992 |
| EPSRC active | 11,999 | 12,656 | 13,054 | 13,457 | 13,027 | 12,895 | 12,950 | 12,246 | 11,546 | 10,895 |
| EPSRC spend (£m) | 182.2 | 176.5 | 176.9 | 176.9 | 181 | 189.2 | 179.6 | 203.2 | 200.5 | 225.3 |
| ESRC starts | 855 | 872 | 749 | 748 | 735 | 717 | 714 | 677 | 732 | 682 |
| ESRC active | 3,585 | 3,687 | 3,620 | 3,556 | 3,488 | 3,437 | 3,588 | 3,533 | 3,553 | 3,457 |
| ESRC spend (£m) | 44.5 | 43.5 | 44.6 | 37.9 | 37.7 | 45.2 | 37.4 | 43.8 | 48.2 | 49 |
| MRC starts | 449 | 385 | 418 | 437 | 403 | 397 | 363 | 369 | 393 | 353 |
| MRC active | 1,931 | 1,855 | 1,760 | 1,777 | 1,770 | 1,846 | 1,921 | 1,855 | 1,841 | 1,741 |
| MRC spend (£m) | 21 | 20.4 | 21.7 | 24.4 | 24 | 26.3 | 25.7 | 28.9 | 31.6 | 29.2 |
| NERC starts | 435 | 434 | 464 | 448 | 401 | 378 | 371 | 410 | 522 | 463 |
| NERC active | 1,658 | 1,748 | 1,825 | 1,978 | 1,959 | 2,010 | 2,043 | 1,993 | 2,072 | 2,085 |
| NERC spend (£m) | 25.2 | 27.1 | 27.4 | 28.8 | 28 | 26.9 | 27.2 | 25.6 | 30.8 | 33.5 |
| STFC starts | 269 | 281 | 280 | 287 | 283 | 295 | 285 | 304 | 295 | 325 |
| STFC active | 1,087 | 1,128 | 1,127 | 1,140 | 1,136 | 1,237 | 1,310 | 1,299 | 1,289 | 1,291 |
| STFC spend (£m) | 16.4 | 16.5 | 18.8 | 17 | 17.2 | 15.4 | 17.3 | 19.9 | 21.8 | 22.6 |
| Other starts | 5 | 1 | 914 | 364 | 219 | 261 | 210 | 208 | 230 | 148 |
| Other active | 6 | 7 | 921 | 1,275 | 1,451 | 1,664 | 1,759 | 1,248 | 1,105 | 1,062 |
| Other spend (£m) | 0 | 1.1 | 13.6 | 29.9 | 41 | 39.4 | 47.2 | 15 | 14 | 26.6 |
| All UKRI starts | 6,680 | 6,480 | 7,287 | 6,867 | 5,938 | 5,924 | 5,769 | 5,562 | 5,709 | 5,222 |
| All UKRI active | 26,326 | 26,993 | 28,361 | 29,409 | 29,039 | 29,206 | 29,762 | 28,182 | 27,513 | 26,595 |
| All UKRI spend (£m) | 353.3 | 362.5 | 374.4 | 396 | 414 | 429 | 415.7 | 421.1 | 436.2 | 465.5 |
Table 3: Annual UKRI-funded fellowships by research council and financial year, from 2015 to 2025. ‘Starts’ refers to new fellowships commencing within each financial year, ‘active’ refers to the total number of ongoing fellowships supported during the year, and ‘spend’ represents annual expenditure on fellowships in millions of pounds sterling (£m).
Data are presented for the seven UKRI research councils, AHRC, BBSRC, EPSRC, ESRC, MRC, NERC and STFC, as well as a residual ‘other’ category and total UKRI-funded activity.
| Fellowships (by financial year) | 2015-16 | 2016-17 | 2017-18 | 2018-19 | 2019-20 | 2020-21 | 2021-22 | 2022-23 | 2023-24 | 2024-25 |
|---|---|---|---|---|---|---|---|---|---|---|
| AHRC starts | 41 | 30 | 38 | 55 | 30 | 57 | 42 | 41 | 57 | 21 |
| AHRC active | 108 | 100 | 98 | 124 | 120 | 139 | 157 | 161 | 154 | 133 |
| AHRC spend (£m) | 5.6 | 5.3 | 5.3 | 6.0 | 6.8 | 6.1 | 8.4 | 8.0 | 9.3 | 10.2 |
| BBSRC starts | 17 | 7 | 15 | 15 | 17 | 7 | 14 | 20 | 18 | 15 |
| BBSRC active | 62 | 56 | 63 | 67 | 68 | 69 | 72 | 74 | 76 | 75 |
| BBSRC spend (£m) | 6.3 | 6.2 | 7.2 | 7.4 | 7.2 | 7.2 | 6.3 | 6.3 | 7.1 | 7.5 |
| EPSRC starts | 75 | 77 | 60 | 60 | 38 | 46 | 50 | 59 | 39 | 39 |
| EPSRC active | 367 | 386 | 385 | 381 | 349 | 317 | 307 | 307 | 295 | 283 |
| EPSRC spend (£m) | 49.5 | 53.1 | 53.8 | 56.9 | 51.7 | 46.5 | 44.9 | 45.6 | 45.6 | 45.5 |
| ESRC starts | 17 | 0 | 15 | 91 | 106 | 126 | 150 | 112 | 143 | 99 |
| ESRC active | 48 | 29 | 28 | 108 | 212 | 260 | 315 | 299 | 311 | 279 |
| ESRC spend (£m) | 2.4 | 2.4 | 0.9 | 5.4 | 10.9 | 12.3 | 13.2 | 14.0 | 14.1 | 15.9 |
| MRC starts | 80 | 68 | 177 | 85 | 84 | 67 | 66 | 82 | 86 | 67 |
| MRC active | 433 | 404 | 477 | 479 | 476 | 480 | 441 | 414 | 397 | 379 |
| MRC spend (£m) | 42.7 | 38.7 | 40.1 | 51.2 | 50.8 | 59.7 | 46.2 | 46.6 | 50.3 | 56.6 |
| NERC starts | 45 | 49 | 72 | 13 | 14 | 10 | 15 | 11 | 16 | 9 |
| NERC active | 160 | 177 | 205 | 194 | 161 | 126 | 124 | 110 | 97 | 86 |
| NERC spend (£m) | 8.8 | 9.7 | 11.6 | 12.3 | 10.6 | 9.5 | 6.6 | 6.7 | 7.0 | 6.5 |
| STFC starts | 16 | 18 | 22 | 30 | 10 | 11 | 14 | 14 | 10 | 10 |
| STFC active | 90 | 93 | 96 | 107 | 98 | 96 | 95 | 85 | 80 | 67 |
| STFC spend (£m) | 5.0 | 4.7 | 5.2 | 6.0 | 6.3 | 6.5 | 5.4 | 5.5 | 5.3 | 5.6 |
| UKRI FLF starts | 0 | 0 | 0 | 0 | 110 | 192 | 99 | 80 | 18 | 129 |
| UKRI FLF stock | 0 | 0 | 0 | 0 | 110 | 302 | 401 | 478 | 493 | 621 |
| UKRI FLF spend (£m) | 0.0 | 0.0 | 0.0 | 0.3 | 8.2 | 55.0 | 86.3 | 118.4 | 113.6 | 125.2 |
| Other starts | 0 | 37 | 3 | 69 | 0 | 17 | 21 | 5 | 2 | 3 |
| Other stock | 0 | 37 | 40 | 79 | 75 | 84 | 105 | 73 | 37 | 32 |
| Other spend (£m) | 0.0 | 0.4 | 0.8 | 9.4 | 12.5 | 14.5 | 6.6 | 9.1 | 8.7 | 9.7 |
| Total UKRI starts | 291 | 286 | 402 | 418 | 409 | 533 | 471 | 424 | 389 | 392 |
| Total UKRI stock | 1,268 | 1,282 | 1,392 | 1,539 | 1,669 | 1,873 | 2,017 | 2,001 | 1,940 | 1,955 |
| Total UKRI spend (£m) | 120.3 | 120.5 | 125.0 | 154.9 | 165.1 | 217.2 | 223.9 | 260.1 | 261.1 | 282.7 |
Data quality statement
This data quality statement provides information about the accuracy, reliability and completeness of the data published in this report.
UKRI data is based on the 2 April 2026 snapshot of Databank, which is the UKRI central repository of administrative data. Administrative data is information gathered primarily for operational purposes, such as managing applications or distributing funding. This means that there are inherent limitations on accuracy, reliability and completeness which should be considered when interpreting figures.
The HESA data used in this analysis is drawn from the HESA 2024 to 2025 student collection, with UKRI conducting all subsequent analysis.
The data presented in this publication can be split into three subsets:
- UKRI-funded studentship and fellowship starts and stock split by financial year and funder
- UKRI and HESA studentship starts and stock by HESA reporting year
- UKRI spend on training grants and fellowships split by financial year and funder
In scope is data included in the financial years from 2015 to 2025 and HESA reporting years from 2015 to 2025. A financial year is defined as running from 1 April to 31 March. HESA reporting year is defined as running from 1 August to 31 July.
UKRI-administered studentships and fellowships funded by research councils and cross-council programmes are also in scope. The funder is the budget holder of the training grant associated with the studentship or of the research grant associated to the fellowship.
Spend on awards under the ‘studentship’, ‘training grant’ or ‘fellowship’ application category are in scope.
Out of scope are:
- UKRI-administered studentships funded by NC3Rs
- UKRI-administered fellowships funded by NC3Rs and Horizon Europe Guarantee
- spend on studentships or fellowships outside the ‘studentship’, ‘training grant’ or ‘fellowship’ application category
Over the period covered by this report, there have been changes in systems, reporting practices and classification approaches. This includes the move to collective talent funding, which brought most talent investments into a single budget line, and the introduction of the doctoral and fellowship investment frameworks.
While this report captures the majority of talent investments, some historic talent awards were recorded under earlier portfolio structures or classifications and therefore fall outside its scope. The new frameworks and the transition to collective talent funding will provide greater consistency and comparability in future reporting, but this consistency cannot be fully applied retrospectively.
Definitions of UKRI start and stock counts
Starts count UKRI-funded studentships or fellowships with a start date in the relevant year. A start date for a studentship is the start of the funding provision for that studentship, and the start of a fellowship is the start date of the fellowship grant.
Stock counts include all studentships or fellowships that are within their active period at any point during the year. That is, any studentship or fellowship whose duration between its recorded start and end dates overlaps with the reporting year.
UKRI studentship counts
A studentship is the provision of funding for postgraduate research where the funding was provided by UKRI to a research organisation.
Data is entered by training grant holders at research organisations and collected by UKRI’s studentship portal. This is used to count the number of studentships.
Data processing steps
The following additional steps were taken after extracting data from the UKRI internal database.
Modification of clearly erroneous dates
Studentships that have start dates on the same date or after the end date were modified to use their registration appointment date as a start date. Due to this, 161 records were changed.
Processing of terminated studentships
Where the termination date is before the end date, the termination date is used. This affects 2,701 records.
De-duplication by person
Where the data shows multiple concurrent studentships for a person, these are not counted as separate studentships in this report. This can occur in our records due to various administrative reasons such as studentships spread over a series of annual training grants or studentships linked to both a main training grant and a further training grant. This affects 1,014 studentship records.
De-duplication of studentship references
Where a studentship reference is duplicated in the database due to being linked to multiple research councils, the record linked to the research council that is the main funder of the studentship is kept. This affects 244 records.
After these processing steps, over 10 financial years, a total of 81,084 studentships are included in this report.
Studentships in the ‘other’ category include studentships that are identified as funded by NPIF Industrial Strategy Challenge Fund (ISCF) or from cross-council funds.
UKRI fellowship counts
Fellowships are prestigious funding awards for individuals to enable challenging transitions or targeted capability development. Not all funding schemes historically labelled as fellowships and covered under this report meet the harmonised definitions set out in the newly launched UKRI fellowships investment framework.
Handling of fellowship transfers and renewals
A fellowship transfer can happen when an active fellowship moves from one host organisation to another, usually because the fellow changes institution. Some programmes also have competitively assessed renewals that extend an existing fellowship.
Renewals and transfers were not counted as new starts but were counted as active fellowships. There are 450 transfers and 175 renewals within the dataset coverage.
Over 10 financial years, 6,219 fellowship grants were in scope for this report.
Fellowships in the ‘other’ category include fellowships that are identified as funded by ISCF, National Core Studies COVID-19 BIG DATA, Global Challenges Research Fund or from cross-council funds.
Spend
UKRI does not track spend on individual studentships. Studentships are funded via block funding of training grants that providers use to recruit doctoral students. Studentship spending was calculated as the sum of the spend on training grants for that financial year. For studentships spend data, values in the ‘other’ group include spend on COVID-19 doctoral extensions.
Spend on fellowships is calculated as the aggregated direct expenditure on awards classified under the ‘fellowship’ application category within the relevant financial year, sourced from UKRI’s grant management system. Spend data for the April Databank of UKRI’s grant snapshot does not contain a complete set of spend records. Therefore, to provide a more accurate estimate of expenditure, the January Databank snapshot was used where it contained a higher amount of recorded spend.
Studentships by HESA reporting year
In addition to UKRI data, this report uses data from HESA to report on students outside UKRI funding. This data is split by HESA reporting year.
For the comparison with HESA data, UKRI students were identified by matching the UKRI studentship record to the HESA record using unique identifiers within UKRI and HESA databases plus exact and probabilistic matching on name, provider, date of birth and gender.
This process identifies 99% of UKRI‑funded students in HESA data for all years up to and including HESA reporting year 2023 to 2024. For reporting year 2024 to 2025, the match rate falls to 97%, reflecting a temporary reporting lag between when students are registered in UKRI’s systems and when they appear in HESA’s database. Only students for which a UKRI record was matched to the HESA record were in scope, meaning our report has a 1% to 3% undercount of student starts and stock.
In addition, studentship starts in the HESA reporting year 2024 to 2025 may be affected by the transition from the old to the new studentship portal. Until the data from the new Studentship Data Portal is fully processed and incorporated into the UKRI database, the data will be unavailable for analysis. This issue is expected to be resolved in future publications.
The total UK student counts were generated by filtering the HESA student population with the following:
- session population marker which indicates whether an engagement is included in the HESA higher education session population for the reporting cycle (Z_POPSES_CYC = 1)
- individuals identified as UKRI-funded or classified as doctoral research students (QUALCAT = D003)
All numbers from the HESA database have undergone HESA’s rounding and suppression rules, meaning that all the numbers have been rounded to the nearest five. The percentages are based on unrounded numbers.