
Publishing diversity data
UKRI publishes annual diversity data on applicants and grant award holders to aid transparency in our funding and enable high-level monitoring of trends. This report provides data for the 2020 to 2021 financial year and adds to our previous publications providing diversity data and detailed ethnicity analysis for the 2019 to 2020 financial year.
The report primarily presents a high-level annual overview of our diversity data at UKRI level.
Interpreting our diversity data is complex, however, as it is based upon thousands of applications to hundreds of funding opportunities administered by UKRI’s 7 constituent research councils. Annual changes in the types of funding opportunity that are launched, or external factors such as the COVID-19 pandemic, impact upon our data and the interpretation of trends over time.
Where possible, data for individual research councils is provided in the accompanying data tables. Figures from analysis at council level, funding stream level or funding opportunity level are also discussed where they can inform our understanding of UKRI-level trends. Building this more detailed understanding is vital to support priority 6.2 (make UKRI an efficient, effective and agile organisation) of our 5-year strategy, published in March 2022, which focused on strengthening our insights and analyses to inform how we act.
Key findings
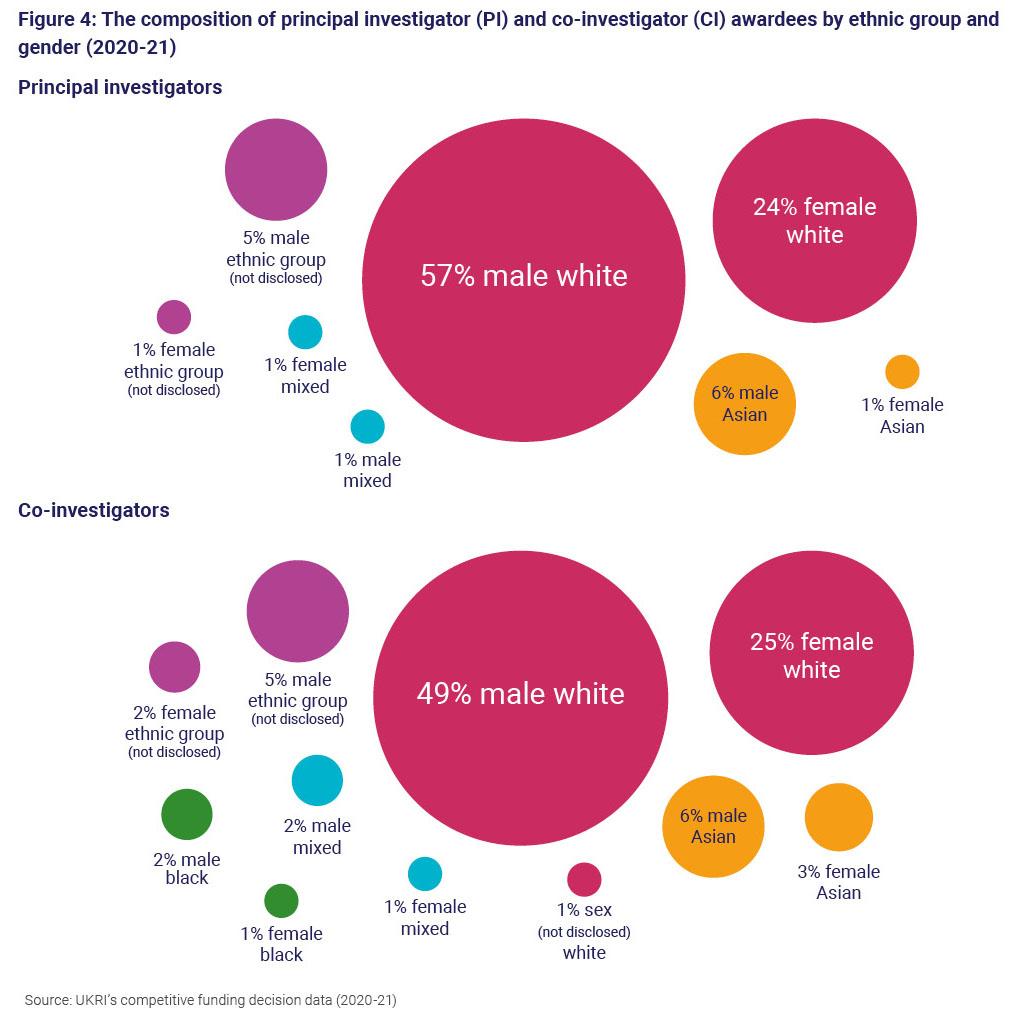
1. For the first time, data on the intersection of age, ethnicity, and disability with gender is included. Breakdowns by gender and ethnicity show that white males received the largest percentage of awards as both principal investigators and co-investigators, receiving 57% of principal investigator awards and 49% of co-investigator awards.
2. Representation of female grant holders overall was 28% for principal investigators and 33% for co-investigators. For both role types, this is below one benchmark (constructed from Higher Education Statistics Agency (HESA) data) for the wider UK academic population, at 42%. For fellows, representation of female grant holders was above this benchmark, at 49%.
3. After the White ethnic group at 81%, the highest percentage of principal investigator grant holders was from the Asian ethnic group, at 8%. The percentages of principal investigator grant holders from the Black, Mixed, and other ethnic groups were lower, at 1%, 2% and less than 0.5% respectively.
4. The award rate for principal investigators was lowest for the Black and other ethnic groups at 13% and 12% respectively. This compares with award rates of 29% for the White ethnic group, 23% for the Mixed ethnic group and 21% for the Asian ethnic group.
5. The percentage of principal investigator and co-investigator grant holders reporting a known disability remains low, at 2%. This is below benchmarks for wider academic staff at 4% and the wider labour market (employed) population, at 13%.
6. Disability status was not disclosed for 6% of principal investigator grant holders and 6% of co-investigator grant holders. Ethnicity was not disclosed for 8% of principal investigator grant holders and 9% of co-investigator grant holders. Further investigation is needed to understand why there are higher levels of non-disclosure for disability and ethnicity than for the other legally protected characteristics, and the impact that this has on our data.
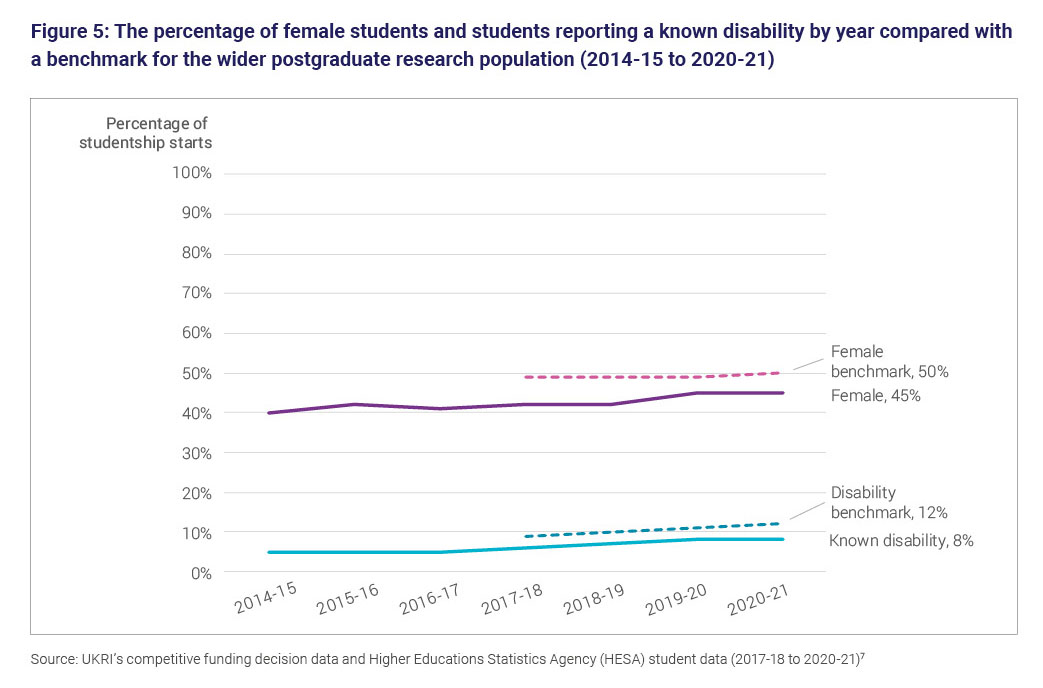
7. Among UKRI’s funded postgraduate research students, representation of female students and students reporting a disability is below HESA benchmarks for the wider postgraduate research student population. 45% of UKRI studentship starts were female compared with a benchmark of 50%, and 8% reported a disability compared with a benchmark of 12%. A high level of ‘non-disclosure’ or ‘unknown’ for ethnicity remains for UKRI-funded studentship starts, at 32%.
Introduction
We are committed to publishing diversity data on applications and awards relating to 4 diversity characteristics (age, disability, ethnicity, and gender) annually, as part of our business-as-usual activities.
The data is broken down by role type (principal investigators, co-investigators, fellows and by studentship starts), and the data covers 7 financial years (2014 to 15 to 2020 to 2021). Discussion within this report is primarily focused on data for the latest financial year.
Developing the capability to explore trends over time is an important next step in improving our analysis.
We publish this data to aid transparency in our funding and enable high-level monitoring of trends. For 2020 to 2021, the data continues to reveal underrepresentation of females, ethnic minority groups and individuals with a declared disability when compared to a benchmark for the UK academic community and the UK workforce.
We are using this data, together with other evidence, and engagement with the research and innovation community to support priority 6.2 of our 5-year strategy published in March 2022. This priority aims to strength our insights and analyses to inform how we act, drawing on the breadth and depth of our expertise to respond to the rapidly changing research and innovation landscape.
External benchmark data is used to provide context and comparison to our diversity data. We use it to understand how the diversity of our applicants and awardees compares to the make-up of those eligible to apply for our funding, and the wider population.
We have used the latest data available from Higher Education Statistics Agency (HESA) for the diversity population of the UK higher education institutes (HEIs), and the ONS Labour Force Survey, which provides the percentages of people from each ethnic group who are employed in the UK (see Annex A of the main report for more detail).
It should be noted that neither benchmark is a perfect comparator: some UKRI funding opportunities allow for international applicants or researchers outside of UK HEIs, while student benchmarks for the HESA data are for UK-domiciled students only.
The 2020 to 2021 financial year was unprecedented, with the impact of the COVID-19 pandemic, and so, in many ways, was an atypical year for funding applications.
Our independent process review of UKRI’s response to COVID-19 revealed that we received a substantially larger volume of applications at a much faster pace than normal, with COVID-19 response applications adding around 30% to our typical annual application volume.
Success rates were also impacted, with an award rate of just over 10% for the main COVID-19 response funding opportunities, compared with an overall award rate for UKRI of 21% (although this varies substantially by competition, award type, and council).
Emergency funding opportunities set up as part of our response to COVID-19 are not included in the data in this report. Separate analysis on the diversity profile for these funding opportunities is included in Annex D of the independent process review.
Early analysis of data for UKRI does not indicate substantial changes in the diversity profile of applicants and awardees because of the pandemic. However, further work, including the monitoring of trends in future years, will enable us to understand the impact of the COVID-19 pandemic on funding applicants and awardees more fully.
An impact evaluation for our COVID-19 response is ongoing and will explore to what extent (and how) projects have fostered diverse and inclusive research and innovation environments.
We have started work to understand appropriate methods for estimating statistical significance, to use in future reports.
The impact of council-level differences on UKRI-level data
The aggregate UKRI data used in this report contains a large variation in application numbers, award rates and award amounts by diversity characteristics across UKRI’s funding portfolio, including between research councils.
These reflect differences in process and reporting methods. The variation in award value can be due to the higher consumable and equipment costs that are necessary for some areas of research.
Councils are looking into their data individually, and this substantial evidence base is directly influencing EDI workplans.
The distribution of applicants by number across councils for 2020 to 2021 is:
- Arts and Humanities Research Council (AHRC) 3,850
- Biotechnology and Biological Sciences Research Council (BBSRC) 3,585
- Engineering and Physical Sciences Research Council (EPSRC) 7,150
- Economic and Social Research Council (ESRC) 4,625
- Medical Research Council (MRC) 7,845
- Natural Environment Research Council (NERC) 4,410
- Science and Technology Facilities Council (STFC) 1,170
- pan UKRI (centrally run funding opportunities) 3,305
MRC has the highest number of applicants compared to the other councils and STFC the fewest.
Within this distribution of applicants there are differences in diversity characteristics and application patterns across the 7 research councils. For example, at UKRI level the 40 to 49 age group has the highest proportion of applicants. MRC and EPSRC have a higher number of applicants aged 40 to 49 than the other councils. EPSRC has the highest number of applicants across all age groups, and STFC and pan-UKRI funds have the lowest.
The White ethnic group has the highest number of applicants. STFC and pan-UKRI have the lowest number of applicants in this group, and Asian applicants to EPSRC are higher than both. In terms of gender, AHRC and ESRC have similar numbers of male and female applicants.
In 2020 to 2021, overall award rates for research and innovation grants ranged from 17% at MRC to 72% at STFC. Similarly, median award amounts for principal investigators ranged from approximately £135,250 at AHRC to approximately £593,536 at MRC.
At UKRI level in 2020 to 2021, the median award amount for male principal investigators was approximately £400,000, compared with approximately £300,000 for female principal investigators.
However, the council level data shows that this difference is not consistent across all the councils. At AHRC, BBSRC, EPSRC and NERC, differences in median award amount by gender for principal investigators were smaller than at UKRI level (all the differences were less than £40,000).
Differences were larger at ESRC, MRC and STFC, where the median award amount was higher for male principal investigators than for female principal investigators.
Award rates at UKRI level were also higher for principal investigator males in 2020 to 2021, at 29% compared with 25% for principal investigator females.
However, at council level the picture is mixed. Principal investigator award rates by gender were very similar (within 2 percentage points of each other) at all councils except STFC, where principal investigator females had an award rate 9 percentage points higher than males.
The higher award rate for males at UKRI level is a consequence of a higher percentage of male applicants and awardees at EPSRC and STFC, which are also the 2 councils with the highest award rates.
It is therefore important to consider council-level data alongside UKRI-level data when comparing amounts and award rates between demographic groups.
We advise against using these findings alone to draw causal inferences regarding the relationship between the diversity characteristics and application and award rates. Further analysis is needed to control for the effects of other background factors.
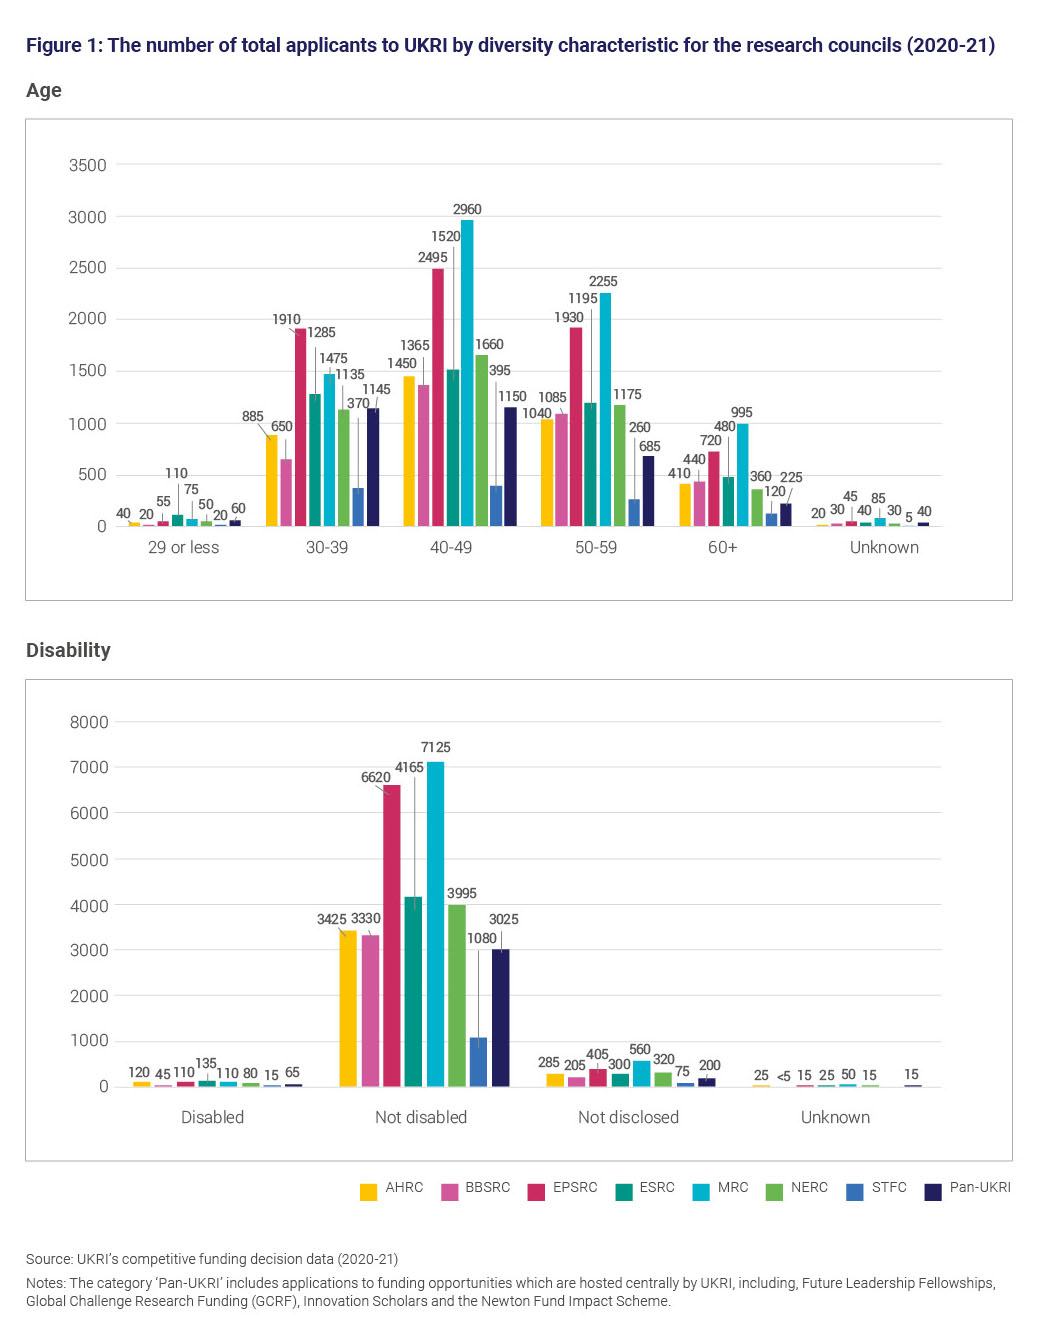
Age
The percentages of applicants and awardees by age categories for principal investigator, co-investigator and fellows are consistent year on year. The largest proportion of applications for principal investigators and co-investigators is in the 40-49 age group, with 38% and 37% respectively, while for fellows the largest representation is in the 30-39 age group with 65%.
Disability
The proportion of both principal investigator and co-investigator applicants reporting a disability in 2020 to 2021 was consistent with the previous year at 2%.
This is below benchmarks for wider academic staff at 5% and the wider labour market (employed) population, at 13%.
Disability status was also ‘unknown’ or ‘not disclosed’ for between 6% and 8% of our applicants and awardees.
This is higher than the level of principal investigator and co-investigator applicant and awardee non-disclosure for age and gender (ranging from 0% to 2%), and higher than non-disclosure for disability in the benchmark HESA data at 3%.
The higher level of non-disclosure compared with other characteristics further complicates interpretation of the data. Further work is needed to understand both the reasons why applicants may choose not to disclose their disability status and the nature of the barriers faced by disabled individuals.
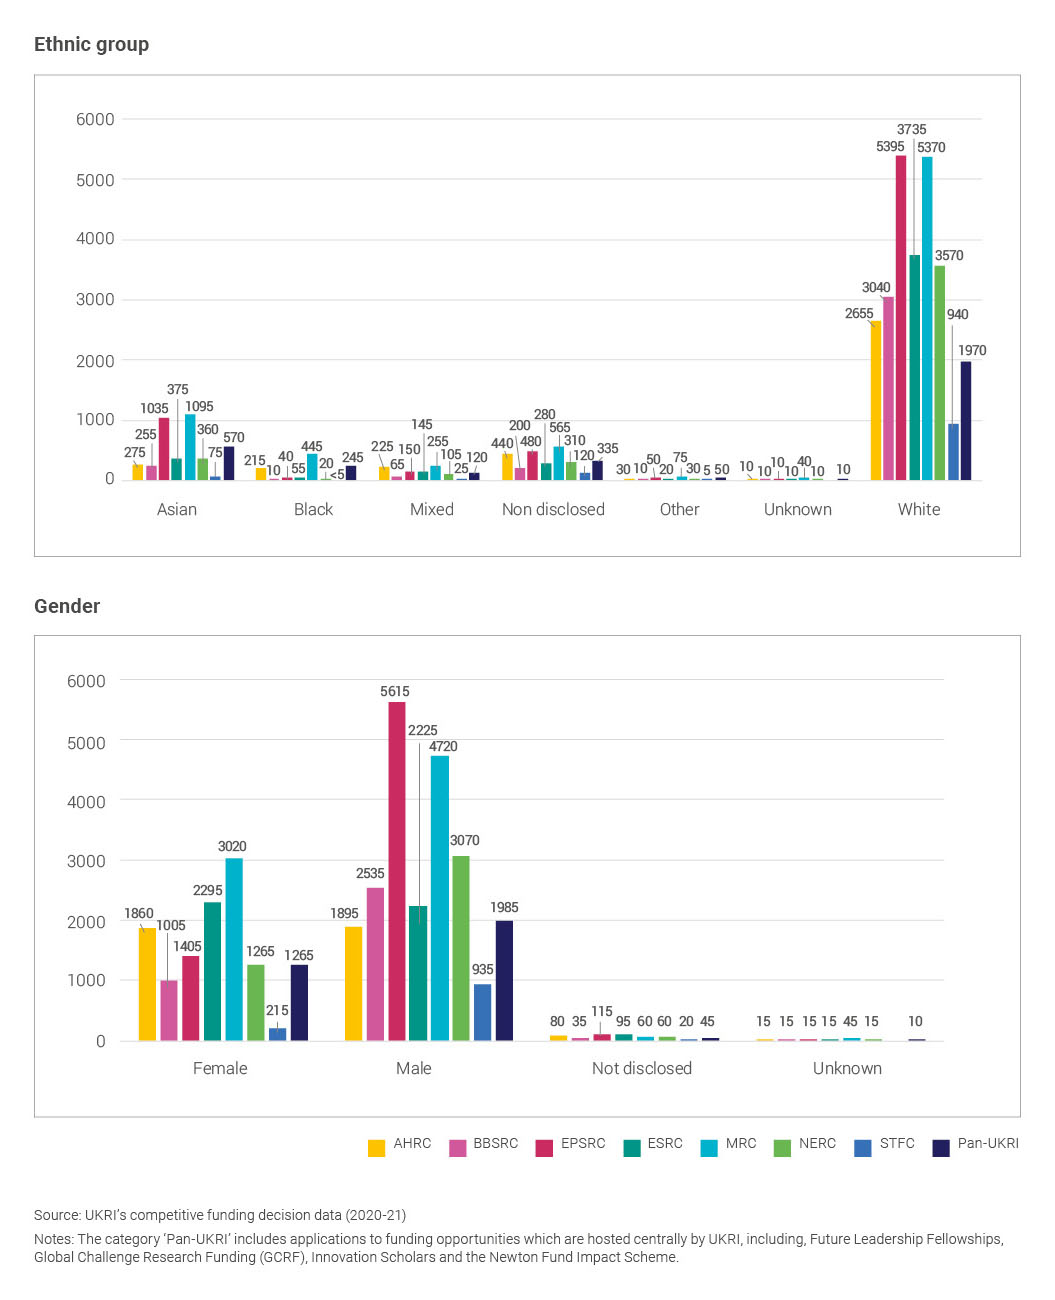
Ethnicity
In this report, we have moved away from using binary ethnicity categories (ethnic minorities and White) and have disaggregated the data by ethnicity as much as possible.
Due to the small number of awards at the level of individual ethnicities, data is primarily presented and discussed for the broad ethnic groups (Asian, Black, Mixed, other, and White).
The breakdown of applicants by ethnic group shows that the White group (at 78%) has the highest percentage, followed by the Asian ethnic group (10%), Black (2%), Mixed (2%), other (1%) and not disclosed (7%).
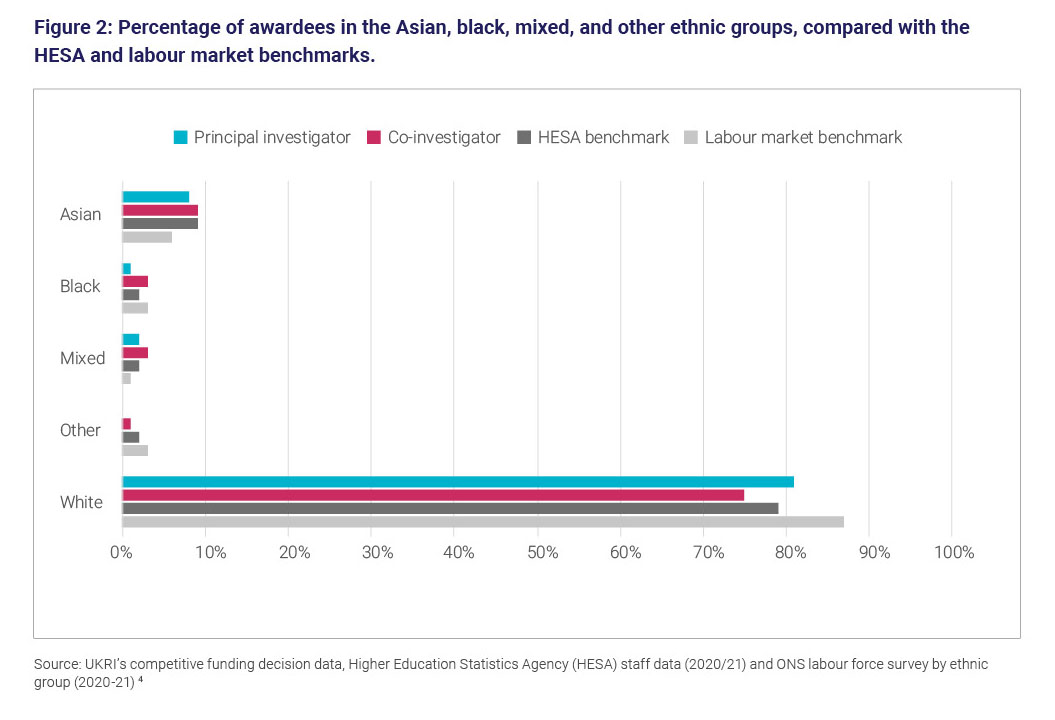
When looking at award rates by number by ethnic group for principal investigators, the White ethnic group had the highest award rate in 2020 to 2021 at 29%, followed by the Mixed ethnic group at 23% and the Asian ethnic group at 21%.
Award rates were lowest for the Black and other ethnic groups, at 13% and 12% respectively.
Differences in award rate by ethnic group were smaller for co-investigators, where the award rate was highest for the White and Black ethnic groups at 29% and 28% respectively, and lowest for the other ethnic group at 21%.
After the White ethnic group, the Asian ethnic group has consistently received the highest percentage of awards for both principal investigators and co-investigators. In 2020 to 2021, 9% of co-investigator awardees and 8% of principal investigator awardees were from the Asian ethnic group.
The White ethnic group is the most prevalent for principal investigators (81%) and co-investigators (75%). This is below the benchmark for the wider labour market (87%) and equivalent to the wider academic population (80%).
The representation of both principal investigators and co-investigators is 3% for the mixed ethnic group, which is higher than the wider labour market (1%) and the wider academic population (2%).
The Back ethnic group is the lowest for principal investigators (1%) and co-investigators (3%), this is the same as the 3% benchmark for the wider labour market and higher than the wider academic population (2%).
Asian co-investigators (9%) is the same as the benchmark for the wider academic population and higher than the wider labour market (6%).
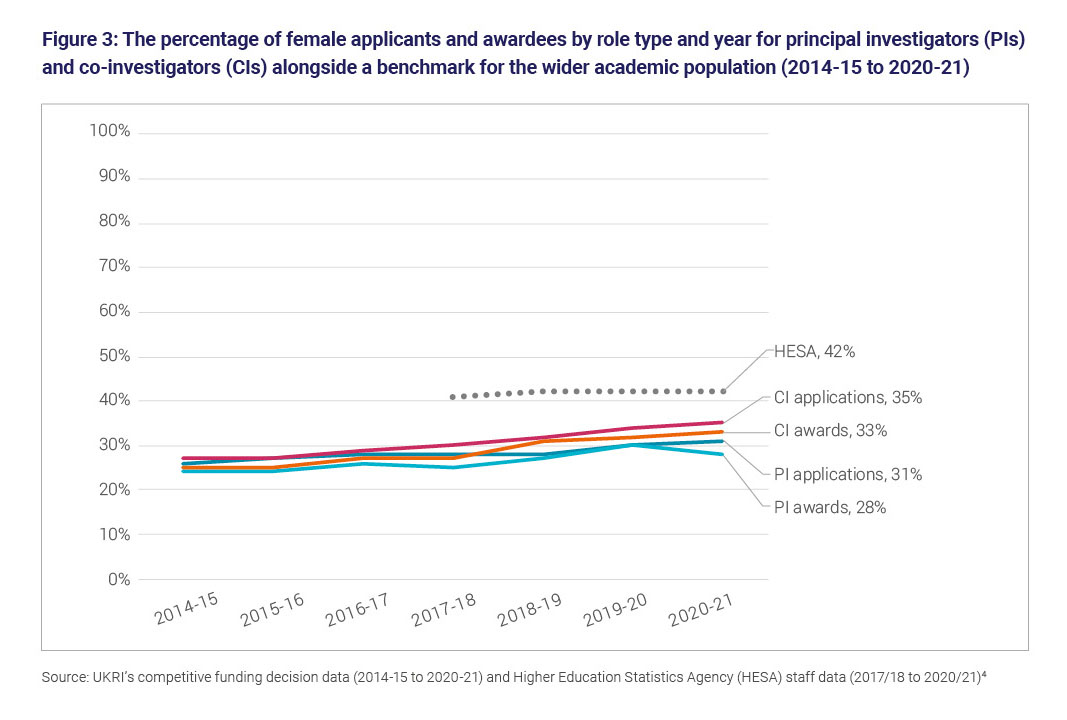
Gender
The percentage of both applicants and awardees reporting their gender as female has increased for the CI role type by 2 percentage points since 2014 to 2015.
For principal investigators there is no obvious trend, and while the percentage of female principal investigator applications has increased (plus 5 percentage points overall), the percentage of female awardees has fluctuated.
Female representation was below a benchmark for the wider academic population in all of the last 4 years.
In 2020 to 2021, female representation within the HESA benchmark was 42%, compared with 33% for co-investigator awards and 28% for principal investigator awards.
Fellows
Due to the low number of UKRI fellows compared with other role types (approximately 525 fellowships were awarded in 2020 to 2021 compared with thousands of awards for principal investigators and co-investigators), outcomes for fellows are more susceptible to year-on-year changes in individual funding opportunities.
One funding opportunity that has a large impact on UKRI’s fellowship data is the ESRC’s postdoctoral fellowship funding opportunity, which accounted for 24% of all UKRI fellowships awarded in 2020 to 2021.
Diversity characteristics of ESRC’s postdoctoral fellows also differ from those of other UKRI fellows, with over 70% being female and 11% reporting a known disability in 2020 to 2021.
This compares with 42% of all other fellows being female and 4% reporting a disability. Impacts of this funding opportunity will, therefore, more strongly affect comparisons between groups against these characteristics.
The impact of ESRC’s postdoctoral fellowship on average award amounts can be seen this year in breakdowns by gender.
At the UKRI level in 2020 to 2021, the median award amount for male fellows was approximately £840,000, compared with approximately £223,000 for female fellows.
If ESRC’s postdoctoral fellowship is removed from the data, differences in award amounts between the 2 groups are much smaller, with a median award amount of approximately £961,000 for male fellows and £921,000 for female fellows.
Similarly, the impact of this funding opportunity can be seen in the data for disability, if we look at award rates.
In 2020 to 2021 the award rate for applicants reporting a disability was 34% compared with 22% for applicants reporting no disability. If ESRC’s postdoctoral fellowships are removed from the data, the difference in award rates between the 2 groups is much smaller, with an award rate of 22% for applicants reporting a disability and an award rate of 18% for applicants reporting no disability.
If data for unsuccessful applicants for this funding opportunity was available, it would not artificially have a 100% award rate, and we might not see such large differences in award rate against these characteristics.
The impact of this funding opportunity on UKRI’s data is an example of the complexity and limitations of our data and highlights the importance of analysing trends at a more granular level.
Due to the small number of awardees, we must be particularly cautious when drawing conclusions about UKRI-level fellowship data.
Intersectionality
For the first time, this report contains data on the intersection of age, disability and ethnic group with gender.
Data is currently limited to one financial year (2020 to 2021), however, and so developing our intersectional analysis to include trends over time is an important next step.
We have initially focused on the intersection of the characteristics with gender, due to the small number of applicants and awardees in some groups relating to the other characteristics.
The largest group of awardees among principal investigators in 2020 to 2021 was White males, receiving 57% of awards, followed by White females, receiving 24% of awards. The next largest group was Asian males with 6% of awards.
The remaining groups each received between less than 0.5 and 1% of awards. Gender and ethnic group was either ‘unknown’ or ‘not disclosed’ for the remaining 7% of awardees.
The composition of co-investigator awardees was similar, with the highest percentage of awards being received by White males (49%), White females (25%) and Asian males (6%).
Representation of Asian females amongst co-investigator awardees was higher than for principal investigator awards, at 3%. Similarly, although still low overall, representation of Black males (2%), Black females (1%) and males reporting a mixed ethnicity (2%) was higher for the co-investigator than for the principal investigator role.
Studentships
In 2020 to 2021, UKRI had 5,370 new studentship starts. There is a large variation in the distribution of the studentship starts across the research councils. EPSRC has 47% of all new studentships starts, while it ranges from 6% to 13% for all other councils.
Within UKRI-funded postgraduate research students, representation of female students and students reporting a known disability is consistent with previous years (Figure 5).
However, representation of both females and those reporting a known disability remains below a benchmark for the wider postgraduate research population.
This year, 45% of UKRI’s studentship starts were female, compared with a benchmark of 50%, and 8% of UKRI’s studentship starts reported a known disability, compared with a benchmark of 13%.
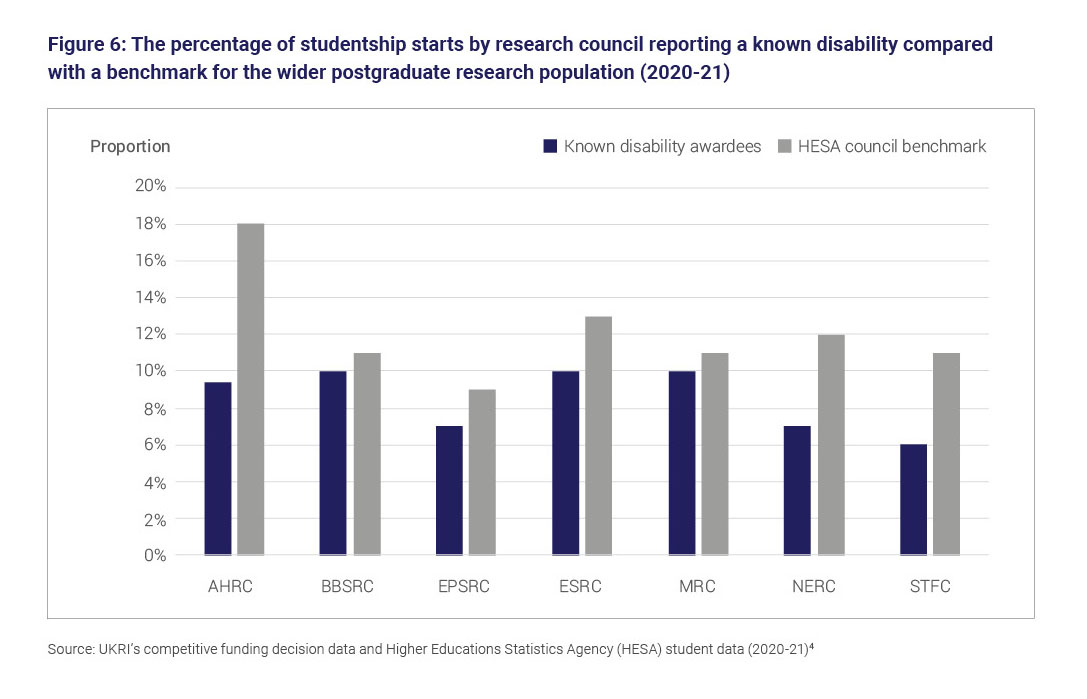
While the average disability HESA benchmark is 12%, there is variation at the research council level, with the benchmark ranging from 18% for AHRC to 9% for EPSRC.
For all research councils, those reporting a known disability remain below their benchmark for the wider postgraduate research population.
The percentage of UKRI-funded postgraduate research studentship starts where ethnicity is ‘unknown’ or ‘not disclosed’ remains high in 2020 to 2021 at 32% compared to the HESA benchmark of 4%.
This means that it continues to be very challenging to draw conclusions on the representation of ethnic minority groups within our studentships.
The main diversity data report goes into greater depth about some of these findings.