
Why we are sharing this analysis
Data describing ESRC’s funding processes can be of interest and use to a range of individuals and groups. As well as summarising what has happened (for example, in reporting how many proposals ESRC has funded in particular places) this data also makes it possible to compare the outcomes of those processes and performance in them.
Data describing ESRC applications is already published by UKRI and gives a useful overview of the performance of organisations and UK regions and nations, across most ESRC funding opportunities combined. But we know that more granular information relating to individual schemes and opportunities is also of interest. This analysis provides detail on outcomes at the level of specific ESRC schemes and UK regions and nations that has not previously been made available.
How to interpret this analysis
Success rates and awarded values are commonly used as indicators of performance in funding processes. This analysis focuses on research organisation (RO) success rates in specific ESRC schemes, and on the value of grants awarded by ESRC to ROs within UK regions and nations. These rates and awarded values relate to the lead organisation on a proposal only.
It is difficult to reach conclusions that reliably identify under- or over-performance without deeper and more technical analysis of the data. This analysis uses 2 statistical techniques, explained next in this section, to reduce the risk that interpretation of the data could lead to unjustified conclusions.
Data on UK regions and nations
The data on the value of grants awarded to UK regions and nations over time is presented as averages based on 12-month rolling windows. For example, if a UK region is reported to have received 15% of the value of ESRC grants on 1 October 2021, that figure relates to the total value of all grants received in the period between 1 April 2021 (6 months before the centre of the date window) and 31 March 2022 (6 months after the centre of the window).
The use of rolling windows of data has the effect of smoothing variation caused by the award of particularly large grants.
Organisation performance and success rate
The data on organisational success rates in specific ESRC schemes is presented as funnel plots. In these charts, the RO’s success rate (as the lead organisation, even if other ROs are included in a proposal) is plotted against the number of funding decisions made in relation to that RO.
A predicted success rate, based on the number of decisions made in relation to an RO, is also plotted. This predicted rate may vary with decision volume and so could be a curve rather than a straight line. This predicted rate gives an idea of the success rate we might expect an RO submitting a given number of proposals to have.
But chance effects mean that an RO’s recorded success rate may differ from that predicted, even if that RO is not actually consistently under- or over-performing. To identify ranges of success rates which are compatible with entirely normal variation, these charts also show ‘control limits’ around the predicted success rate.
If an RO’s success rate falls within this range we can say that, while that RO’s success rate may not be exactly as expected, any variation from the expected success rate is not strong evidence of abnormal performance. In contrast, ROs with success rates that fall outside these expected ranges may be performing abnormally. How reliable this conclusion is depends on how far outside the expected range an RO’s recorded success rate falls.
To give an indication of how unusual an outcome is (and so how safe it is to conclude that an RO’s performance is abnormal) 2 lines called ‘control limits’ are shown on each chart. These lines correspond to 95% and greater than 99% confidence of abnormal performance.
In general, an RO success rate which is outside the 95% range suggests an unusual outcome, while an RO success rate outside the 99% range is reasonably conclusive evidence of this (although this depends on how many ROs are present in the data.)
Regional distribution of ESRC awards
Figure 1 below shows the percentage of the total value of grants awarded by ESRC, by region of the lead RO on a proposal. Not all the total value awarded by ESRC through a grant will necessarily be spent in the named region, as individual awards may provide funding for more than one RO in more than one region.
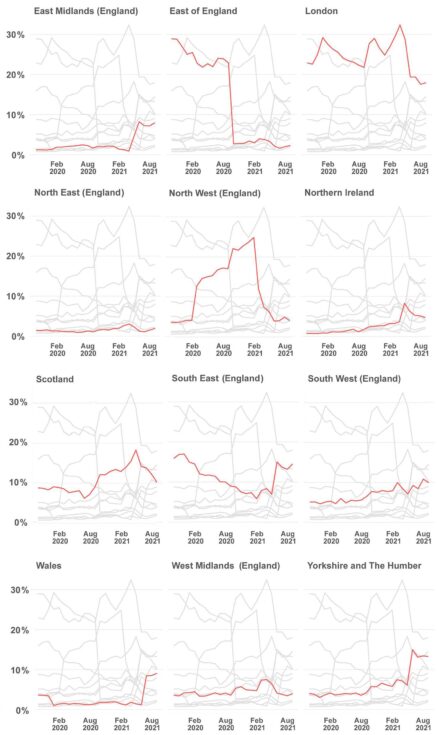
Figure 1: percentage of the total awarded ESRC grant value, by UK regions, 12 month rolling windows for awards made in the period 1 April 2019 to 31 March 2022. The 12 region graphs show an uneven distribution of grant value between UK regions. Data describing research grants comes from internal UKRI grant systems and does not include every award made by ESRC.
Download chart data on regional distribution of funding
London has tended to receive the largest fraction of the combined awarded value of ESRC grants. Its allocation has varied between 20% and 30% of the total in the period covered by the data. Most other regions have received a relatively low and reasonably consistent percentage of all the ESRC funding awarded.
Only South West (England) saw a steady, if small, increase in the percentage of ESRC funding awarded within it. This fraction rose from about 5% to nearly 10% in the period of the data.
East of England saw a large and sudden decline in late 2020. This can be linked to specific awards made earlier in the period covered by the data and is striking even with smoothing applied.
North West (England) saw a peak in its percentage of the combined value awarded, increasing from around 5% to more than 20% before declining again to around 5% more recently.
There are 2 main conclusions can be drawn from this data, which is quite similar to regional spending data reported across UKRI:
- ESRC funding is not evenly distributed across the UK’s regions and nations
- granting of particularly large awards to ROs in a region can have a noticeable, if temporary, effect on the percentage of all ESRC funding that is allocated to a region
ESRC early career researcher schemes
Figure 2 below shows success rates for ROs plotted against the number of funding decisions made in relation to each RO in ESRC early career researcher schemes. In the period covered by the data the only scheme included is the ESRC new investigator grant, although other ESRC schemes may also support early career researchers.
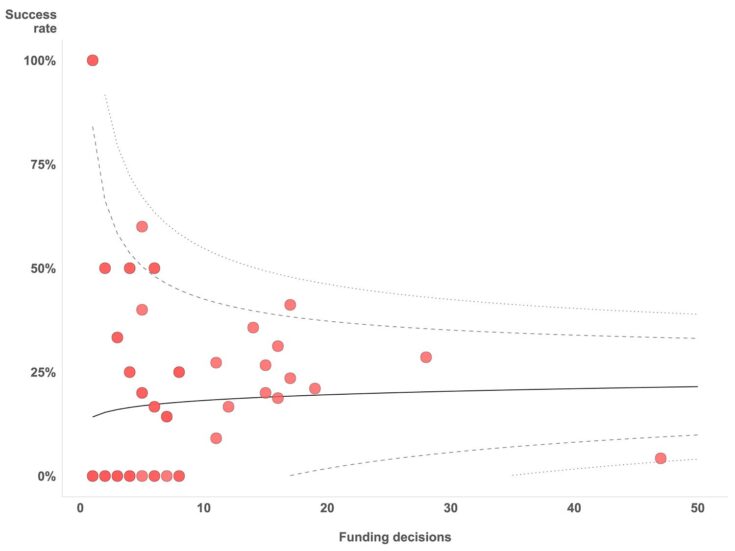
Figure 2: organisational success rates by number of funding decisions for early career researcher funding schemes 1 April 2019 to 31 March 2022. Data describing these research grants comes from internal UKRI systems and may not include all relevant awards made by ESRC.
Download chart data on funding success rates
The expected organisational success rate for ESRC early career researcher schemes is around 20%. There is a positive, if weak, relationship between success rate and the number of funding decisions made. This relationship is not statistically significant.
Most ROs’ success rates fall within the range of values that we would expect to see around this central prediction. These ROs should not be seen as performing abnormally, even if their rates are above or below the predicted value.
Just 2 organisations’ success rates may indicate unusual performance. The University of Manchester (17 funding decisions, 41% funded) may have a somewhat high success rate. The University of Cambridge (47 funding decisions, 4% success rate) almost certainly has an abnormally low success rate.
ESRC research grant scheme
Figure 3 below shows success rates for ROs plotted against the number of funding decisions made in relation to each RO in the ESRC research grant scheme. This is the main responsive mode scheme run by ESRC.
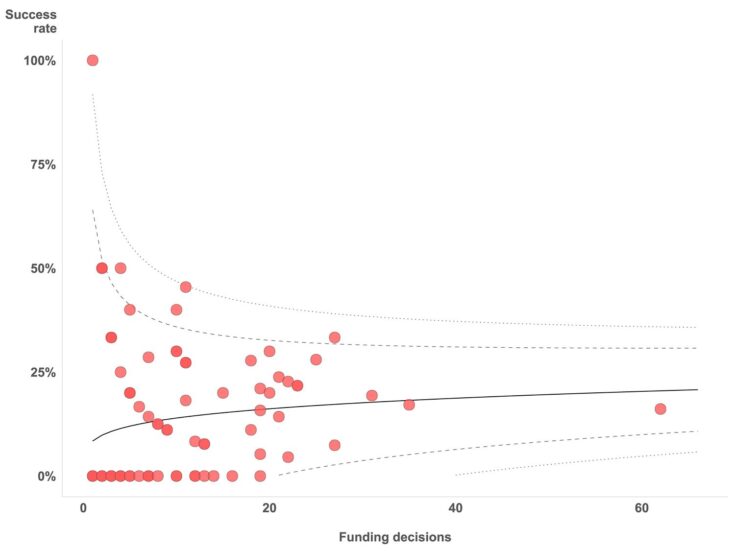
Figure 3: organisational success rates by number of funding decisions for ESRC research grants 1 April 2019 to 31 March 2022. Data describing these research grants comes from internal UKRI systems.
Download chart data on funding success rates
The expected organisational success rate in the ESRC research grant scheme is around 15% to 20%. There is a positive, if weak, relationship between organisational success rate and the number of funding decisions made. This relationship is not statistically significant.
Almost all ROs’ success rates fall within the range of values that we would expect to see around this central prediction. These ROs should not be seen as performing abnormally even if their rates are above or below the predicted value.
Just one RO’s success rate may indicate unusual performance. Durham University (11 funding decisions, 46% success rate) almost certainly has an abnormally high success rate in the ESRC research grant scheme.
Note that it is possible to have as many as 19 proposals without the award of a grant without being identified through this chart as having an abnormal success rate. This finding depends to some extent on the method used to calculate the control limits.
All other ESRC schemes and funding opportunities
Figure 4 below shows success rates of ROs plotted against the number of funding decisions made in relation to each RO across all ESRC schemes other than early career researcher and research grant schemes. The data includes many quite different schemes and funding opportunities.
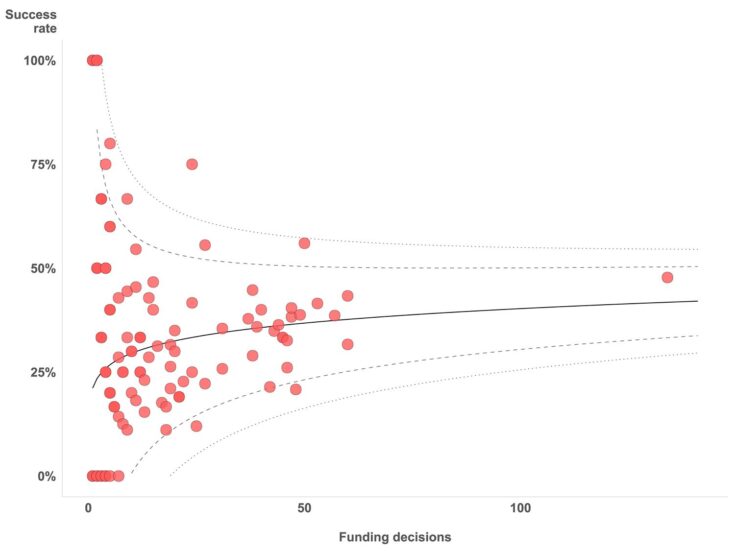
Figure 4: organisational success rates by number of ESRC funding decisions for funding outside ESRC research grants and early career researcher funding schemes, 1 April 2019 to 31 March 2022. Data describing these research grants comes from internal UKRI systems and will not include all awards made by ESRC.
Download chart data on funding success rates
The expected organisational success rate for other ESRC funding opportunities varies between 25% and 35%. A positive relationship between success rate and the number of funding decisions made is clear visually but is not statistically significant.
Almost all ROs’ success rates fall within the range of values that we would expect to see around the predicted success rate. These ROs should not be seen as performing abnormally even if their rates are above or below the predicted value.
Just 2 ROs’ success rates may indicate unusual performance. The Institute for Fiscal Studies (24 funding decisions, 75% success rate) and the LSE (50 funding decisions, 56% success rate) both had abnormally high success rates. The absence of any organisations with unexpectedly low success rates is noteworthy.