
Summary
UK Research and Innovation (UKRI) publishes annual diversity data on the personal characteristics of applicants and awardees to aid transparency in our funding and enable high-level monitoring of trends.
Sharing our data and insights supports our strategic objective of ‘being a creative, evidence-based and evidence-informed organisation’ as set out in our equality, diversity and inclusion (EDI) strategy, published in March 2023.
We are also required, under the Public Sector Equality Duty (PSED), to have due regard to eliminate unlawful discrimination and advance equality of opportunity for people who share a relevant protected characteristic.
This report provides data for the 2021 to 2022 financial year, and adds to our previous diversity data publications. Our publications are continually being enhanced. For the first time, we report on:
- researcher co-investigators
- intersectionality over time
- intersectionality for studentships
- statistical testing on award rates between groups
The report presents a high-level overview of our diversity data for the 2021 to 2022 financial year across seven of UKRI’s research councils. Further breakdown of our diversity data is provided in an accompanying dashboard.
Interpreting our diversity data is complex, as it is based upon thousands of applications to hundreds of funding opportunities administered by seven different research councils. Annual changes in the types of opportunity launched, or external factors such as the COVID-19 pandemic, impact upon our data and the interpretation of trends over time.
For help interpreting or navigating the dashboard, please contact equality@ukri.org.
A comprehensive explanation of the data, methodology and rationale can be found in the methodology annex.
Key findings for 2021 to 2022
Where the terms ‘significant’ and ‘significantly’ are used, this indicates statistical significance exclusively.
Age
For principal investigators and co-investigators at UKRI level, the highest proportion of applicants are aged 40 to 49 (39% and 37%, respectively).
For fellows and researcher co-investigators most applicants are aged 30 to 39 (56% and 65%, respectively).
Disability
Although there were small differences in award rates for principal investigators where a disability was disclosed and where there was no known disability, this difference is not significant (31% and 30%, respectively).
Disability status was not disclosed for 7% of applications in the principal investigator role. This is higher than the proportion of applications in which a disability was declared (2%).
Ethnicity
For the principal investigator role type, applications from the White ethnic group had a significantly higher award rate (31%) than principal investigators from both Asian and Black ethnic groups (23% and 21%, respectively).
For co-investigators, applications from the White ethnic group also had a significantly higher award rate (31%) than the Asian ethnic group (26%).
Gender
Representation of male applications was 68% for principal investigators, 64% for co-investigators, 53% for researcher co-investigators and 58% for fellowships.
The award rate for fellows was significantly higher for female than male applicants (8 percentage points).
Intersectionality
For the principal investigator role type, over half of the awards went to White male applicants, at 56%.
Introduction
We publish diversity data on applications and awards against four diversity characteristics (age, disability, ethnicity and gender).
The Joint Electronic Submission (Je-S) system asks applicants to provide information on gender with male, female or not disclosed as response options. For this reason, we use the terminology male and female to describe gender categories throughout this document. We realise these are not in alignment with data reporting categories for equality monitoring data and reflect this through data collection in our new funding service: the UKRI Funding Service.
This report focuses on data for the financial year 2021 to 2022.
Our mission is for a thriving and inclusive research and innovation system. One of our strategic objectives, published in the UKRI strategy, is to support diversity of people and ideas. We are committed to developing initiatives to increase the diversity of people able to apply for, participate in, and benefit from investments in research and innovation.
We collect and analyse the application and award data to monitor, inform, and understand how our policies are working and to be transparent.
What is included
Role type
The data on applications and awards is broken down by role type:
- principal investigators
- co-investigators
- researcher co-investigators
- fellows
- studentship starts
This report is the first year we have included data for researcher co-investigators. A researcher co-investigator is a postdoctoral researcher who merits appropriate recognition for making a significant contribution to the preparation of the proposal and the ensuing research.
In May 2023, we announced the streamlining of 35 grant roles, previously used across the organisation for its funded projects, into a set of 12 harmonised roles. In many cases, harmonisation has involved consolidating various functionally identical roles which had different names across our nine councils.
A new role called ‘project lead’ replacing the principal investigator title is among the changes. Role changes apply only to applications made using the UKRI Funding Service. The funding opportunities included in this report, which use the Je-S system, were not affected.
Full guidance on the new roles, including how they map to the previous roles in Je-S, is available in our roles in funding applications guidance. The changes to grant roles will be reflected in the data in due course as more awards are made through the UKRI Funding Service.
Data is presented in this report from the 2014 to 2015 financial year to the 2021 to 2022 financial year.
Award rate
Discussion within this report is principally focused on award rate data, defined as the number of awardees as a percentage of the number of applicants, for the latest financial year. However, for sections on research council-level breakdowns or intersectionality, award rate data is displayed cumulatively over a five-year period (from the 2017 to 2018 financial year to the 2021 to 2022 financial year) due to the small number of awardees within some groups. This is consistent with our previous publications.
Competitive funding
This report is based on competitive UKRI funding to named individuals from across seven research councils and cross-UKRI funds. Competitive funding opportunities typically involve an open call for proposals or applications where only the highest-ranked proposals, based on an evaluation process, are funded.
Council categories
The category ‘cross-UKRI’ includes applications to funding opportunities which are hosted centrally by UKRI, including but not limited to the Global Challenge Research Fund and the Newton Fund Impact Scheme.
The seven research councils are:
- Arts and Humanities Research Council (AHRC)
- Biotechnology and Biological Sciences Research Council (BBSRC)
- Engineering and Physical Sciences Research Council (EPSRC)
- Economic and Social Research Council (ESRC)
- Medical Research Council (MRC)
- Natural Environment Research Council (NERC)
- Science and Technology Facilities Council (STFC)
The majority of Innovate UK and Research England funding goes to organisations. Therefore, all Innovate UK and Research England funding is excluded from this report.
Report structure summary
The report includes:
- the proportion of applicants and awardees sharing a characteristic by role type
- award rates (number of awardees as a percentage of the number of applicants) for principal investigators and fellows
- statistical testing to assess whether there is sufficient statistical evidence to reject the notion that the reported differences in award rates across characteristics are occurring by chance (see technical annex)
- median award values for successful principal investigators and fellows, and ‘award rate by value’, which is the value of the total amount awarded as a percentage of the total amount applied for, for principal investigators and fellows
- intersectionality analysis, which is limited to the interaction between gender and other diversity characteristics due to small numbers
- the proportion of doctoral studentship starts sharing a characteristic
This report comprises an introductory section covering the distribution of applicants and awardees for each role type, by research council. Then follows sections for each of the four characteristics: age, disability, ethnicity and gender.
For each of the characteristics, there are subsections which discuss the composition of applicants, award rate for UKRI, council-level award rate, the amount awarded and the intersection with gender.
Known outliers
Throughout this report, STFC frequently has higher award rates for principal investigators than the other research councils. STFC awards a substantial amount of its research funding in the form of consolidated grants, with a department or group submitting a single integrated proposal. The funds are still competitive but most consolidated grants will be funded, although generally at a lower value than requested.
Similarly, the allocation of funding for ESRC fellows differs from other fellowship opportunities awarded by UKRI. ESRC supports several fellowship opportunities but the mechanism through which funding is allocated varies. As the allocation of funding for ESRC’s Postdoctoral Fellowship Scheme is devolved to Doctoral Training Partnerships, ESRC only awards grants to successful candidates and does not hold data on the total applicant pool.
This results in nearly a 100% award rate in that scheme. This affects UKRI-level data by lowering average award amounts, increasing award rates, and increasing award rates by value. While the comparison of fellowship award rates between ESRC and the other councils is therefore less meaningful, it does not affect the comparison of differences in award rates between characteristics.
UKRI-level data
Interpreting UKRI-level data can be complex. For example, there are variations across councils in success rates, award values, and demographic representation among applicants. These differences introduce layers of nuance that can obscure the picture.
For example, there is unequal representation of demographic groups among applicants to each council. This means that differences in success rates and award values between demographic groups reported at UKRI level could be at least in part due to differences in success rates and award values between councils.
These challenges highlight the importance of contextual understanding and careful analysis when interpreting UKRI-level data.
Methodology for 2021 to 2022
We introduce, for the first time, inferential statistics in the sections on UKRI award rate. To support this statistical inference, we have used permutation tests to compare groups and determine if there are statistically significant differences between them.
While summary statistics, such as means, provide a descriptive summary of data, inferential statistics, such as permutation tests, go a step further by helping us make statistical inferences about characteristics. They are useful tools for policymakers to gain deeper insights. While statistical significance is a valuable metric in research, it is crucial to recognise the limitations and avoid overinterpreting results.
Given the level of granularity at which we are presenting the findings, there may be instances where award rates are based on a small number of applications. In instances where the text makes an explicit reference to an award rate, we will include the application count where the number of applicants is fewer than 50. In these situations, we use ‘N=’ to indicate number of applications. We encourage users to explore the dashboard for further breakdowns.
We introduce the Higher Education Statistics Agency (HESA) postgraduate student population as a comparator in the section on studentships, which focuses on the distribution of awards through UKRI’s doctoral training programme.
Any student wishing to study at a UK research organisation can apply for a UKRI studentship, so comparisons with UK-domiciled HESA student data are insightful. However, HESA staff data reflects the diversity of the population of the UK higher education institutions (HEIs).
Some UKRI funding opportunities allow for internationally domiciled applicants or researchers outside of UK HEIs, and therefore the two do not compare like-for-like. As a result, using HESA as a comparator is not available for other role types, as we review the meaningfulness of the comparison.
Similarly, we previously included comparisons to the Office for National Statistics (ONS) Labour Force Survey. The ONS Labour Force survey includes the employment status of over 16-year-olds in the UK. Our data does not include under 18s and includes applicants outside of the UK, so this comparison has also been removed.
For information on award rate for all role types and proportion of awardees by protected characteristic please see our diversity data dashboard.
For more detail on the methodology, see the technical annex.
Applicants and awardees
Distribution in 2021 to 2022
The count of applications and awardees by council for 2021 to 2022 is shown in tables 1a and 1b. Within this distribution of applications there are differences in diversity characteristics and application patterns across the seven research councils, cross-UKRI, and UKRI overall.
Table 1a: EPSRC has the highest number of applications compared to the other councils and STFC the least
| Council | Principal investigator | Co-investigator | Researcher co-investigators | Fellow |
|---|---|---|---|---|
| AHRC | 845 | 1,465 | 0 | 125 |
| BBSRC | 1,840 | 2,845 | 330 | 150 |
| EPSRC | 2,595 | 4,395 | 295 | 380 |
| ESRC | 810 | 2,310 | 0 | 265 |
| MRC | 1,185 | 3,430 | 210 | 430 |
| NERC | 875 | 1,905 | 155 | 155 |
| STFC | 335 | 595 | 45 | 195 |
| Cross-UKRI | 795 | 3,575 | 160 | 795 |
| UKRI overall | 9,280 | 20,520 | 1,195 | 2,500 |
Table 1b: number of awards for each council
| Council | Principal investigator | Co-investigator | Researcher co-investigator | Fellow |
|---|---|---|---|---|
| AHRC | 245 | 425 | 0 | 35 |
| BBSRC | 445 | 645 | 90 | 25 |
| EPSRC | 765 | 1,330 | 75 | 75 |
| ESRC | 200 | 640 | 0 | 145 |
| MRC | 335 | 1,030 | 55 | 80 |
| NERC | 245 | 535 | 40 | 15 |
| STFC | 250 | 505 | 40 | 15 |
| Cross-UKRI | 275 | 1,120 | 60 | 110 |
| UKRI overall | 2,765 | 6,235 | 355 | 500 |
Notes: the number of applications and awards for principal investigators, co-investigators, researcher co-investigators and fellows for the seven research councils, cross-UKRI and UKRI overall (2021 to 2022)
Age
Applicant composition
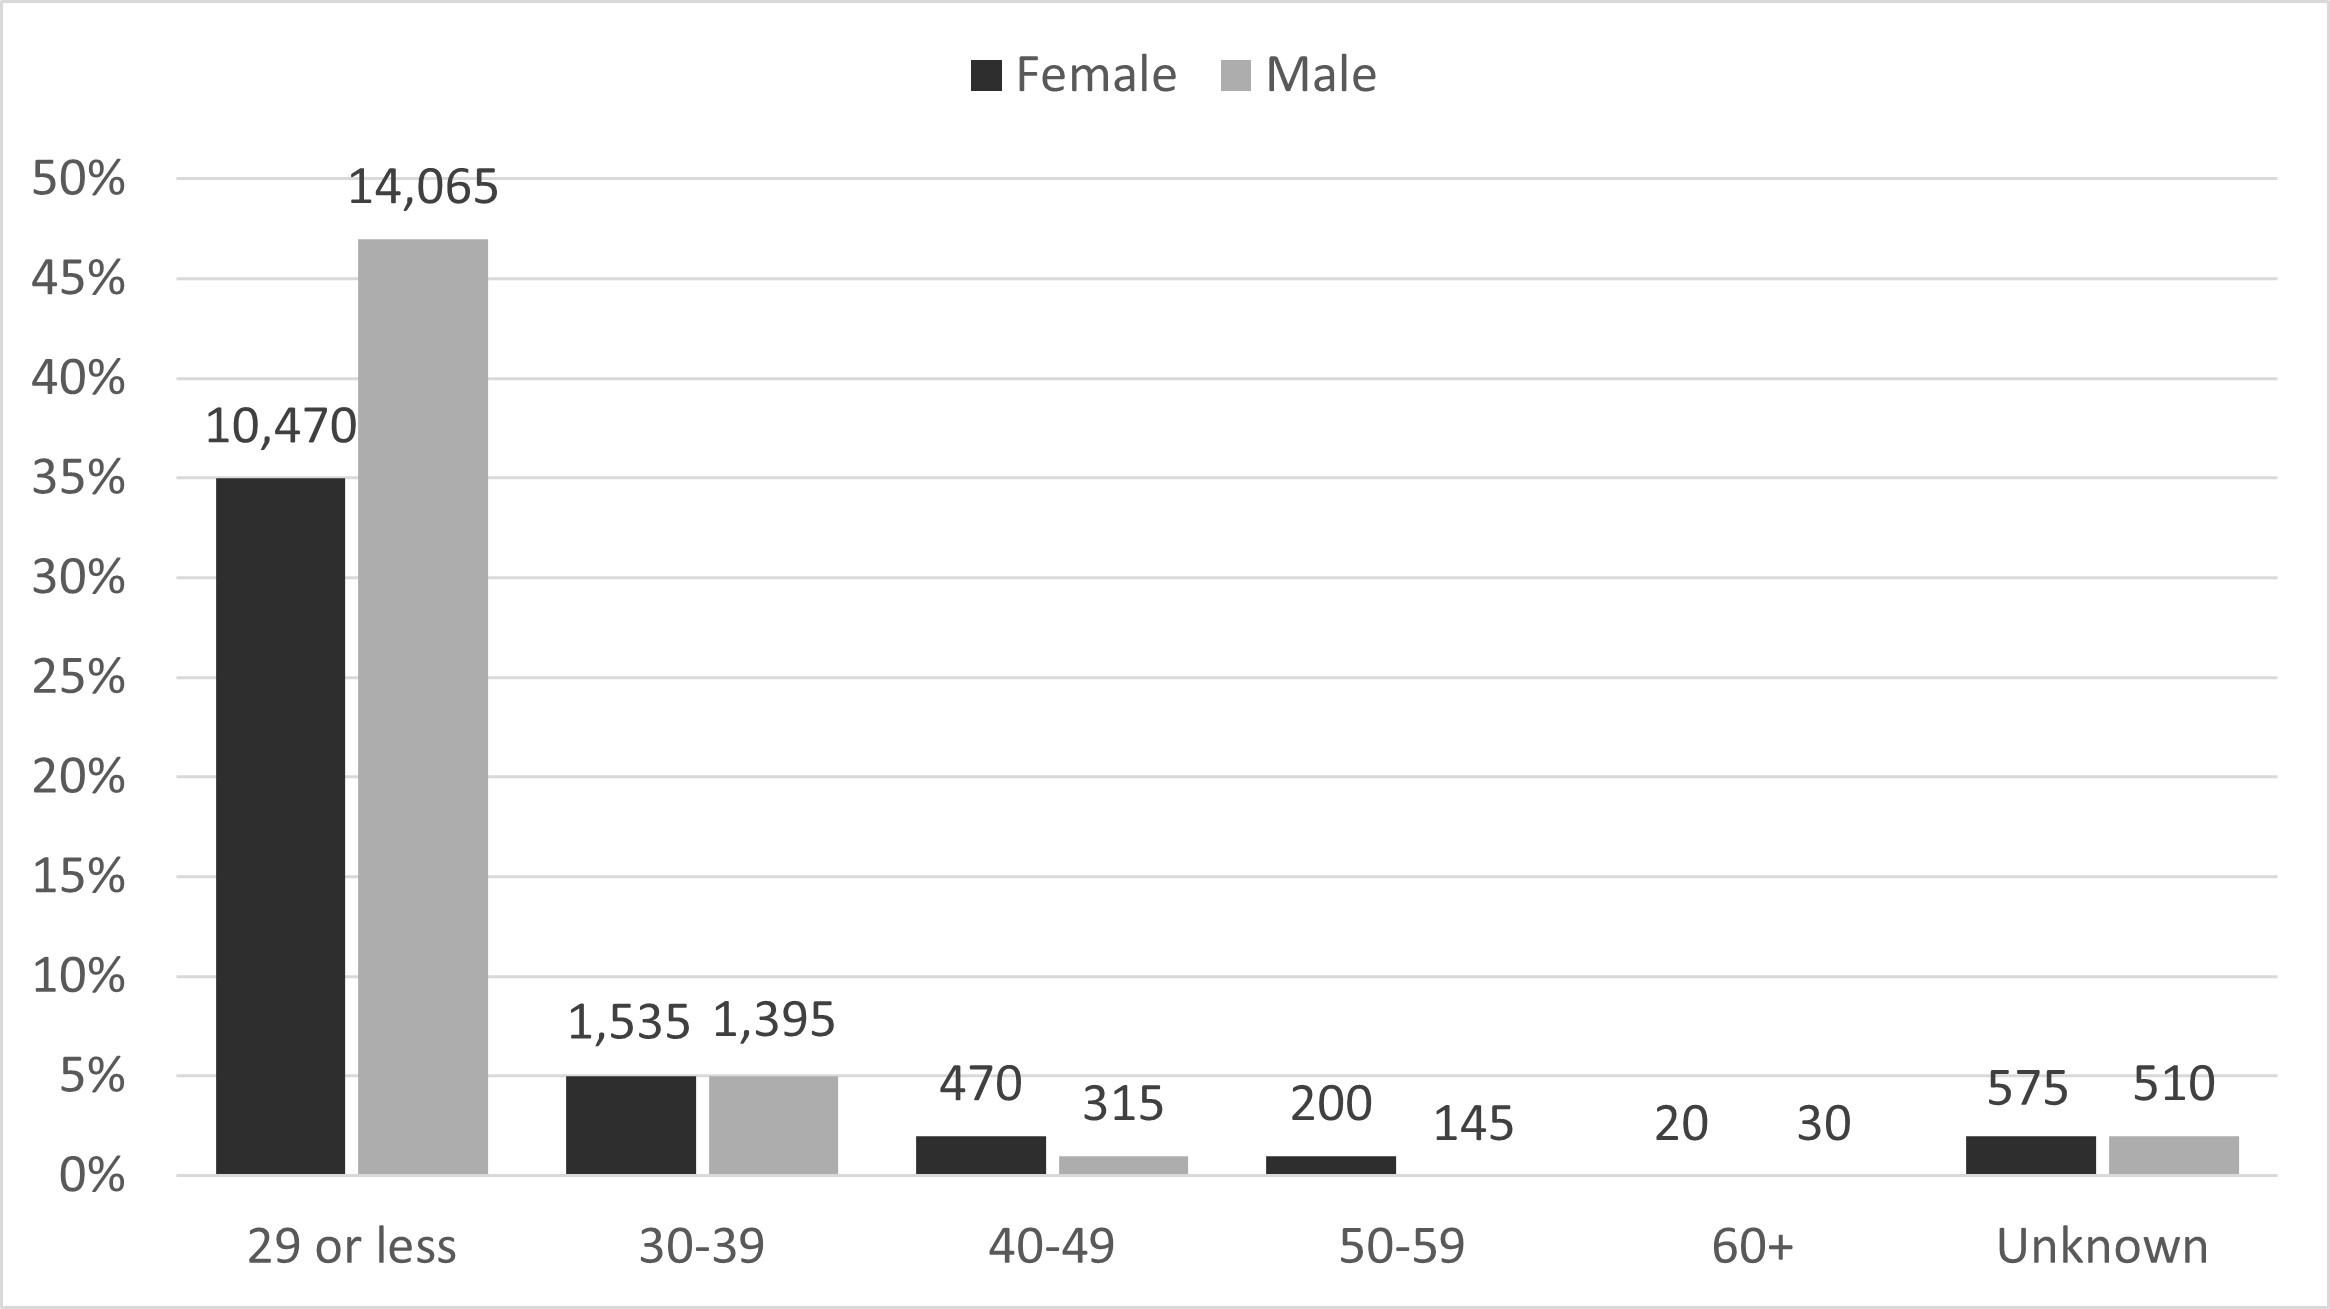
Figure 1 shows the composition of UKRI applicants by age group for the four role types: principal investigators, co-investigators, researcher co-investigators and fellows in 2021 to 2022.
For principal investigators and co-investigators at UKRI level, the highest number of applicants are aged 40 to 49, while for fellows and researcher co-investigators most applicants are aged 30 to 39 (figure 1).
Individuals can attain positions at different points in their careers. Even so, researcher co-investigators and fellows are typically in the early to mid-stages of their careers, reflected in the younger age distribution (figure 1).
Figure 1: UKRI applicant age composition by role, 2021 to 2022
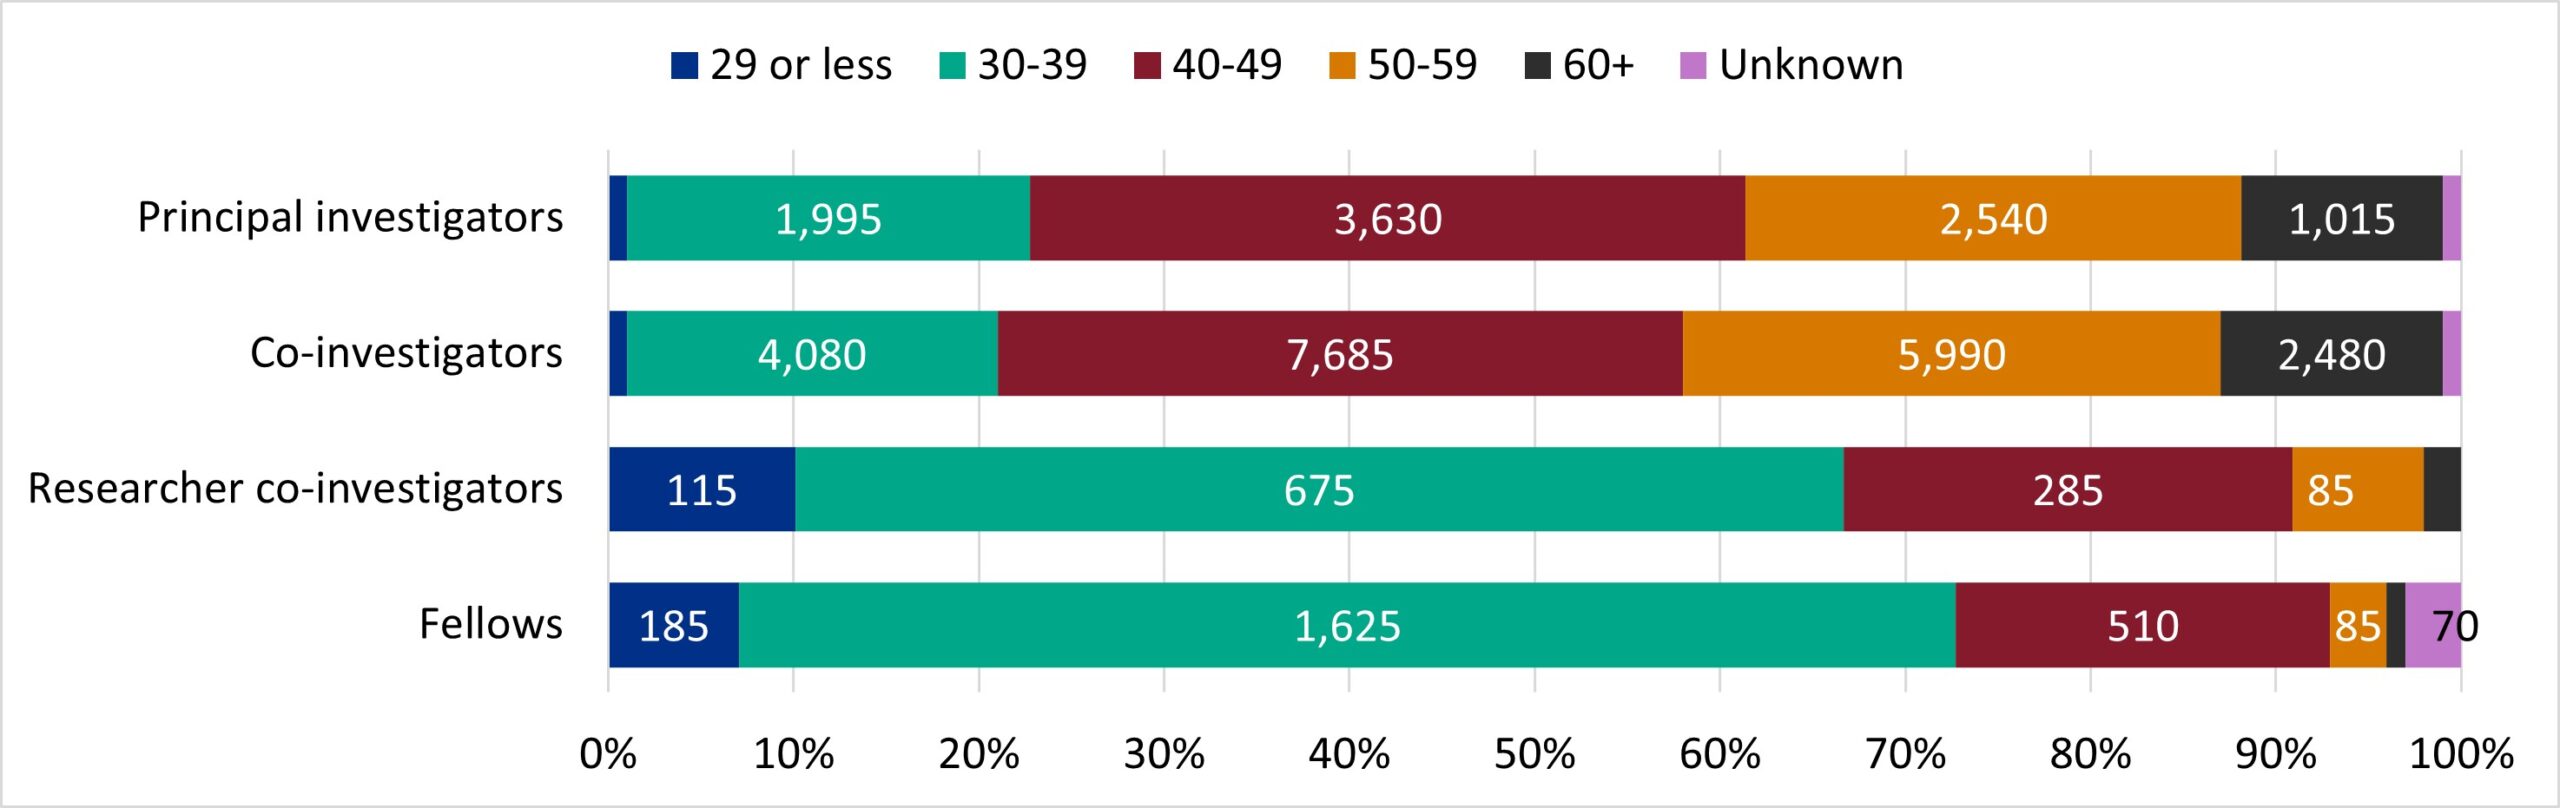
Description of figure 1: This stacked bar chart shows that principal investigators and co-investigators have an older applicant age distribution than researcher co-investigators and fellows.
Source: UKRI diversity data
Download the data for figure 1 (ODS, 4KB).
Notes:
- labels represent the number of applicants
- counts in groups with less than 2% of the annual role total are not labelled
UKRI award rate
The award rate was variable across age group and role of the awardee. In 2021 to 2022, for UKRI overall (excluding not disclosed and unknown categories), the 29 or less, 50 to 59 and 60 plus age groups all had the highest award rate for principal investigators, at 32% (figure 2). The 29 or less age group had fewer than 50 applicants for principal investigators in 2021 to 2022 (n=45).
For the same year, the age group 40 to 49 had the highest award rates for researcher co-investigators (36%) but lowest for co-investigators (29%) and fellows (18%).
Figure 2: UKRI award rate by age and role type, 2021 to 2022
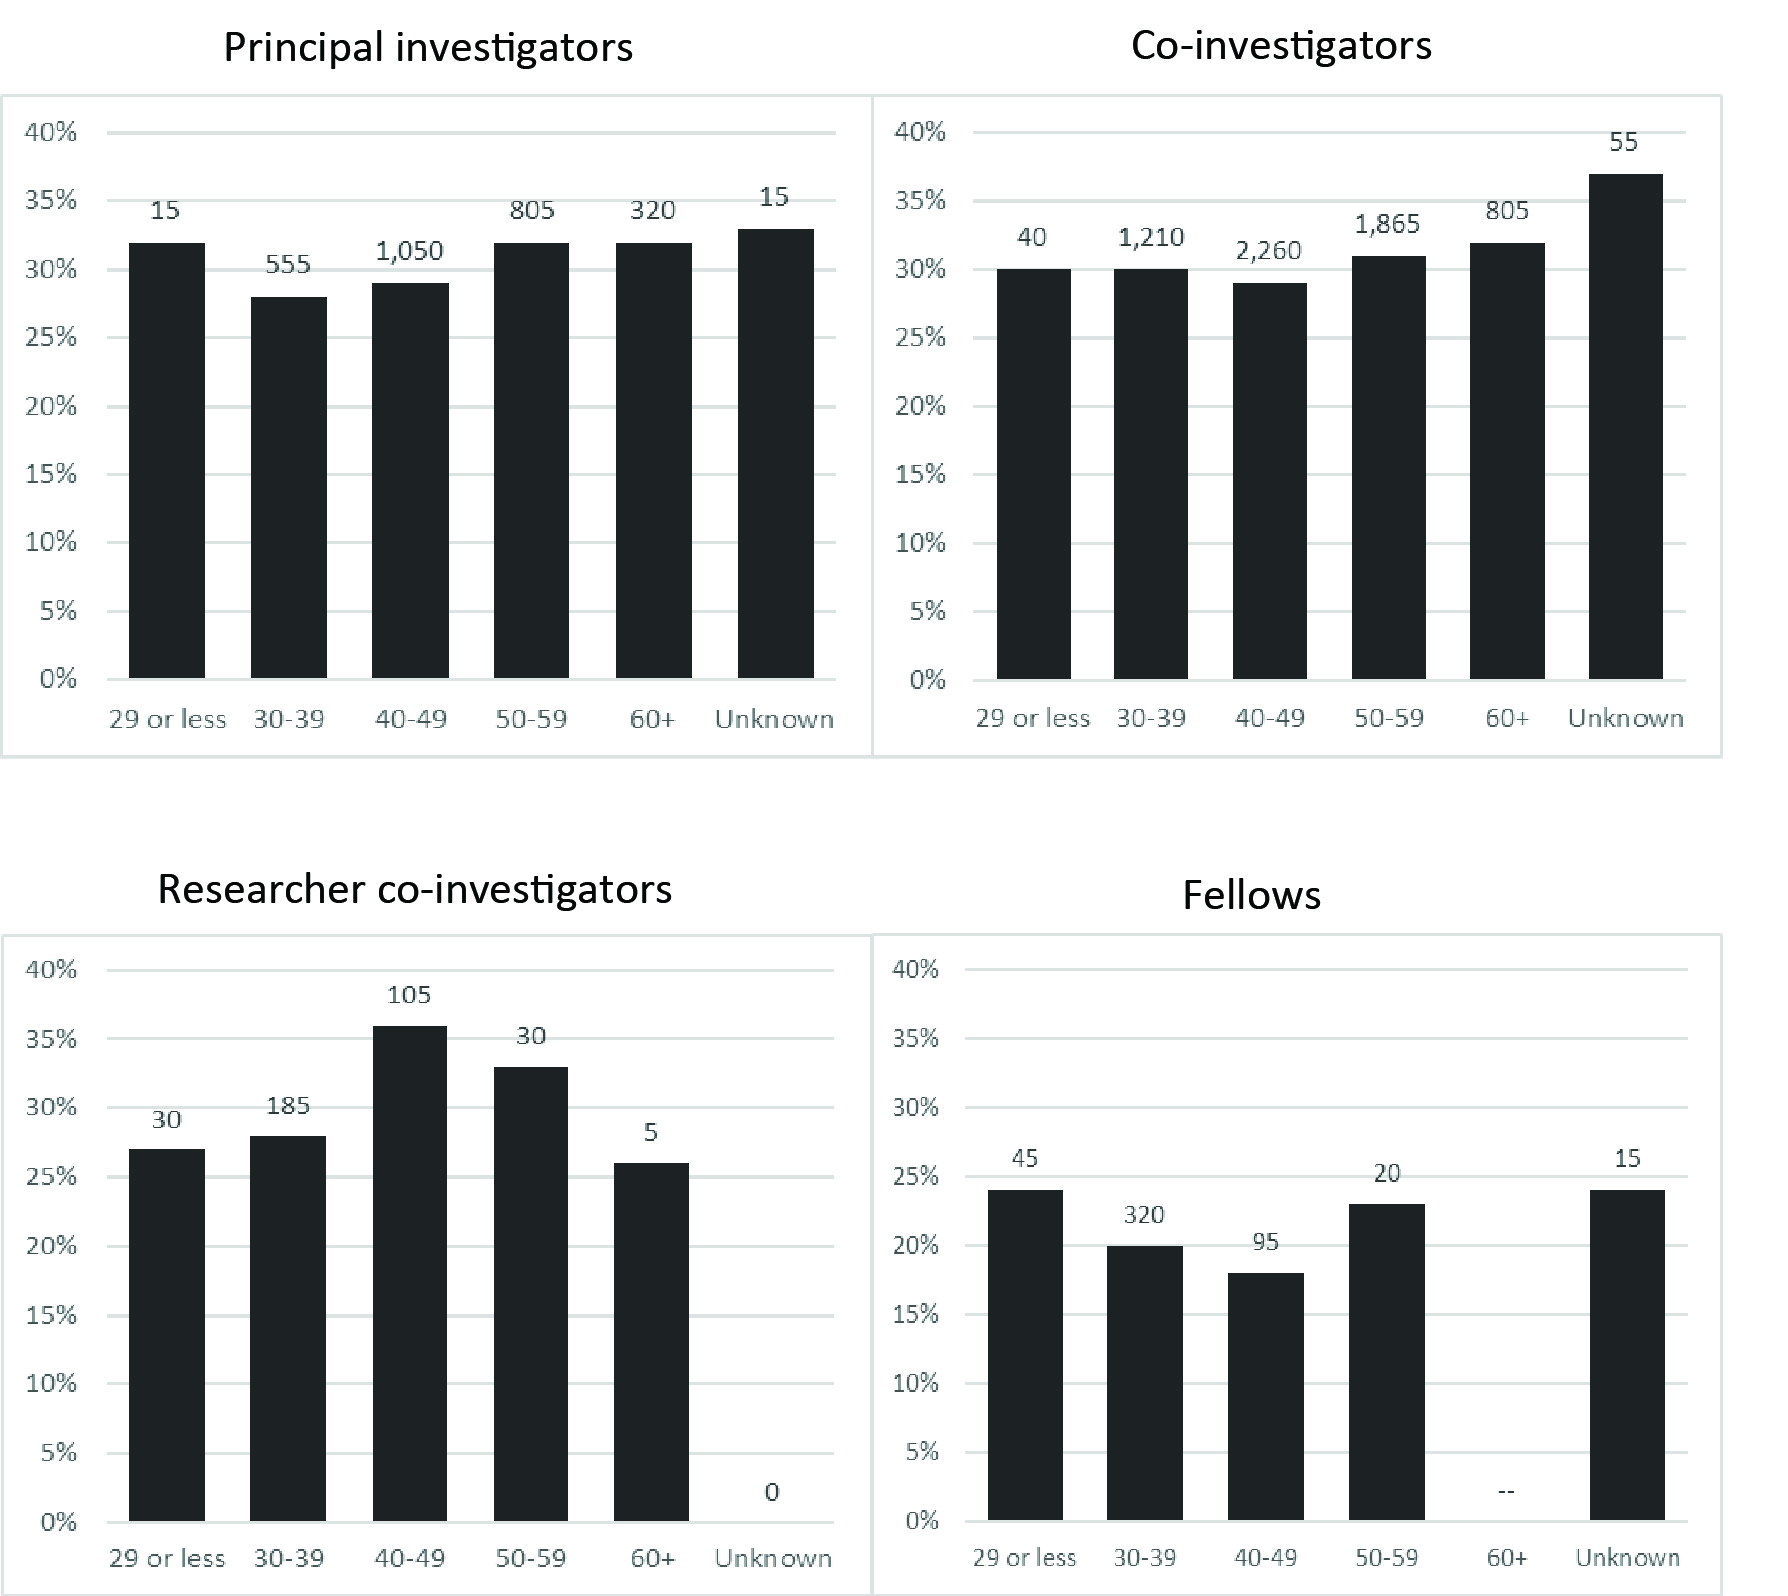
Description of figure 2: these four bar charts show that researcher co-investigators in the 40 to 49 age group had the highest award rate, and fellows in the 40 to 49 age group had the lowest.
Source: UKRI diversity data.
Download the data for figure 2 (ODS, 4KB).
Notes:
- rates for groups comprising fewer than five individuals are not reported
- numbers above the bars represent the number of awardees
Council award rate
To compare award rates by age at research council level we use aggregated data over a five-year period. Table 2 and table 3 present the five-year cumulative award rates for principal investigators and fellows. Across councils and age, the range of award rates are much wider than for UKRI overall. Award rates for principal investigators were highest for the 50 to 59 age group at STFC (76%, table 2).
As explained in the ‘what is included’ section of the introduction, STFC and ESRC frequently have higher award rates for principal investigators and fellows (respectively) than the other research councils. ESRC’s method of allocating fellowships results in higher award rates and a broader age range (table 3).
Table 2: award rates for principal investigators vary across age group and councils, there is no age group with the highest award rate for all councils
| Award rate | 29 or less | 30-39 | 40-49 | 50-59 | 60+ | Unknown |
|---|---|---|---|---|---|---|
| AHRC | 25% | 32% | 29% | 30% | 26% | 32% |
| BBSRC | [c] | 24% | 24% | 29% | 31% | 21% |
| EPSRC | 44% | 34% | 30% | 31% | 29% | 29% |
| ESRC | 23% | 21% | 22% | 29% | 29% | 16% |
| MRC | [c] | 19% | 20% | 23% | 23% | 10% |
| NERC | 29% | 25% | 26% | 29% | 31% | 27% |
| STFC | 40% | 56% | 64% | 76% | 72% | [c] |
| Cross-UKRI | [c] | 24% | 30% | 27% | 32% | [c] |
| UKRI overall | 28% | 28% | 27% | 30% | 30% | 22% |
Notes:
- award rate by age for principal investigators by council, cross-UKRI, and UKRI overall (five-year cumulative, from 2017 to 2018 financial year to the 2021 to 2022 financial year)
- ‘[c]’ means the value has been suppressed.
Table 3: ESRC’s award rates for fellowships are higher than the other councils, particularly for the 29 or less age group, due to their method of allocation
| Award rate | 29 or less | 30-39 | 40-49 | 50-59 | 60+ | Unknown |
|---|---|---|---|---|---|---|
| AHRC | [c] | 28% | 33% | 27% | 17% | [c] |
| BBSRC | 10% | 12% | [c] | [w] | [c] | [c] |
| EPSRC | 15% | 23% | 24% | 32% | 23% | 14% |
| ESRC | 91% | 75% | 59% | 50% | 29% | 93% |
| MRC | 29% | 25% | 16% | [c] | [w] | 14% |
| NERC | 17% | 14% | 18% | [c] | [w] | [c] |
| STFC | [c] | 9% | 12% | 18% | [c] | [c] |
| Cross-UKRI | 12% | 16% | 14% | [c] | [w] | 13% |
| UKRI overall | 26% | 21% | 20% | 25% | 20% | 19% |
Notes:
- award rate by age for fellows by council, cross-UKRI, and UKRI overall (five-year cumulative from the 2017 to 2018 financial year to the 2021 to2022 financial year)
- ’[c]’ means the value has been suppressed
- ‘[w]’ is used during suppression to show values for groups where there were no awardees
Median award amount
For UKRI overall, the median award amount for principal investigators in 2021 to 2022 increased with age (table 4). This is consistent with previous years. The highest median award amount for 2021 to 2022 was for the 60 plus age group (£483,000; table 4).
For fellows in 2021 to 2022, the 40 to 49 age group had the highest median award amount (£456,000; table 5). While differences across age groups will be unaffected, the absolute values are influenced by the large number of small fellowship awards to ESRC postdoctoral fellowships.
Table 4: the median award amount for principal investigators in 2021 to 2022 increased with age
| Median award amount | 29 or less | 30-39 | 40-49 | 50-59 | 60+ | Unknown |
|---|---|---|---|---|---|---|
| 2017-2018 | £129,000 | £216,000 | £359,000 | £391,000 | £392,000 | £338,000 |
| 2018-2019 | £238,000 | £250,000 | £383,000 | £422,000 | £424,000 | £277,000 |
| 2019-2020 | £240,000 | £245,000 | £361,000 | £403,000 | £481,000 | £422,000 |
| 2020-2021 | £214,000 | £265,000 | £394,000 | £433,000 | £508,000 | £361,000 |
| 2021-2022 | £161,000 | £264,000 | £375,000 | £424,000 | £483,000 | £186,000 |
Notes:
- median award amount for principal investigators by age
- UKRI overall, yearly, from the 2017 to 2018 financial year to the 2021 to 2022 financial year
Table 5: For fellows in 2021 to 2022, the 40 to 49 age group had the highest median award amount
| Median award amount | 29 or less | 30-39 | 40-49 | 50-59 | 60+ | Unknown |
|---|---|---|---|---|---|---|
| 2017-2018 | £281,000 | £304,000 | £300,000 | £304,000 | [c] | £244,000 |
| 2018-2019 | £120,000 | £306,000 | £200,000 | £153,000 | [c] | £103,000 |
| 2019-2020 | £106,000 | £392,000 | £479,000 | £479,000 | [c] | £273,000 |
| 2020-2021 | £103,000 | £796,000 | £956,000 | £104,000 | £108,000 | £146,000 |
| 2021-2022 | £108,000 | £409,000 | £456,000 | £164,000 | [c] | £267,000 |
Notes:
- median award amount for fellows by age
- UKRI overall, yearly, from the 2017 to 2018 financial year to the 2021 to 2022 financial year
- ‘[c]’ means the value has been suppressed
Disability
Applicant composition
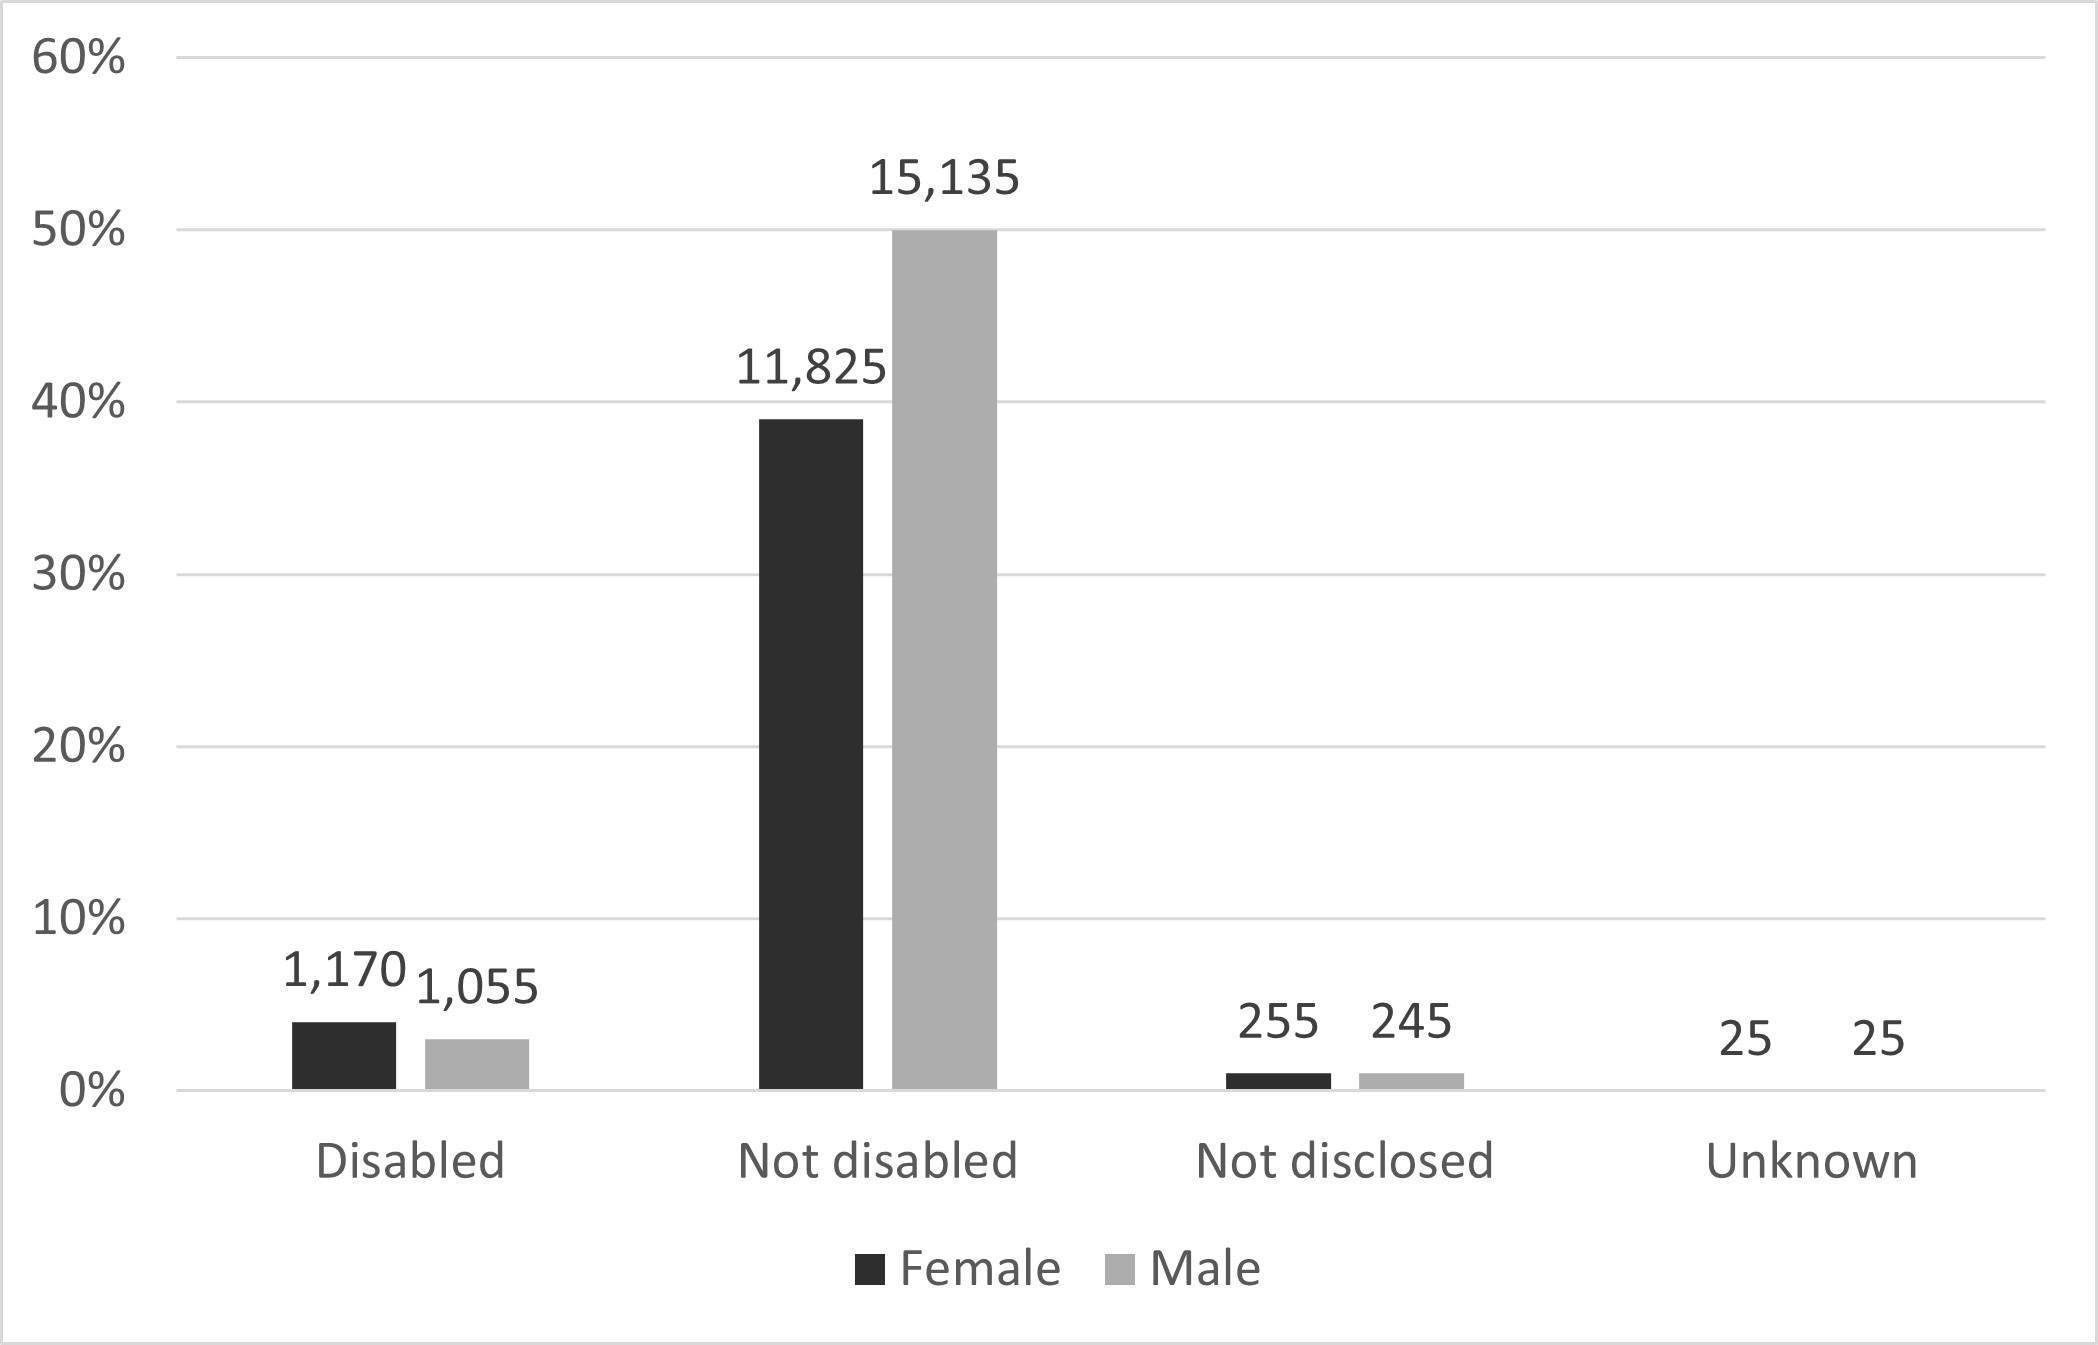
In 2021 to 2022, the percentage of applicants reporting a disability was 2% for principal investigators and co-investigators, and 3% for researcher co-investigators (N = 35) and fellows (figure 3). This is consistent with previous years, in which the percentage fluctuated between 1% and 2%.
The percentage of applicants choosing not to share their disability information is higher than the percentage of applicants declaring a disability for all role types, at 7% for principal investigators and co-investigators and 6% for researcher co-investigators and fellows (figure 3).
Figure 3: UKRI applicant disability composition by role, 2021 to 2022
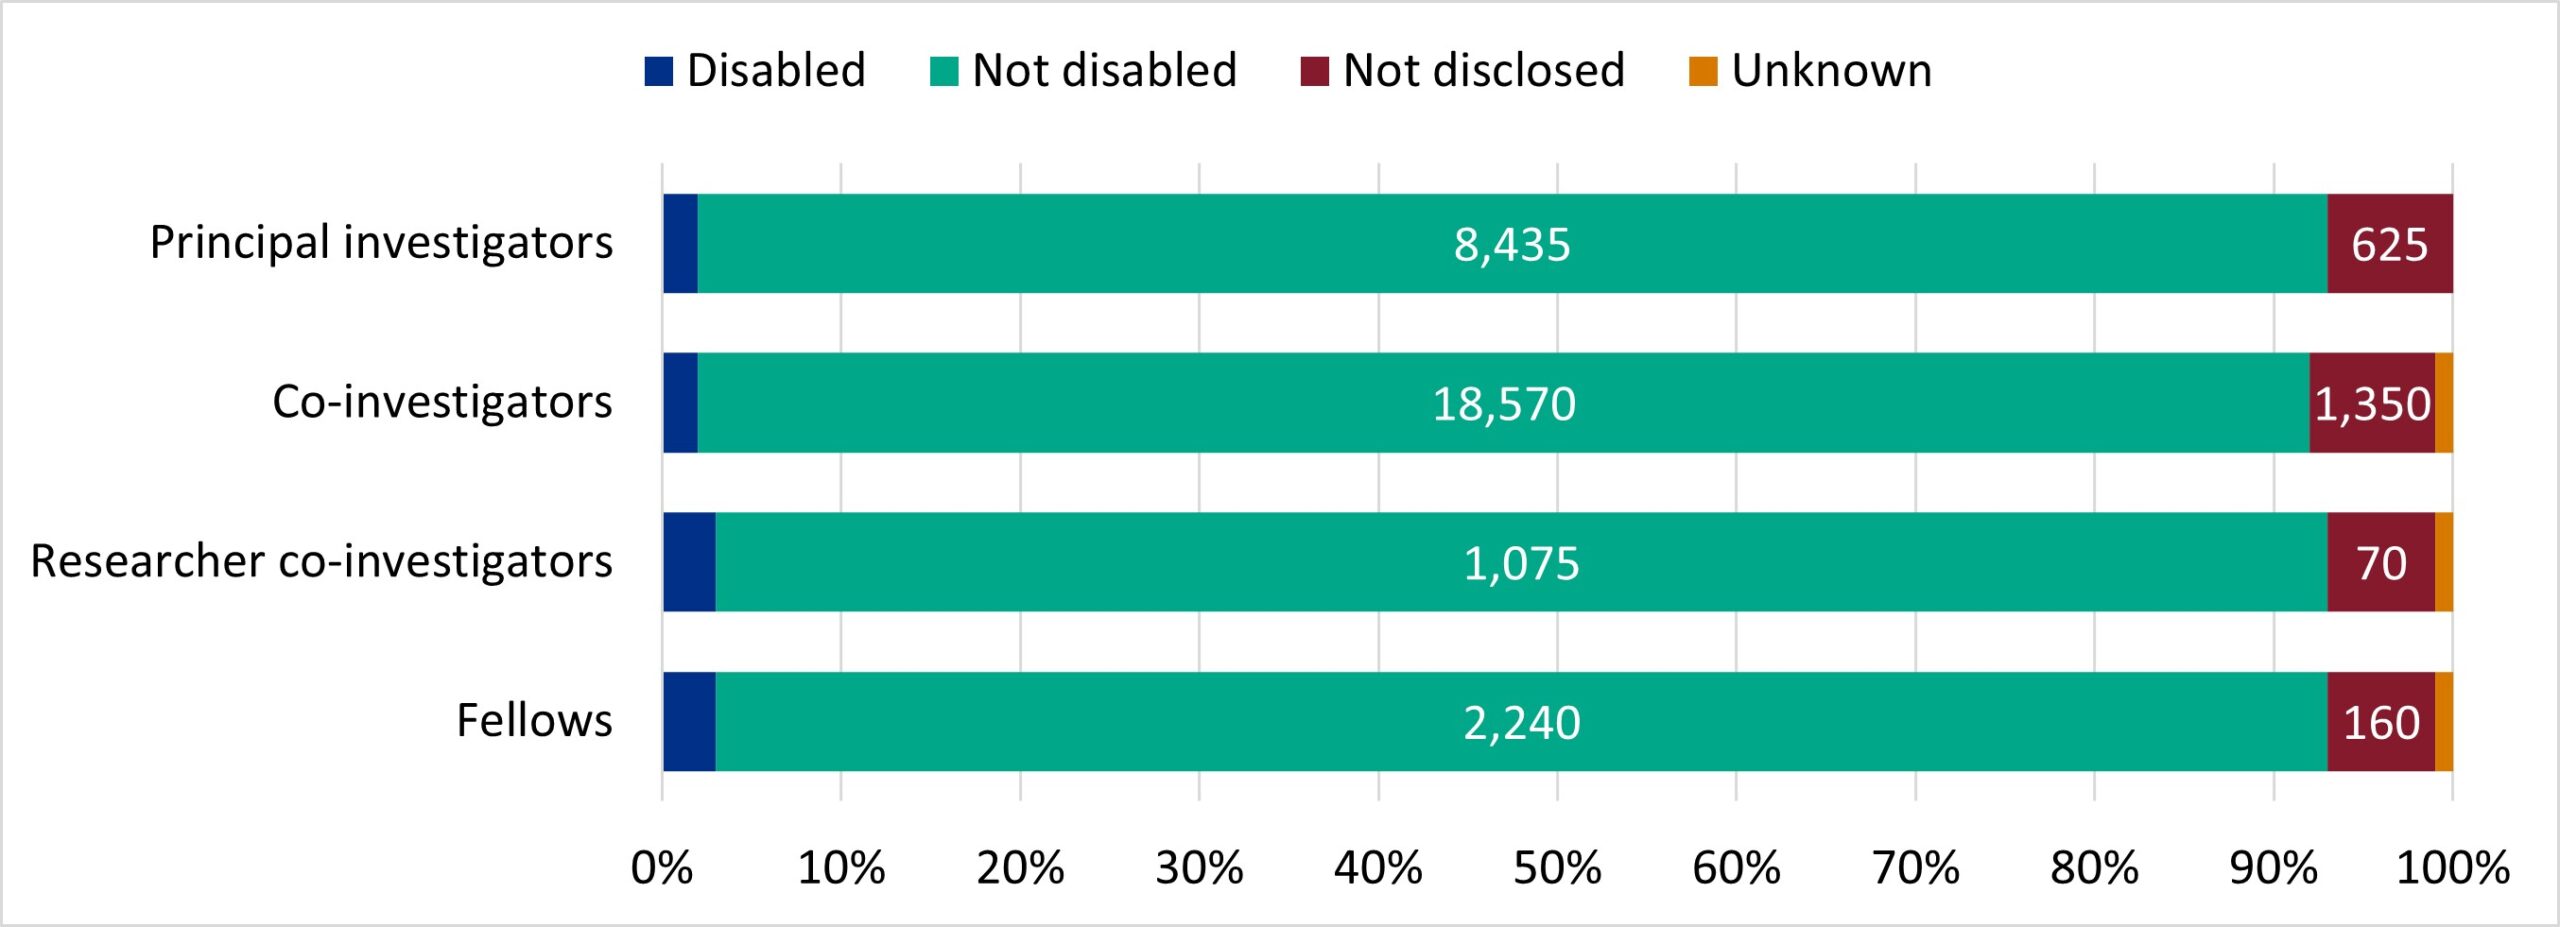
Description of figure 3: this stacked bar chart shows that most applicants were not disabled for all role types.
Source: UKRI diversity data
Download the data for figure 3 (ODS, 4KB).
Notes:
- labels represent the number of applicants
- counts in groups with less than 2% of the annual role total are not labelled
UKRI award rate
Although there are small differences in award rates for those with a disability and those who did not declare a disability (figure 4), analysis of 2021 to 2022 data indicates that these differences are not statistically significant for any role type. This means the differences are within the range of outcomes we would expect to see if award rate and disability were not associated.
Figure 4: UKRI award rate by role, 2021 to 2022
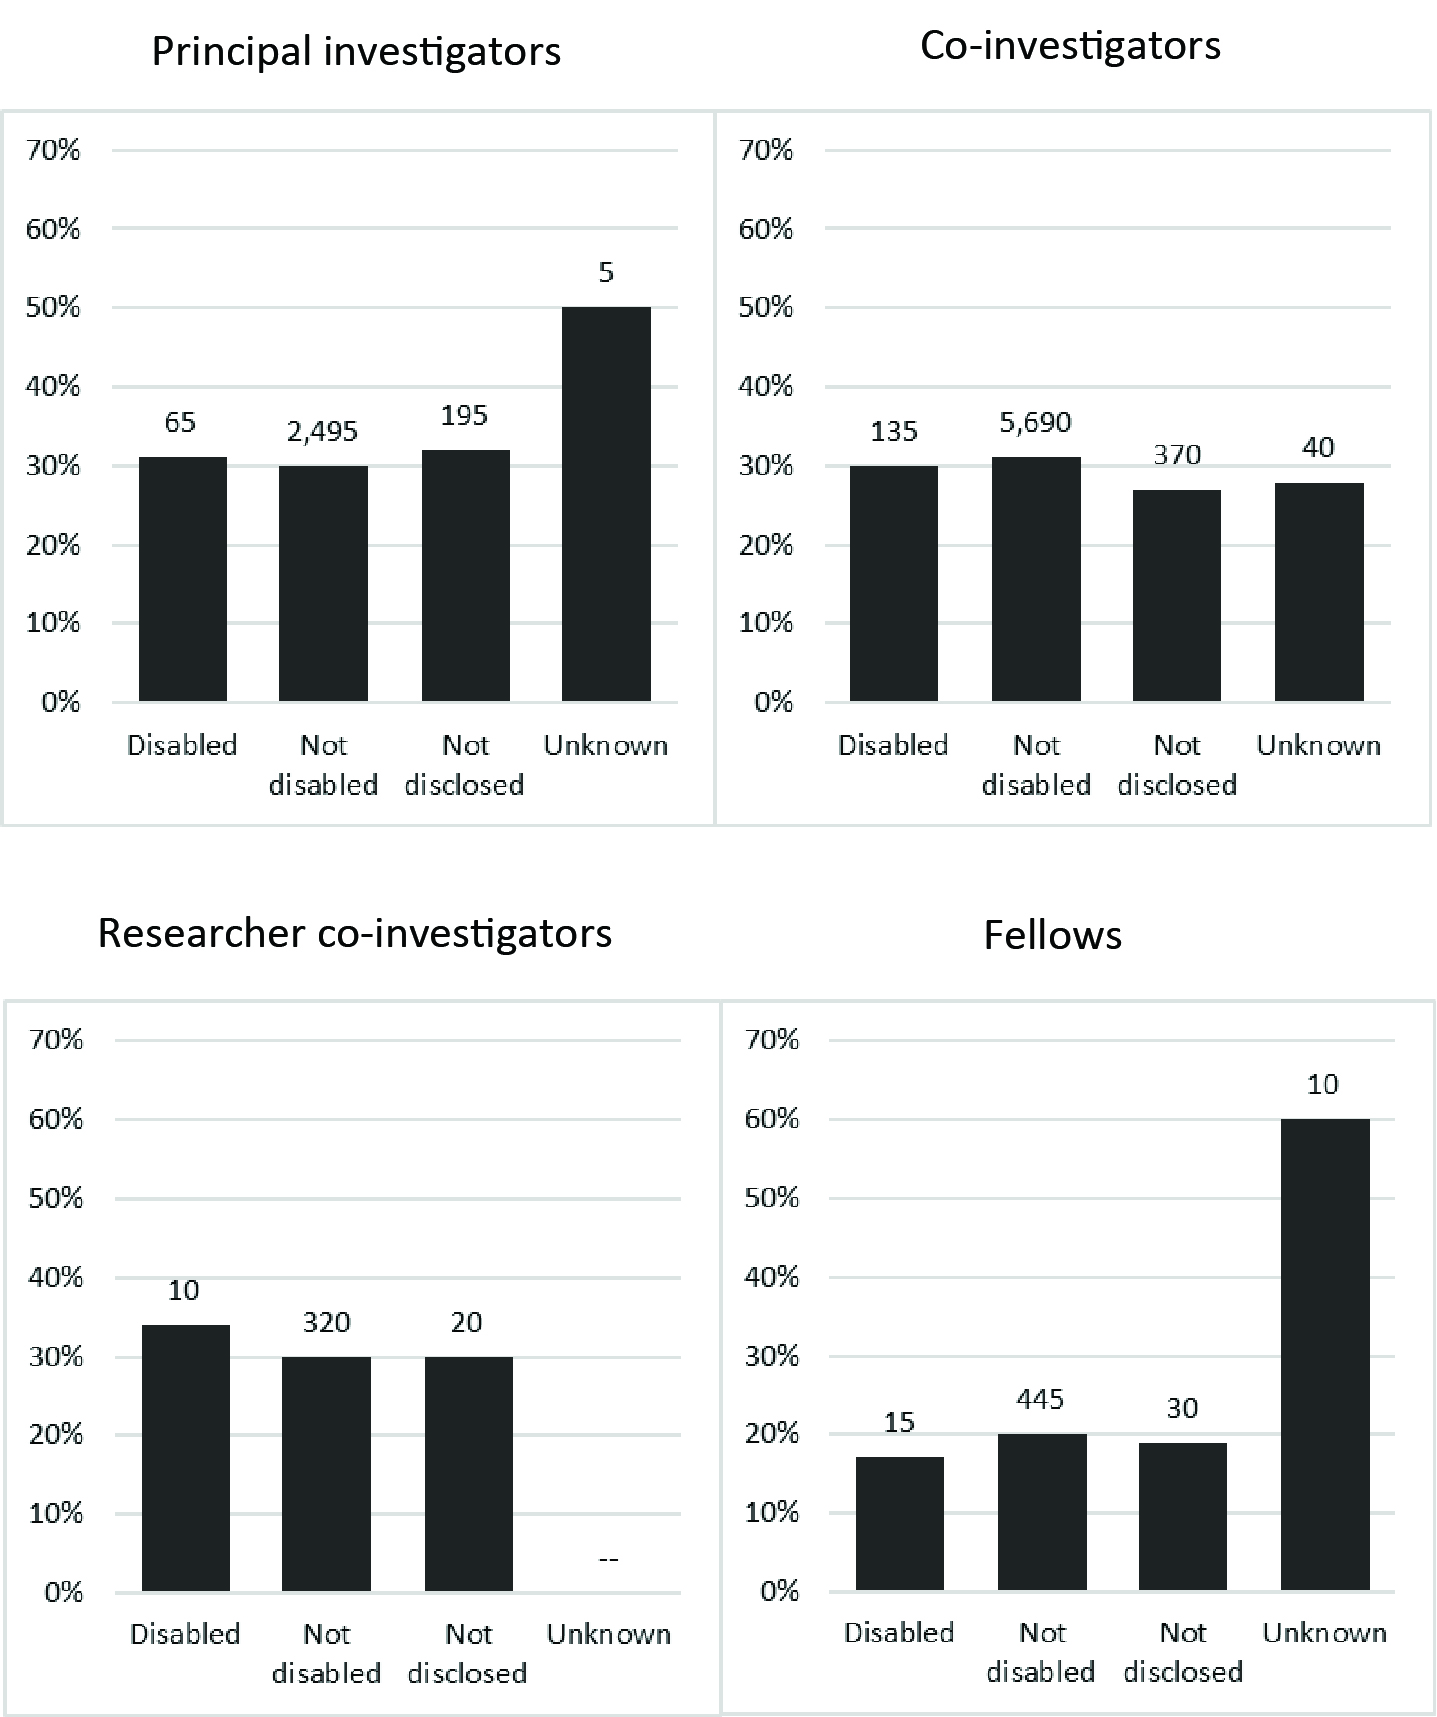
Description of figure 4: these four bar charts show that award rates were broadly similar for those who declared a disability and those who did not, for all role types.
Source: UKRI diversity data.
Download the data for figure 4 (ODS, 4KB).
Notes:
- rates for groups comprising fewer than five individuals are not reported
- numbers above the bars represent the number of awardees
Council award rate
For principal investigators, award rates were higher for applicants reporting a disability at NERC (40%), AHRC (34%) and BBSRC (27%; table 6) than those not reporting a disability in the same council.
For fellows, award rates were higher for applicants reporting a disability at ESRC (80%; n=45) and EPSRC (24%; n=40; table 7) than those not reporting a disability in the same council.
See what is included for a note on high ESRC and STFC award rates. For more information on council breakdowns, see the data dashboard.
Table 6: Principal investigators with reported disabilities had higher award rates at NERC, AHRC and BBSRC compared to those without disabilities in the same councils
| Award rate | Disabled | Not disabled | Not disclosed | Unknown | ||
|---|---|---|---|---|---|---|
| AHRC | 34% | 29% | 30% | [c] | ||
| BBSRC | 27% | 26% | 27% | 41% | ||
| EPSRC | 28% | 31% | 29% | 39% | ||
| ESRC | 18% | 24% | 24% | 35% | ||
| MRC | 15% | 21% | 23% | [c] | ||
| NERC | 40% | 27% | 27% | [c] | ||
| STFC | 58% | 67% | 65% | [c] | ||
| Cross-UKRI | 23% | 28% | 27% | [w] | ||
| UKRI overall | 28% | 28% | 28% | 31% |
Notes:
- award rate by disability status for principal investigators by council, cross-UKRI, and UKRI overall (five-year cumulative, from the 2017 to 2018 financial year to the 2021 to 2022 financial year)
- ‘[c]’ means the value has been suppressed
- ‘[w]’ is used during suppression to show values for groups where there were no awardees
Table 7: fellows with reported disabilities had higher award rates at ESRC and EPSRC compared to those without disabilities in the same councils
| Award rate | Disabled | Not disabled | Not disclosed | Unknown |
|---|---|---|---|---|
| AHRC | 23% | 29% | 20% | [c] |
| BBSRC | [w] | 11% | [c] | [c] |
| EPSRC | 24% | 22% | 27% | [c] |
| ESRC | 80% | 72% | 68% | 85% |
| MRC | 20% | 22% | 28% | 29% |
| NERC | [c] | 14% | 23% | [c] |
| STFC | [c] | 9% | [c] | [c] |
| Cross-UKRI | 17% | 15% | 17% | [c] |
| UKRI overall | 26% | 21% | 23% | 28% |
Notes:
- award rate by disability status for fellows by council, cross-UKRI, and UKRI overall (five-year cumulative, from the 2017 to 2018 financial year to the 2021 to 2022 financial year)
- ‘[c]’ means the value has been suppressed
- ‘[w]’ is used during suppression to show values for groups where there were no awardees
Median award amount
For UKRI overall, the median award amount for principal investigators and fellows with a disability is lower than those with no known disability for all financial years since 2017 to 2018 (tables 8 and 9).
The difference for fellows is particularly high, especially in 2020 to 2021 and 2021 to 2022 (table 8). There are often a low number of disabled fellows, only 15 awardees in total for 2021 to 2022, and 80 awardees cumulatively from the 2017 to 2018 financial year to the 2021 to 2022 financial year.
The award value for different fellowship types across councils varies considerably. Please see the accompanying dashboard for council breakdowns.
Table 8: since 2017 to 2018, principal investigators with disabilities consistently received lower median award amounts compared to those without disabilities
| Award rate | Disabled | Not disabled | Not disclosed | Unknown |
|---|---|---|---|---|
| 2017-2018 | £271,000 | £343,000 | £306,000 | £329,000 |
| 2018-2019 | £344,000 | £368,000 | £386,000 | £277,000 |
| 2019-2020 | £200,000 | £363,000 | £360,000 | [c] |
| 2020-2021 | £326,000 | £387,000 | £341,000 | [c] |
| 2021-2022 | £274,000 | £372,000 | £289,000 | £222,000 |
Notes:
- median award amount for principal investigators by disability status
- UKRI overall, yearly, from the 2017 to 2018 financial year to the 2021 to 2021 financial year
- ‘[c]’ means the value has been suppressed
Table 9: the median award amount for fellows with and without disabilities is volatile and varies considerably across years
| Award rate | Disabled | Not disabled | Not disclosed | Unknown |
|---|---|---|---|---|
| 2017-2018 | £286,000 | £299,000 | £286,000 | [c] |
| 2018-2019 | £192,000 | £290,000 | £420,000 | [c] |
| 2019-2020 | £201,000 | £344,000 | £537,000 | [c] |
| 2020-2021 | £140,000 | £659,000 | £848,000 | [c] |
| 2021-2022 | £105,000 | £391,000 | £454,000 | £105,000 |
Notes:
- median award amount for fellows by disability status
- UKRI overall, yearly, from the 2017 to 2018 financial year to the 2021 to 2021 financial year
- ‘[c]’ means the value has been suppressed
Ethnicity
Applicant composition
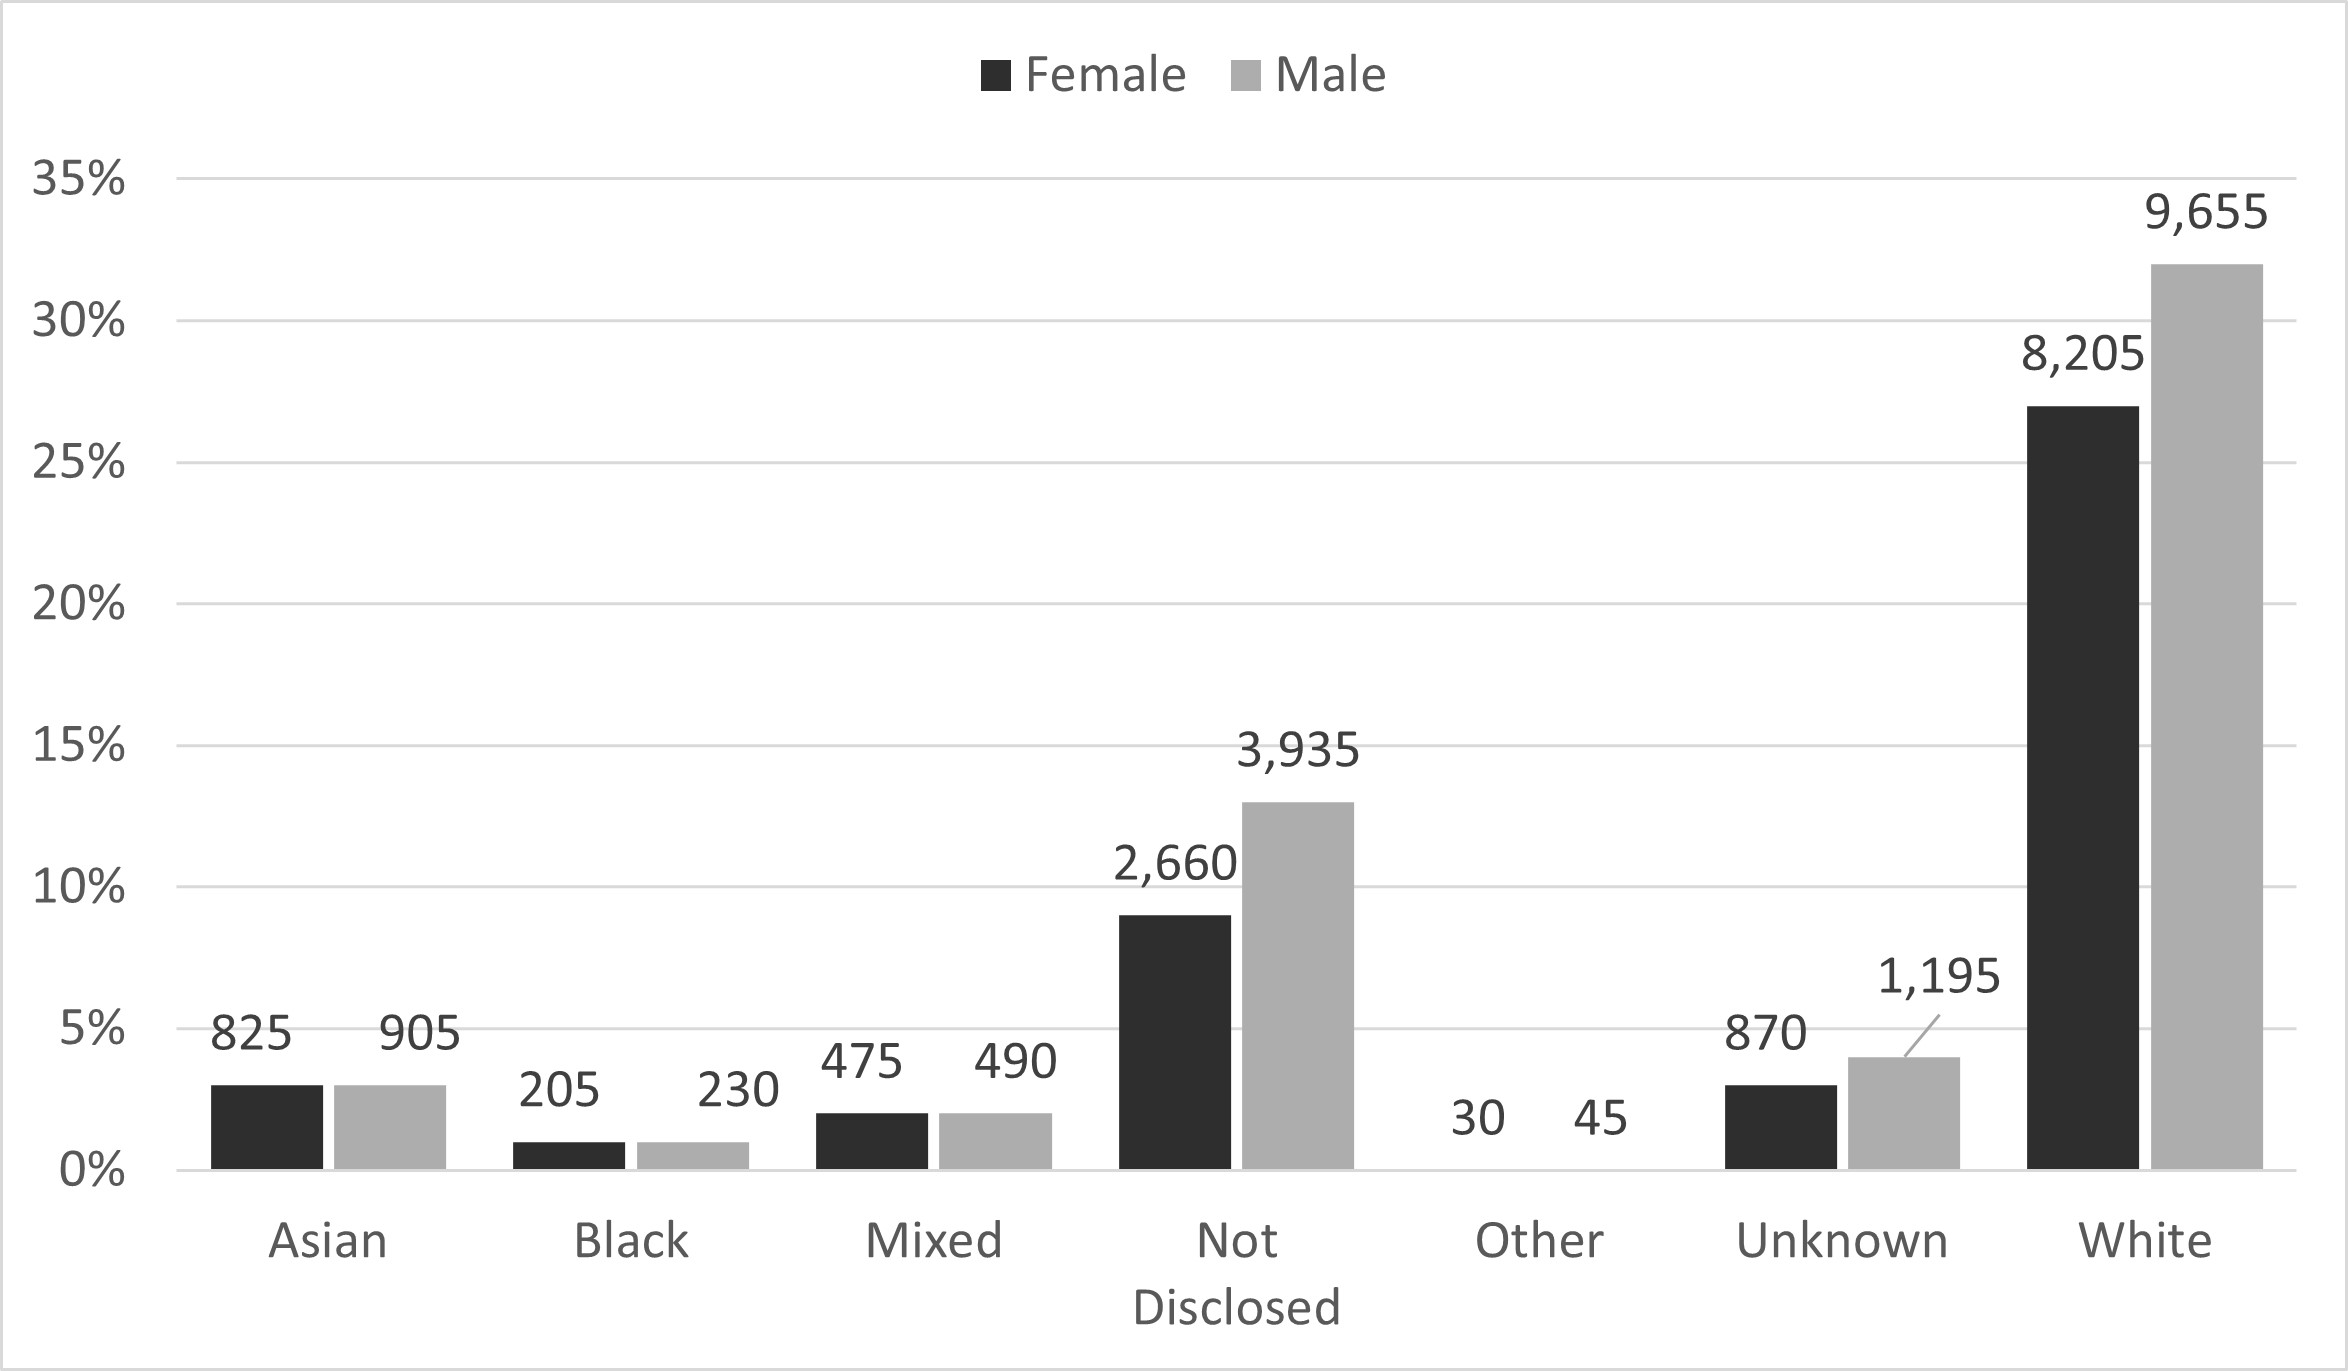
Figure 5 shows the overall applicant composition of UKRI applicants by ethnic group and role type, 2021 to 2022. Most applicants for all role types were White. Excluding White, the largest proportion of applicants for all role types were from the combined Asian ethnic group.
Figure 5: UKRI applicant ethnicity composition by role, 2021 to 2022
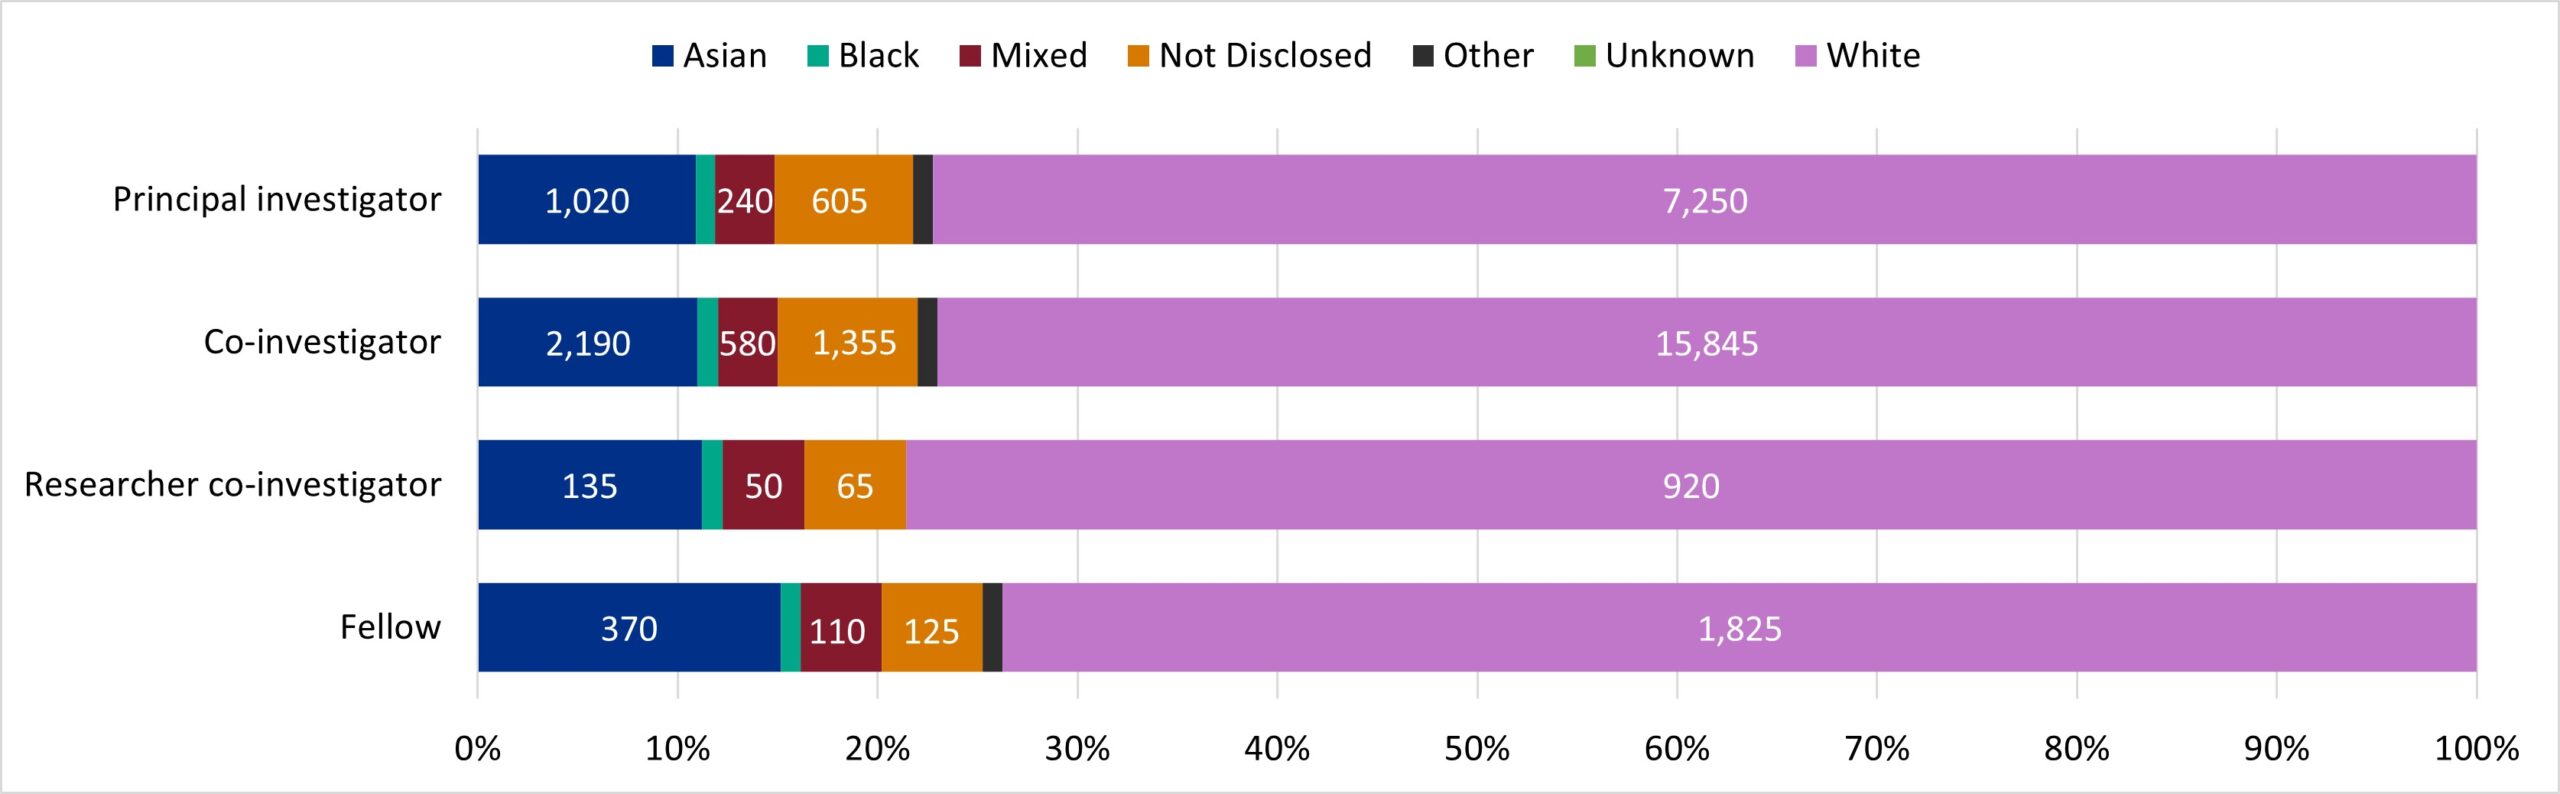
Description of figure 5: this stacked bar chart shows that most applicants are White for all role types. The proportion of White applicants is very similar for principal investigators, co-investigators and researcher co-investigators, but slightly lower for fellows.
Source: UKRI diversity data.
Download the data for figure 5 (ODS, 4KB).
Notes:
- labels represent the number of applicants
- counts in groups with less than 2% of the annual role total are not labelled
UKRI award rate
For principal investigators applying to UKRI in 2021 to 2022, White applicants had a significantly higher award rate than both Asian and Black applicants. Asian co-investigator applicants also had a significantly lower award rate than White co-investigators applicants in 2021 to 2022.
Figure 6 shows the award rate by ethnic group. Where the difference in award rates between two specific ethnicities is significant according to the statistical test, this is presented in table 10.
The relationship between the award rates of White and Asian ethnicities is highly significant (table 10).
Note that the undisclosed and unknown ethnicities have been removed from table 10 for easier comprehension, but there were significant interactions between undisclosed and unknown ethnicities and other ethnic groups for principal investigators, co-investigators, and fellows.
Detail on all significant interactions for the four role types and seven ethnicity categories are available in the technical annex.
Figure 6: UKRI award rate by ethnic group and role type, 2021 to 2022
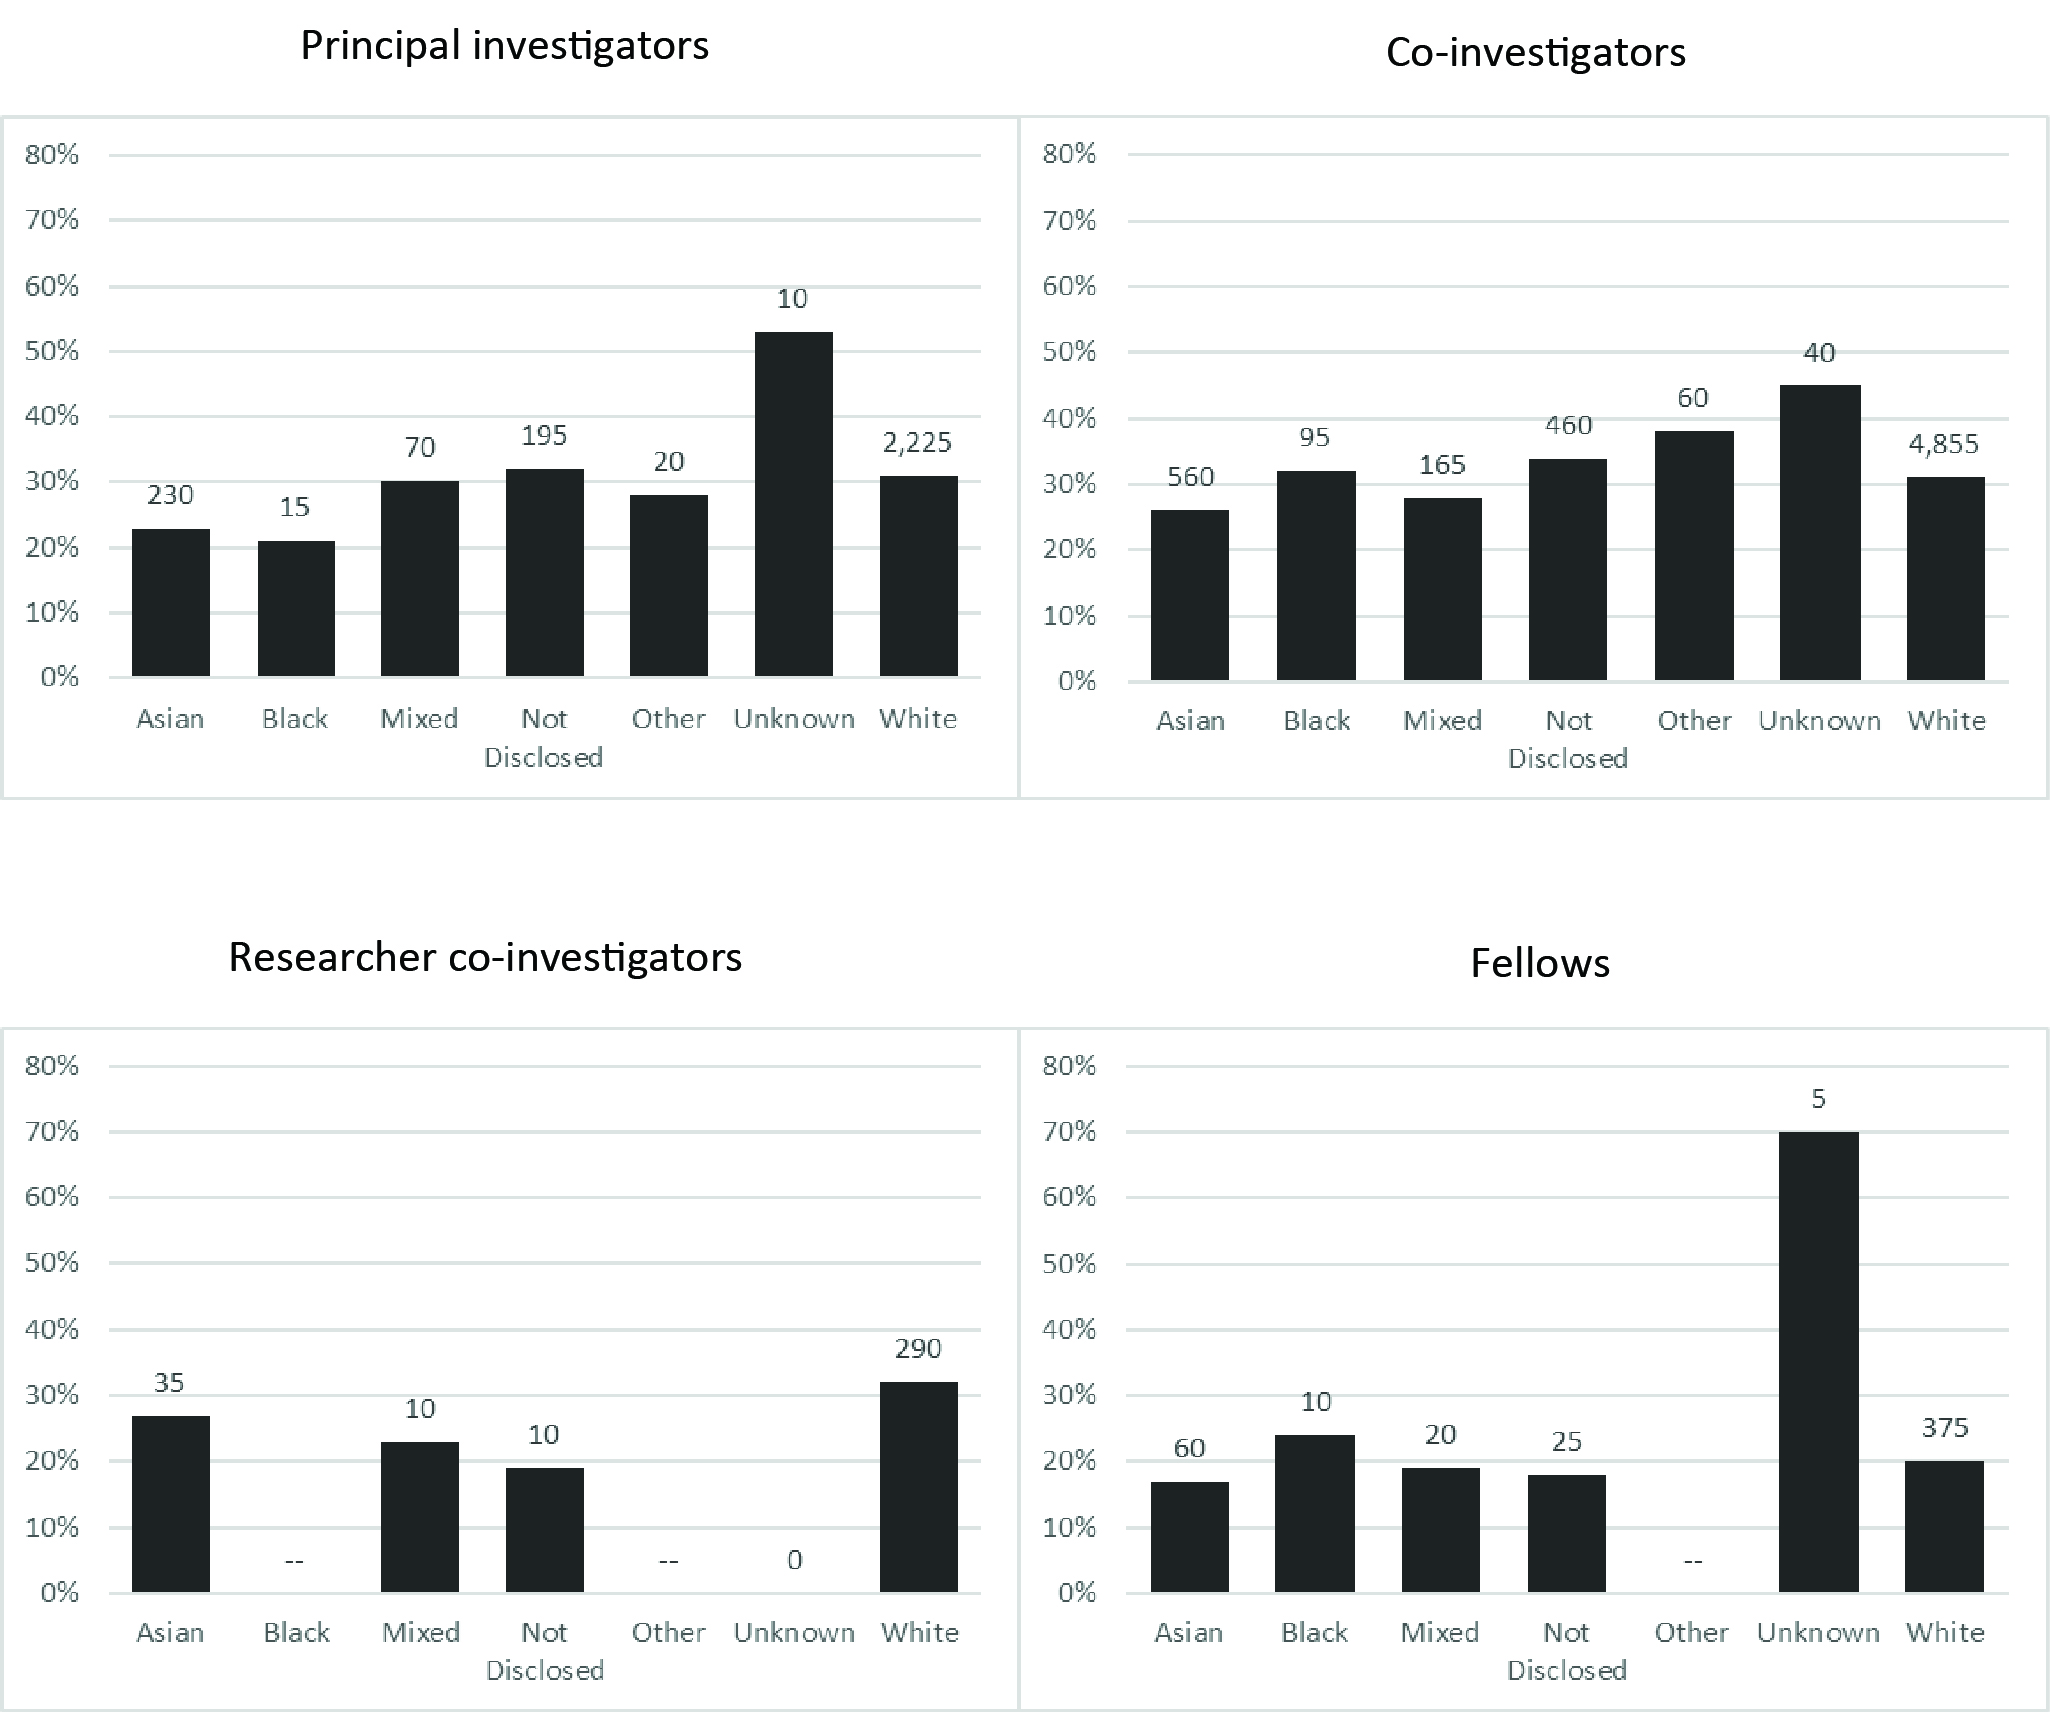
Description of figure 6: these four bar charts show that the award rate for White principal investigators and co-investigators was higher than the award rate for Black and Asian principal investigators and co-investigators.
Source: UKRI diversity data.
Download the data for figure 6 (ODS, 4KB).
Notes:
- rates for groups comprising fewer than five individuals are not reported
- numbers above the bars represent the number of awardees
Table 10: for principal investigators applying to UKRI in 2021 to 2022, White applicants had a significantly higher award rate than both Asian and Black applicants
| Role | Ethnicity 1 | Ethnicity 2 | Recorded award rate difference | Adjusted significance |
|---|---|---|---|---|
| Co-investigator | Black | Asian | 7% | 0.04 |
| Co-investigator | Other | Asian | 12% | 0.01 |
| Co-investigator | Other | Mixed | 9% | 0.04 |
| Co-investigator | White | Asian | 5% | 0.00 |
| Principal investigator | Mixed | Asian | 7% | 0.04 |
| Principal investigator | White | Asian | 8% | 0.00 |
| Principal investigator | White | Black | 10% | 0.02 |
Notes:
- significant relationships between ethnicity award rates, based on permutation tests with a 95% range, 2021 to 2022
- unknown and undisclosed ethnicities are not shown
- the award rate difference equals category 1 minus category 2
- all values are adjusted for multiple testing, see methodology for more information
Interpretation
Statistical significance and relationships between ethnic groups and award rates should not necessarily be interpreted as an indicator of direct bias. There is high intersectionality of different characteristics and other factors that are not accounted for in the statistical testing. For more details related to the statistical approach, see the technical annex.
For UKRI investments, those making the funding decisions do not see an applicant’s diversity information. We are working hard through several means to ensure we address any systemic biases, promote diversity in decision-making bodies, and provide equal opportunities for all researchers who apply to UKRI. For example, we are developing and implementing a new narrative CV, known as the Resume for Research and Innovation (R4RI).
The R4RI is designed to allow applicants to provide a broader range of evidence of their contributions to research and innovation, supporting career path diversity. It is part of the wider UKRI ambition to create a more inclusive and supportive research and innovation culture.
NERC is trialling a new approach to peer review and assessment where the award for grants receiving similar scores near the borderline for funding is allocated using a randomised approach. These trials are part of our evidence-based approach to identifying and addressing sources of inequality in our funding processes.
EPSRC have launched New Horizons, a series of funding opportunities which use double blind postal peer review to help remove bias from the assessment process. We published a review of peer review in July 2023, and we will be using the findings and recommendations to evolve our peer review processes.
These, and further steps outlined in the UKRI EDI strategy, are designed to move us towards understanding and addressing disparities in funding award rates. This is only part of the challenge, given the under-representation of people with protected characteristics in the applicant pool. Achieving meaningful change requires a collective effort from institutions, funders, researchers, and society as a whole.
Council award rate
For principal investigators, there is high variation in award rates across different councils within each ethnic group (table 11). For all councils, most of the principal investigator awardees were White (table 12). There were more principal investigator awardees who did not disclose their ethnicity than principal investigators who disclosed they were Black or Mixed for all research councils (table 12).
We recognise and respect that applicants have a choice about the data they disclose. Our EDI action plans set out the actions we are taking to improve reporting.
Table 11: there is high variation in award rates across different councils within each ethnic group
| Award rate | Asian | Black | Mixed | Not disclosed | Other | Unknown | White |
|---|---|---|---|---|---|---|---|
| AHRC | 30% | 13% | 33% | 32% | 33% | [c] | 29% |
| BBSRC | 18% | [c] | 21% | 30% | 17% | 31% | 27% |
| EPSRC | 25% | 15% | 30% | 29% | 16% | 34% | 33% |
| ESRC | 14% | 12% | 20% | 23% | 22% | 23% | 26% |
| MRC | 18% | 11% | 19% | 19% | 18% | [c] | 23% |
| NERC | 14% | [c] | 26% | 30% | [c] | [c] | 28% |
| STFC | 68% | [c] | 61% | 72% | [c] | [c] | 66% |
| Cross-UKRI | 21% | 21% | 31% | 25% | [c] | [c] | 30% |
| UKRI overall | 21% | 13% | 26% | 30% | 19% | 25% | 30% |
Notes:
- award rate by ethnicity for principal investigators by council, cross-UKRI, and UKRI overall (five-year cumulative, from the 2017 to 2018 financial year to the 2021 to 2022 financial year)
- ‘[c]’ means the value has been suppressed
Table 12: most principal investigator awardees were White for all councils
| Award rate | Asian | Black | Mixed | Not disclosed | Other | Unknown | White |
|---|---|---|---|---|---|---|---|
| AHRC | 65 | 10 | 55 | 135 | 5 | [c] | 1,025 |
| BBSRC | 105 | [c] | 30 | 140 | 5 | 10 | 1,880 |
| EPSRC | 460 | 15 | 70 | 230 | 15 | 10 | 2,890 |
| ESRC | 80 | 10 | 35 | 90 | 10 | 5 | 1,065 |
| MRC | 175 | 25 | 40 | 90 | 10 | [c] | 1,305 |
| NERC | 50 | [c] | 25 | 130 | [c] | [c] | 1,265 |
| STFC | 45 | [c] | 15 | 150 | [c] | [c] | 970 |
| Cross-UKRI | 40 | 15 | 20 | 35 | [c] | [c] | 405 |
| UKRI overall | 1,015 | 75 | 285 | 1,000 | 50 | 40 | 10,800 |
Notes:
- number of awardees by ethnicity for principal investigators by council, cross-UKRI, and UKRI overall (five-year cumulative, from the 2017 to 2018 financial year to the 2021 to 2022 financial year)
- ‘[c]’ means the value has been suppressed
Median award amount
For UKRI overall, the median award amount varies across the ethnic groups. From the 2019 to 2020 financial year to the 2021 to 2022 financial year, excluding unknown, Black principal investigators have had a lower median award amount than the other ethnic groups, while White and Asian principal investigators had the highest (table 13).
Award rate by value also varies across the ethnicities. Award rate by value for Black principal investigators rose from 8% in 2019 to 2020 and 6% in 2020 to 2021, to 23% in 2021 to 2022 (table 14). Values by council are suppressed due to small numbers. It is therefore difficult to assess any contribution to these differences from the distribution of applicant ethnicity between research councils, which have very different success rates (see table 11).
Table 13: from the 2019 to 2020 financial year to the 2021 to 2022 financial year, excluding unknown, Black principal investigators have had a lower median award amount than the other ethnic groups, while White and Asian principal investigators had the highest
| Median award amount | Asian | Black | Mixed | Not disclosed | Other | Unknown | White |
|---|---|---|---|---|---|---|---|
| 2017-2018 | £279,000 | £322,000 | £270,000 | £302,000 | £365,000 | £354,000 | £349,000 |
| 2018-2019 | £355,000 | £325,000 | £356,000 | £339,000 | £100,000 | £585,000 | £374,000 |
| 2019-2020 | £343,000 | £159,000 | £304,000 | £360,000 | £279,000 | £375,000 | £362,000 |
| 2020-2021 | £375,000 | £150,000 | £303,000 | £364,000 | £279,000 | £556,000 | £391,000 |
| 2021-2022 | £358,000 | £186,000 | £238,000 | £339,000 | £279,000 | £198,000 | £381,000 |
Notes:
- median award amount for principal investigators by ethnicity
- UKRI overall, yearly, from the 2017 to 2018 financial year to the 2021 to 2022 financial year
Table 14: the award rate by value for Black principal investigators increased markedly from 2020-2021 to 2021-2022
| Median award amount | Asian | Black | Mixed | Not disclosed | Other | Unknown | White |
|---|---|---|---|---|---|---|---|
| 2017-2018 | 24% | 12% | 30% | 35% | 17% | 39% | 35% |
| 2018-2019 | 16% | 10% | 26% | 30% | 7% | 26% | 30% |
| 2019-2020 | 29% | 8% | 31% | 29% | 13% | 57% | 32% |
| 2020-2021 | 26% | 6% | 25% | 32% | 9% | 17% | 31% |
| 2021-2022 | 31% | 23% | 28% | 32% | 28% | 47% | 32% |
Notes:
- award rate by value for principal investigators by ethnicity
- UKRI overall, yearly, from the 2017 to 2018 financial year to the 2021 to 2022 financial year
- award rate by value is the value of the total amount awarded as a percentage of the total amount applied for
Gender
Applicant composition
Most applicants to UKRI funding were male in 2021 to 2022 (figure 7). 68% of principal investigators, 64% of co-investigators, 58% of fellows and 53% of researcher co-investigators were male in 2021 to 2022 (figure 7).
The number of applicants choosing not to disclose their gender is lower than the other characteristics, at only 1 to 2% across roles.
Figure 7: UKRI applicant gender by role, 2021 to 2022
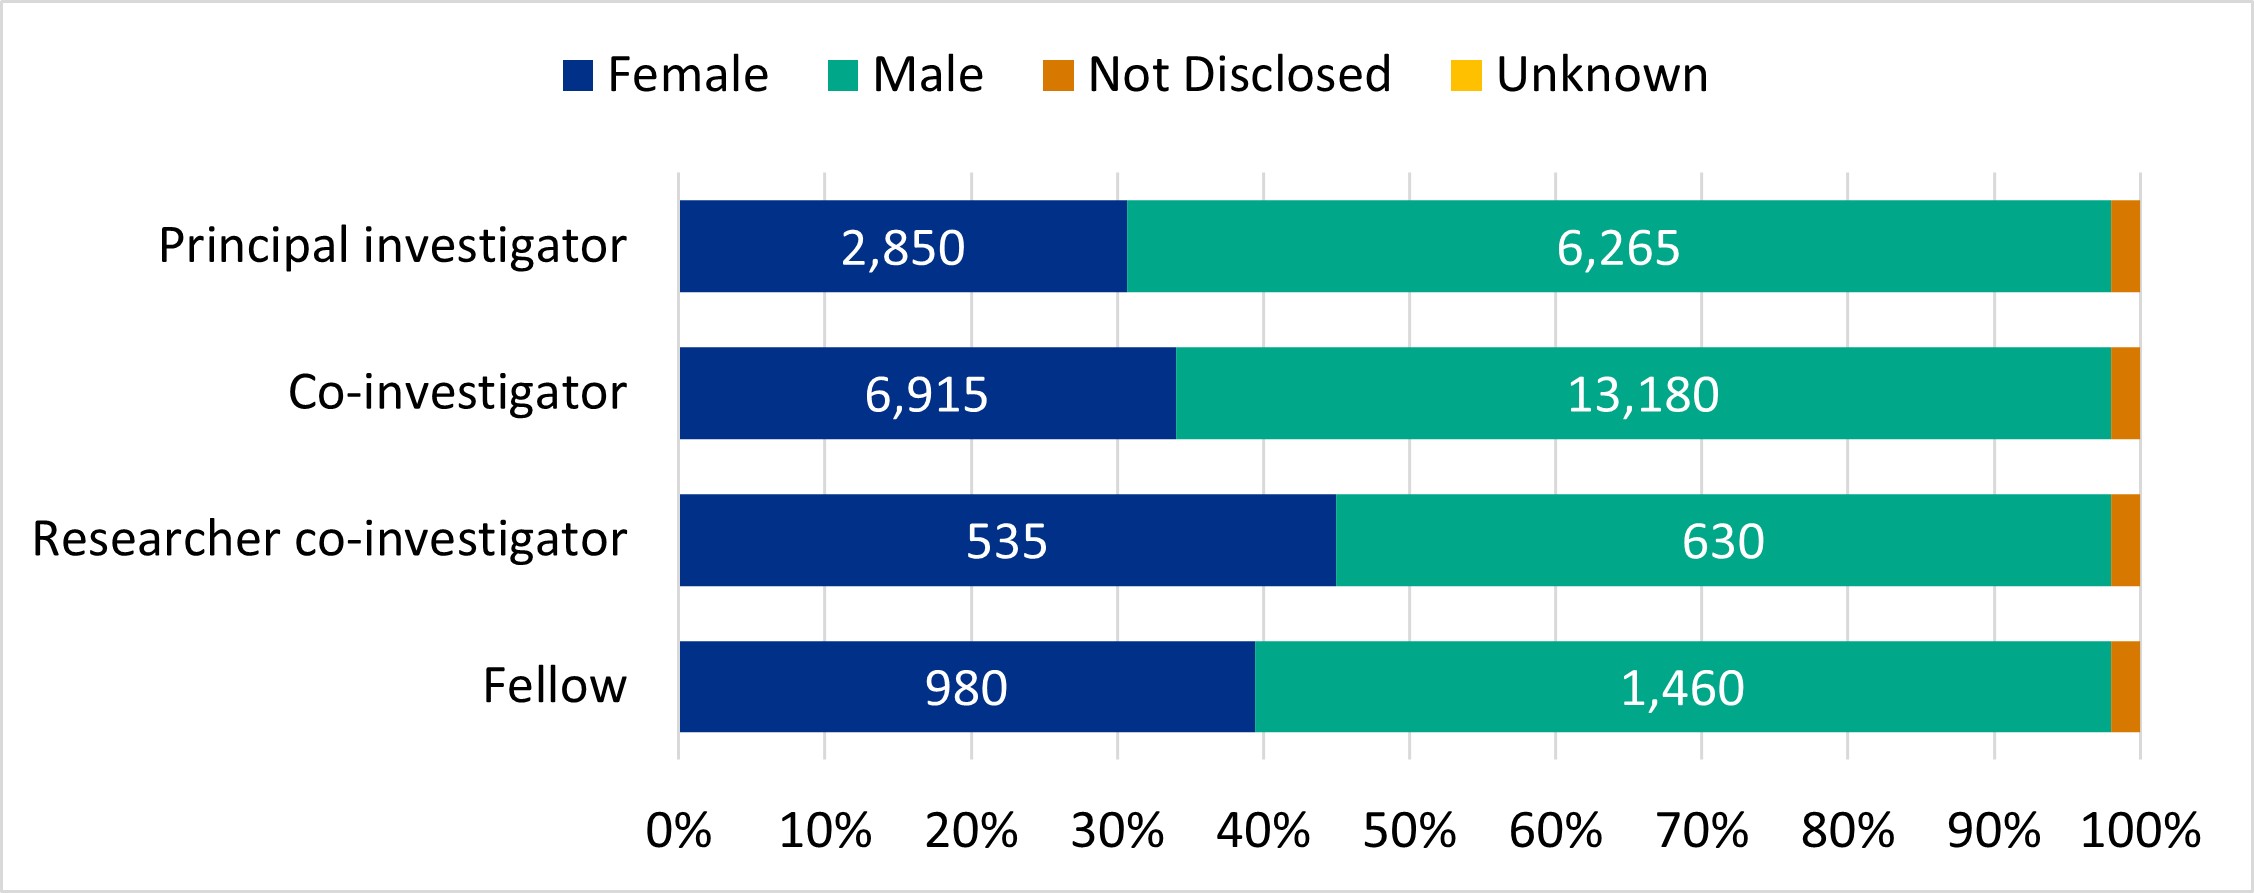
Description of figure 7: this stacked bar chart shows that there were more male applicants than female applicants in all role types.
Source: UKRI diversity data.
Download the data for figure 7 (ODS, 4KB).
Notes:
- labels represent the number of applicants
- counts in groups with less than 2% of the annual role total are not labelled
UKRI award rate
For fellows applying to UKRI in 2021 to 2022, female applicants had a significantly higher award rate than their male counterparts.
Figure 8 shows the award rate by gender. Where the difference in award rates between gender is significant according to the statistical test, this is presented in table 15. The relationship between the award rates of female and male fellows is highly significant (table 15).
Female fellows had a higher award rate than their male counterparts in all financial years since 2017 to 2018 (figure 9). Most ESRC fellow applicants are female, so their high success rates will affect this interaction, however, this is a fair representation of the application process. Female fellows had higher award rates in every council, not just ESRC. The difference in award rate between male and female applicants was not significant across the other role types.
Figure 8: UKRI award rate by gender and role type, 2021 to 2022
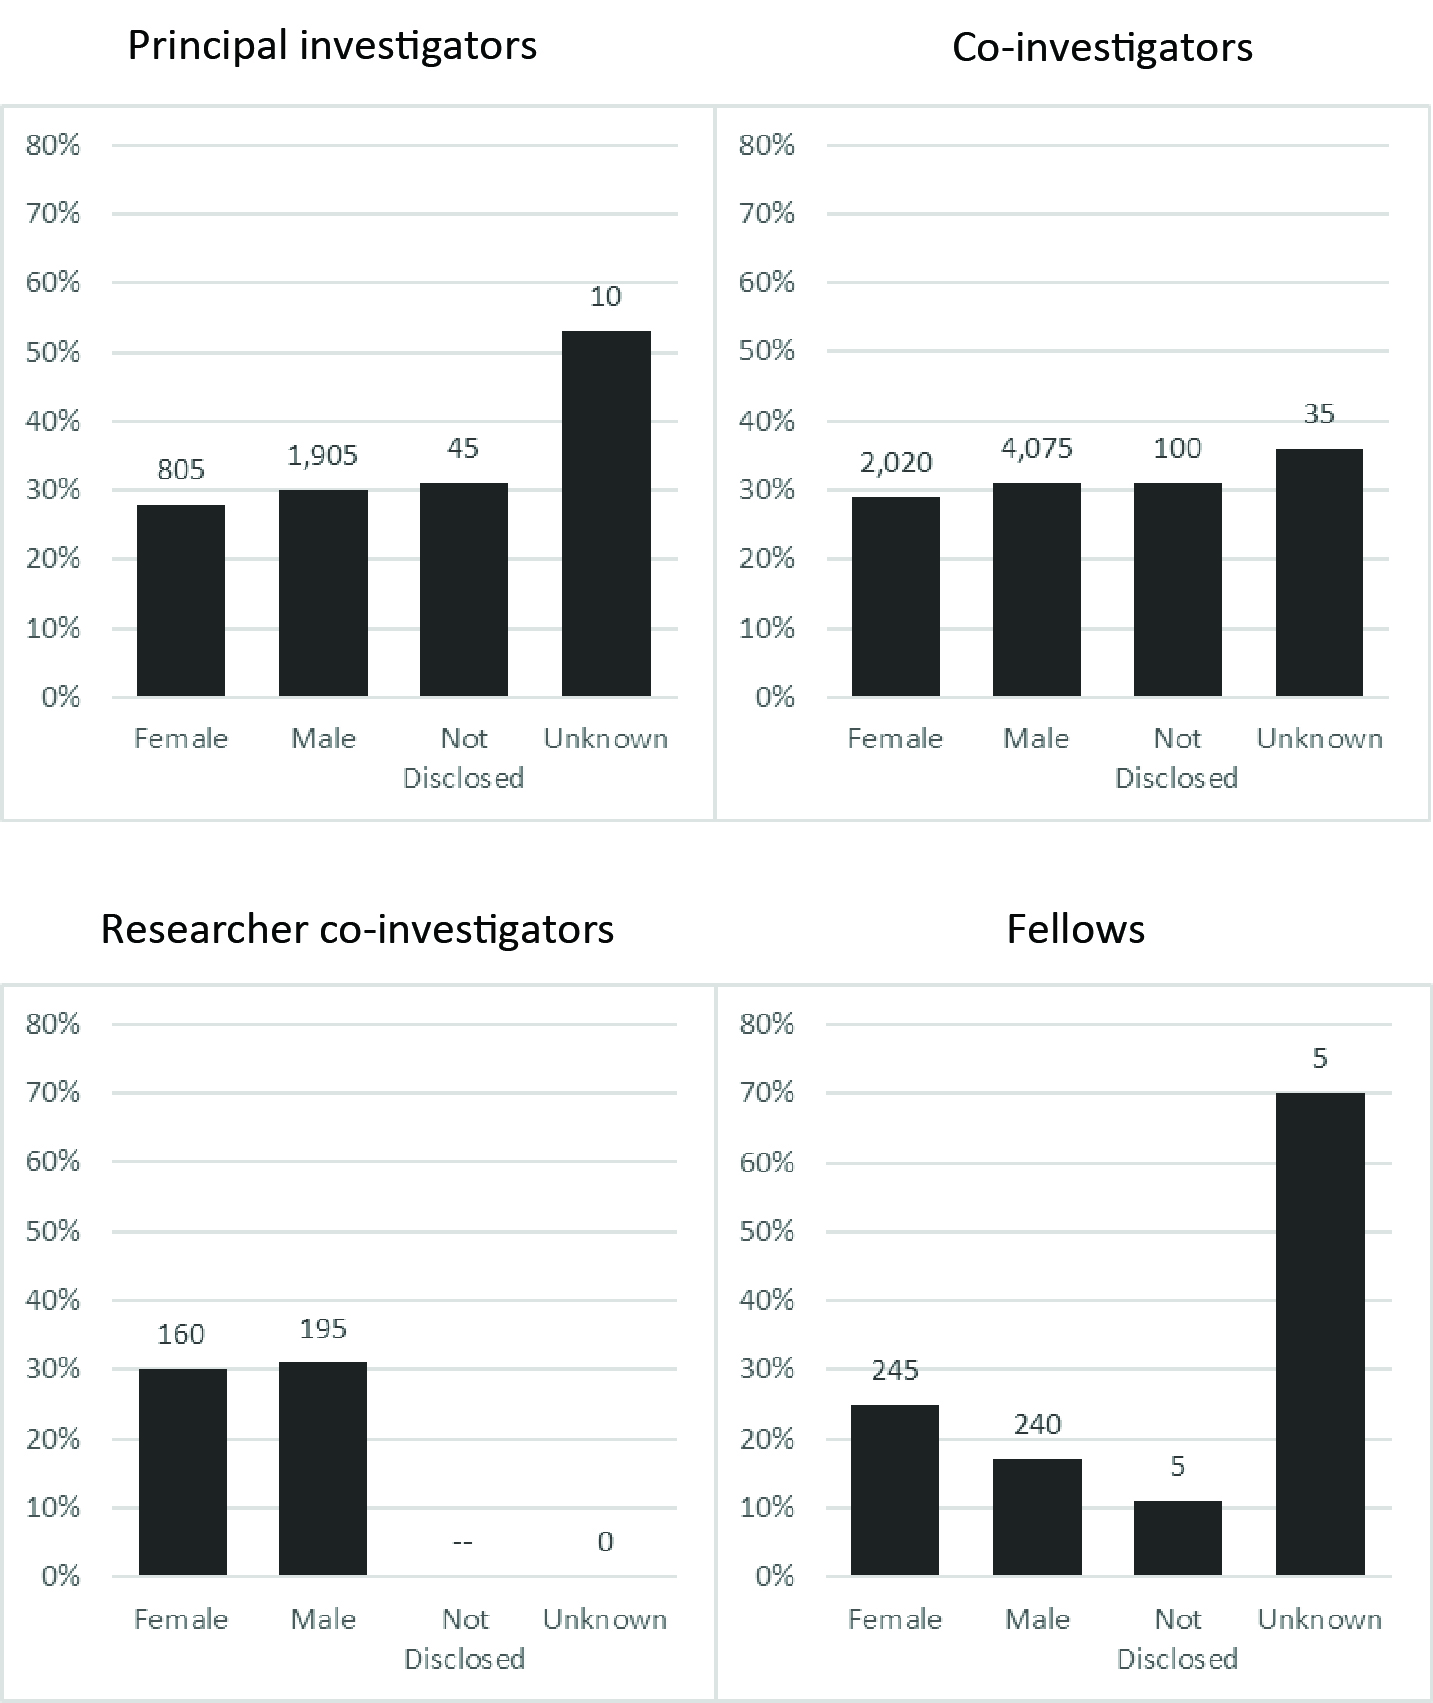
Description of figure 8: these four bar charts show that the award rate for male and female awardees was broadly similar for all role types except fellows. For fellows, the award rate is higher for female awardees than male awardees.
Source: UKRI diversity data.
Download the data for figure 8 (ODS, 4KB).
Notes:
- rates for groups comprising fewer than five individuals are not reported
- numbers above the bars represent the number of awardees
Table 15: for fellows applying to UKRI in 2021 to 2022, female applicants had a significantly higher award rate than their male counterparts
| Role | Category 1 | Category 2 | Recorded award rate difference | Adjusted significance |
|---|---|---|---|---|
| Fellow | Male | Female | -8% | 0.00 |
| Fellow | Not Disclosed | Female | -14% | 0.04 |
Notes:
- significant relationships between gender award rates, based on permutation tests with a 95% range
- fellows only, 2021 to 2022
- the award rate difference equals category 1 minus category 2
- all values are adjusted for multiple testing, see methodology for more information
- results for unknown gender are not shown
Figure 9: UKRI award rate by gender for fellows, from the 2017 to 2018 financial year to the 2021 to 2022 financial year
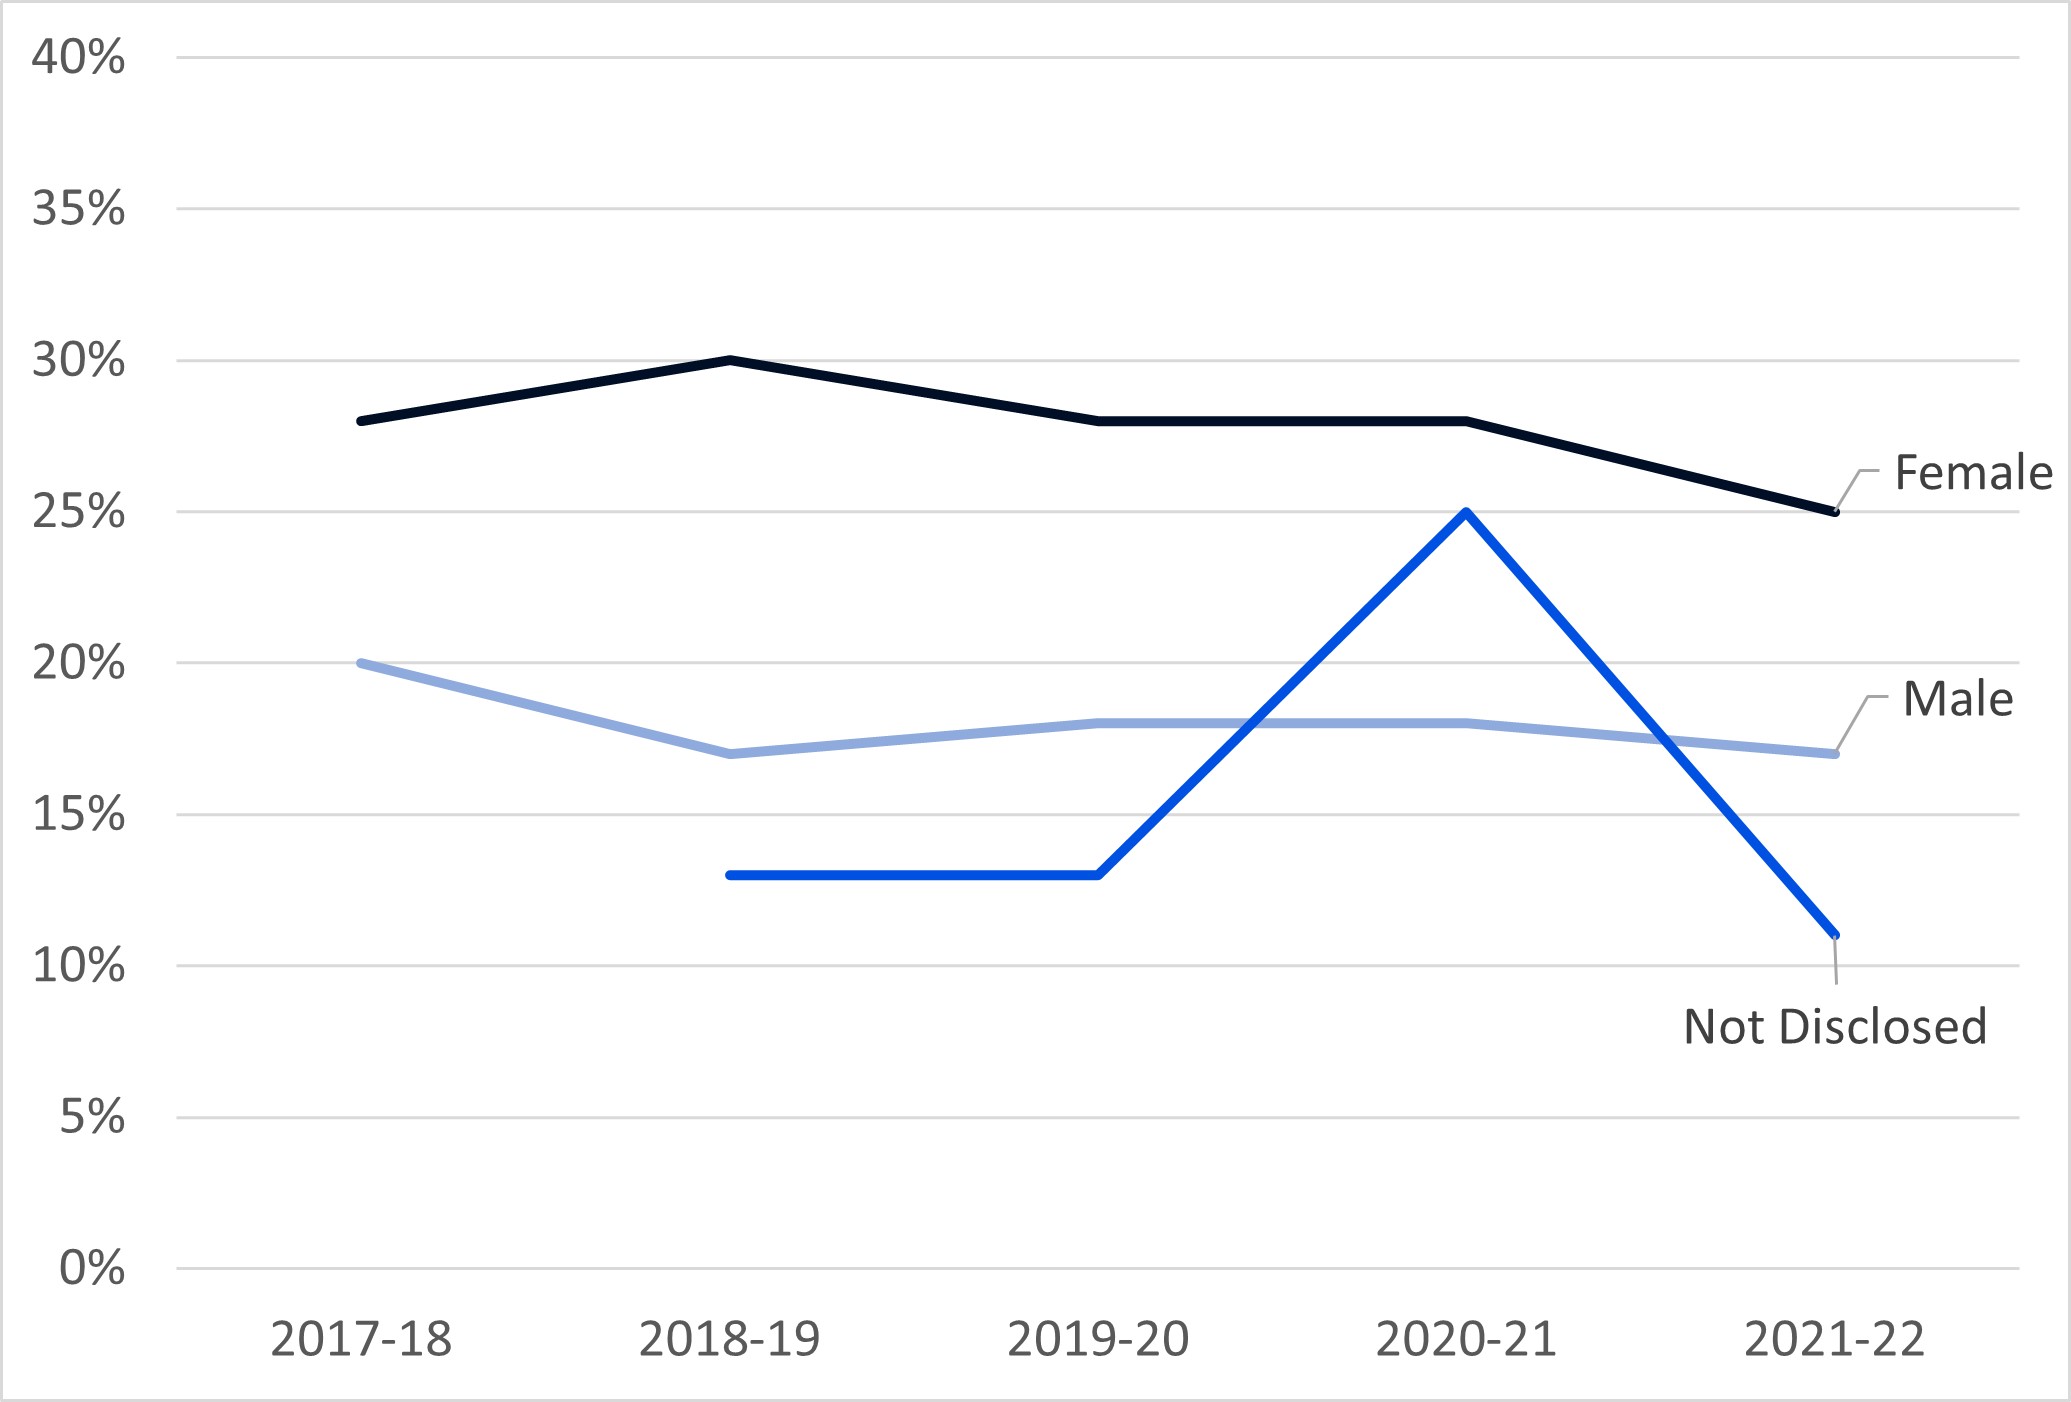
Description of figure 9: this line chart shows that female fellows have had a higher award rate than male fellows in all financial years since 2017 to 2018.
Source: UKRI diversity data.
Download the data for figure 9 (ODS, 4KB).
Notes:
- rates for groups comprising fewer than five individuals are not reported
- other rates are rounded to the nearest 1%
- rates for ‘unknown’ are suppressed
Council award rate
Looking at award rate for principal investigators by council cumulatively, female applicants had a higher chance of success than their male counterparts in STFC (67%), EPSRC (32%), AHRC (31%) and cross-UKRI (30%) (table 16).
Female fellows had a higher award rate than males in every council as well as UKRI overall (28%; table 16).
Table 16: female applicants had a higher chance of success than their male counterparts in STFC, EPSRC, and AHRC
| Award rate | Female | Male | Not disclosed | Unknown |
|---|---|---|---|---|
| AHRC | 31% | 28% | 27% | [c] |
| BBSRC | 24% | 27% | 25% | 29% |
| EPSRC | 32% | 31% | 28% | 38% |
| ESRC | 23% | 25% | 31% | 24% |
| MRC | 21% | 21% | 27% | 14% |
| NERC | 24% | 28% | 30% | [c] |
| STFC | 67% | 66% | 68% | [c] |
| Cross-UKRI | 30% | 27% | 31% | [c] |
| UKRI overall | 27% | 29% | 30% | 27% |
Notes:
- award rate by ethnicity for principal investigators by council, cross-UKRI, and UKRI overall (five-year cumulative, from the 2017 to 2018 financial year to the 2021 to 2022 financial year)
- ‘[c]’ means the value has been suppressed
Table 17: Female fellows had a higher award rate than males in every council as well as UKRI overall
| Award rate | Female | Male | Not disclosed | Unknown |
|---|---|---|---|---|
| AHRC | 34% | 24% | [c] | 0% |
| BBSRC | 11% | 10% | [c] | [c] |
| EPSRC | 35% | 20% | 22% | [c] |
| ESRC | 80% | 60% | 69% | 80% |
| MRC | 25% | 21% | [c] | [c] |
| NERC | 17% | 13% | [c] | [c] |
| STFC | 10% | 9% | [w] | [c] |
| Cross-UKRI | 17% | 14% | 14% | [c] |
| UKRI overall | 28% | 18% | 15% | 31% |
Notes:
- award rate by ethnicity for fellows by council, cross-UKRI, and UKRI overall (five-year cumulative, from the 2017 to 2018 financial year to the 2021 to 2022 financial year)
- ‘[c]’ means the value has been suppressed
- ‘[w]’ is used during suppression to show values for groups where there were no awardees
Median award amount
For principal investigators, the median award amount and award rate by value for male applicants was higher than female applicants for all years since 2017 to 2018 (table 18).
The median award amount for male fellows was over three times more than female fellows in 2020 to 2021, and over twice more in 2021 to 2022 (table 19).
Table 18: the median award amount for male applicants was higher than female applicants for all years
| Median award amount | Female | Male | Not disclosed | Unknown |
|---|---|---|---|---|
| 2017-2018 | £291,000 | £352,000 | £159,000 | £345,000 |
| 2018-2019 | £317,000 | £383,000 | £312,000 | £277,000 |
| 2019-2020 | £268,000 | £386,000 | £296,000 | £444,000 |
| 2020-2021 | £314,000 | £401,000 | £265,000 | £556,000 |
| 2021-2022 | £289,000 | £397,000 | £227,000 | £198,000 |
Notes: median award amount for principal investigators by gender.
Table 19: the median award amount for male fellows was considerably higher than for female fellows in 2020 to 2021 and 2021 to 2022
| Median award amount | Female | Male | Not disclosed | Unknown |
|---|---|---|---|---|
| 2017-2018 | £281,000 | £322,000 | [c] | [c] |
| 2018-2019 | £197,000 | £470,000 | £98,000 | [c] |
| 2019-2020 | £300,000 | £461,000 | £474,000 | [c] |
| 2020-2021 | £229,000 | £859,000 | £722,000 | [c] |
| 2021-2022 | £263,000 | £574,000 | £642,000 | £104,000 |
Notes:
- median award amount for fellows by gender
- UKRI overall, yearly, from the 2017 to 2018 financial year to the 2021 to 2021 financial year
- ‘[c]’ means the value has been suppressed
Intersectionality
It is important to consider that the four characteristics we cover in this report, along with other factors such as socioeconomic background and the protected characteristics that we do not currently report on, can intersect and compound the challenges faced by individuals in accessing research funding.
In the 2020 to 2021 report, we introduced the intersection of age, disability, and ethnicity with gender for the financial year 2020 to 2021. We now also present data on the intersection of age, disability, and ethnicity with gender over time.
In instances where intersectionality per financial year produces very small numbers, we present intersectionality as a five-year cumulative. Even so, in some instances, intersectionality of some characteristics as a five-year cumulative, like female fellows with a disability, or fellows over the age of 60, can create very small numbers. In these instances, very small fluctuations in numbers result in large fluctuations in percentages.
Unknown and non-disclosed genders are not displayed on intersectionality figures, for easier comprehension. See the data tables or Tableau dashboard for unknown and non-disclosed figures.
Intersectionality of age with gender
Cumulatively, over the five years from the 2017 to 2018 financial year to the 2021 to 2022 financial year, female fellows under the age of 29 have a higher award rate than the other age groups, although most awardees were in the 30 to 39 age group (figure 10).
The ESRC postdoctoral fellowships are likely to impact the award rate, as over half of total female awardees under the age of 29 are from ESRC, with a cumulative award rate of 93%.
Figure 10: award rate by age group and gender (excluding unknown and non-disclosed genders) for fellows (five-year cumulative)
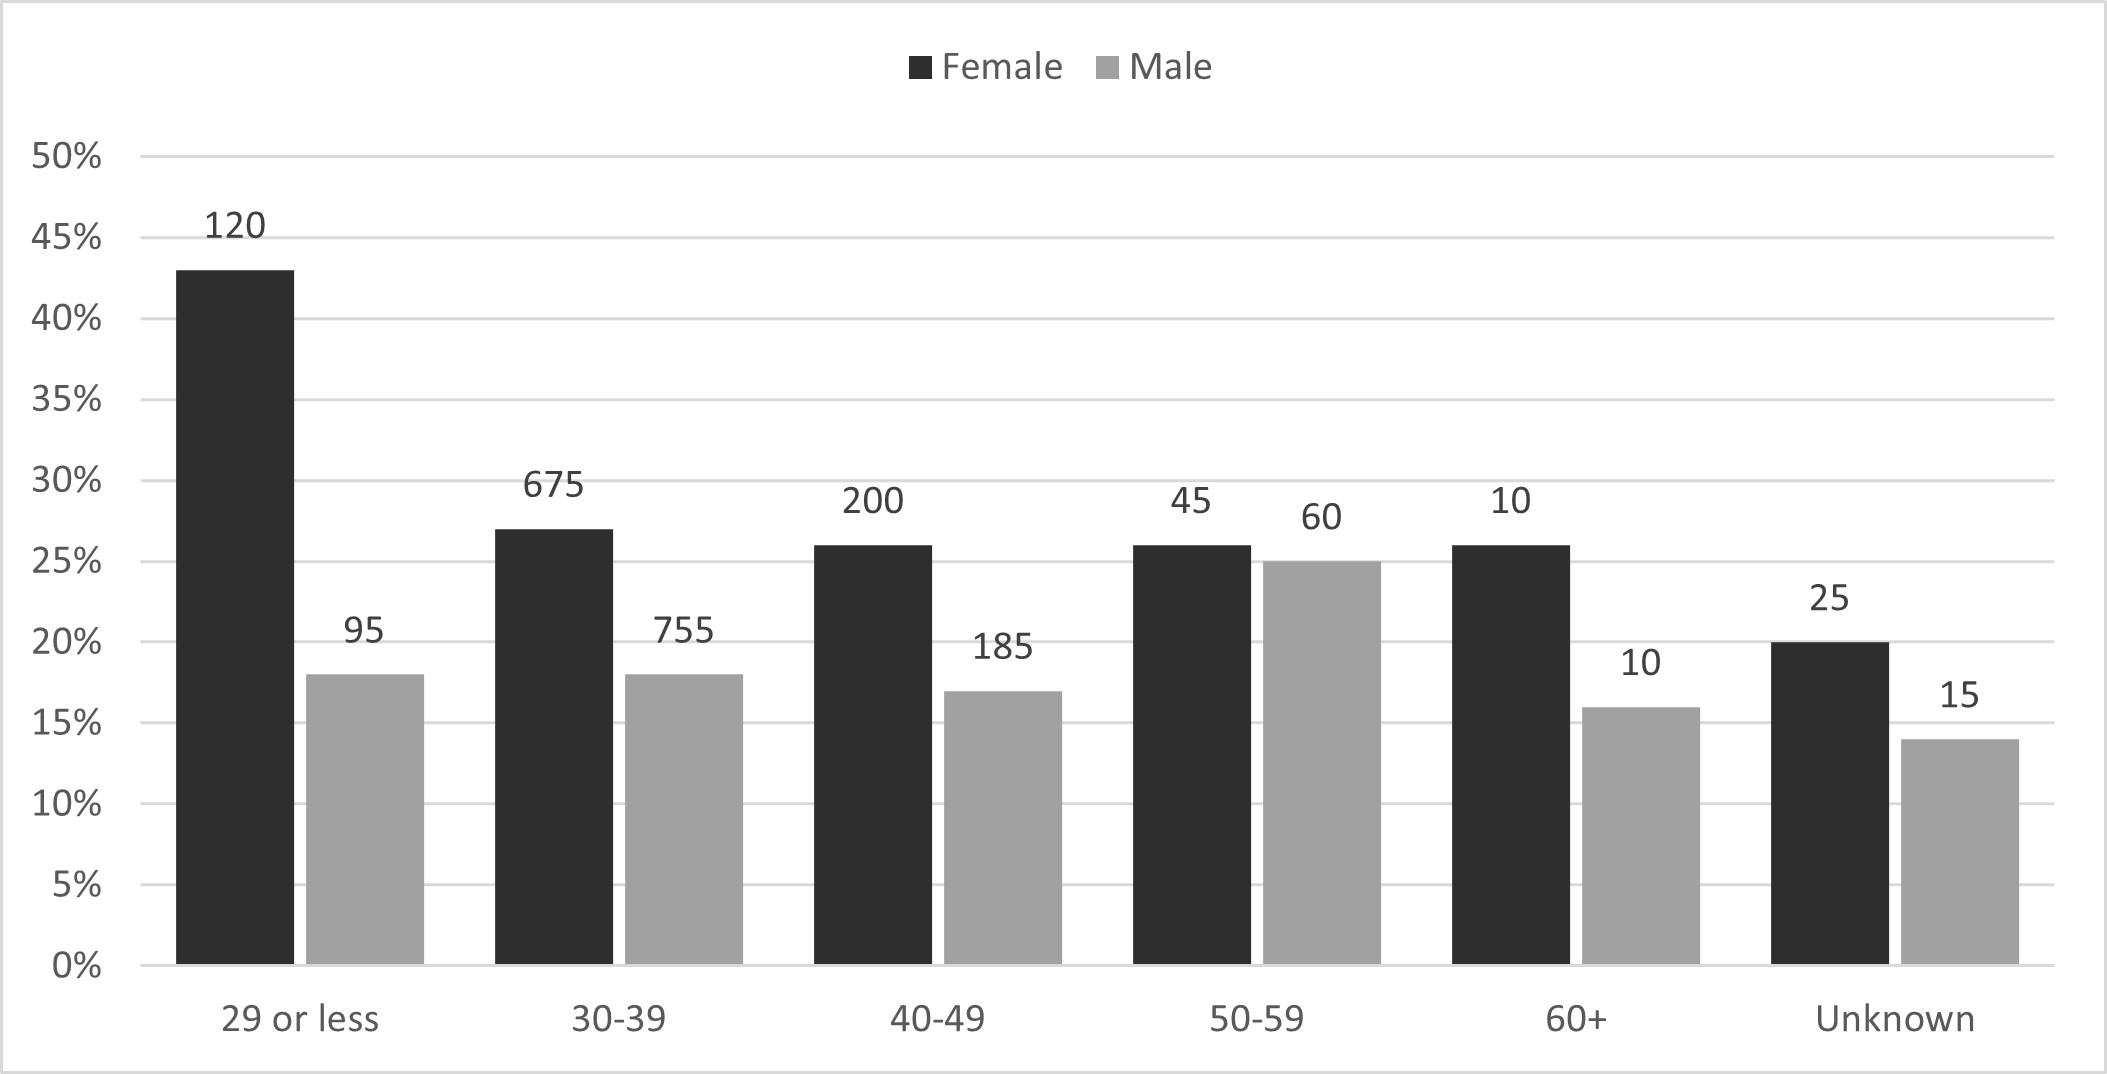
Description of figure 10: this bar chart shows that the award rate for female fellows in the 29 or less age category is much higher than male fellows in the same age category, and both male and female fellows in all other age categories.
Source: UKRI diversity data.
Download the data for figure 10 (ODS, 3KB).
Notes:
- rates for groups comprising fewer than five individuals are not reported
- numbers above the bars represent the number of awardees
Intersectionality of ethnic group with gender
For principal investigators, White male applicants received over half of awards, at 58%. For fellows, White male and female applicants both received 38% of awards.
Since 2014 to 2015, principal investigators have had the lowest proportion of female minority ethnic (excluding White minorities) awardees when compared to the other role types (table 20).
Since 2016 to 2017, the highest proportion of female minority ethnic (excluding White minorities) awardees was fellows. However, with rounding of values to the nearest 1%, it is impossible to say with certainty whether the proportion is increasing over time.
Table 20: the proportion of female minority ethnic (excluding White minorities) awardees for principal investigators, co-investigators, researcher co-investigators and fellows
| Financial year | Principal investigators | Co-investigators | Researcher co-investigator | Fellows |
|---|---|---|---|---|
| 2014-2015 | 2% | 3% | 3% | 4% |
| 2015-2016 | 3% | 4% | 7% | 4% |
| 2016-2017 | 2% | 4% | 3% | 8% |
| 2017-2018 | 2% | 5% | 7% | 8% |
| 2018-2019 | 3% | 6% | 4% | 8% |
| 2019-2020 | 4% | 6% | 4% | 7% |
| 2020-2021 | 2% | 6% | 3% | 7% |
| 2021-2022 | 4% | 5% | 7% | 9% |
| Five-year cumulative | 3% | 6% | 5% | 8% |
Intersectionality of disability with gender
For the five years to 2021 to 2022, 1% of female and 1% of male principal investigator awardees were disabled. This is lower than the 4% of male principal investigator awardees and 2% of female principal investigator awardees who chose not to share their disability status.
In the five years to 2021 to 2022, disabled and non-disabled male principal investigators had the same award rate: 29% (figure 11). Female applicants reporting no known disability had a higher award rate than female applicants reporting a disability. Male applicants also had a higher award rate than female awardees, regardless of disability status (figure 11).
Figure 11: award rate by disability status and gender (excluding unknown and non-disclosed genders) for principal investigators (five-year cumulative)
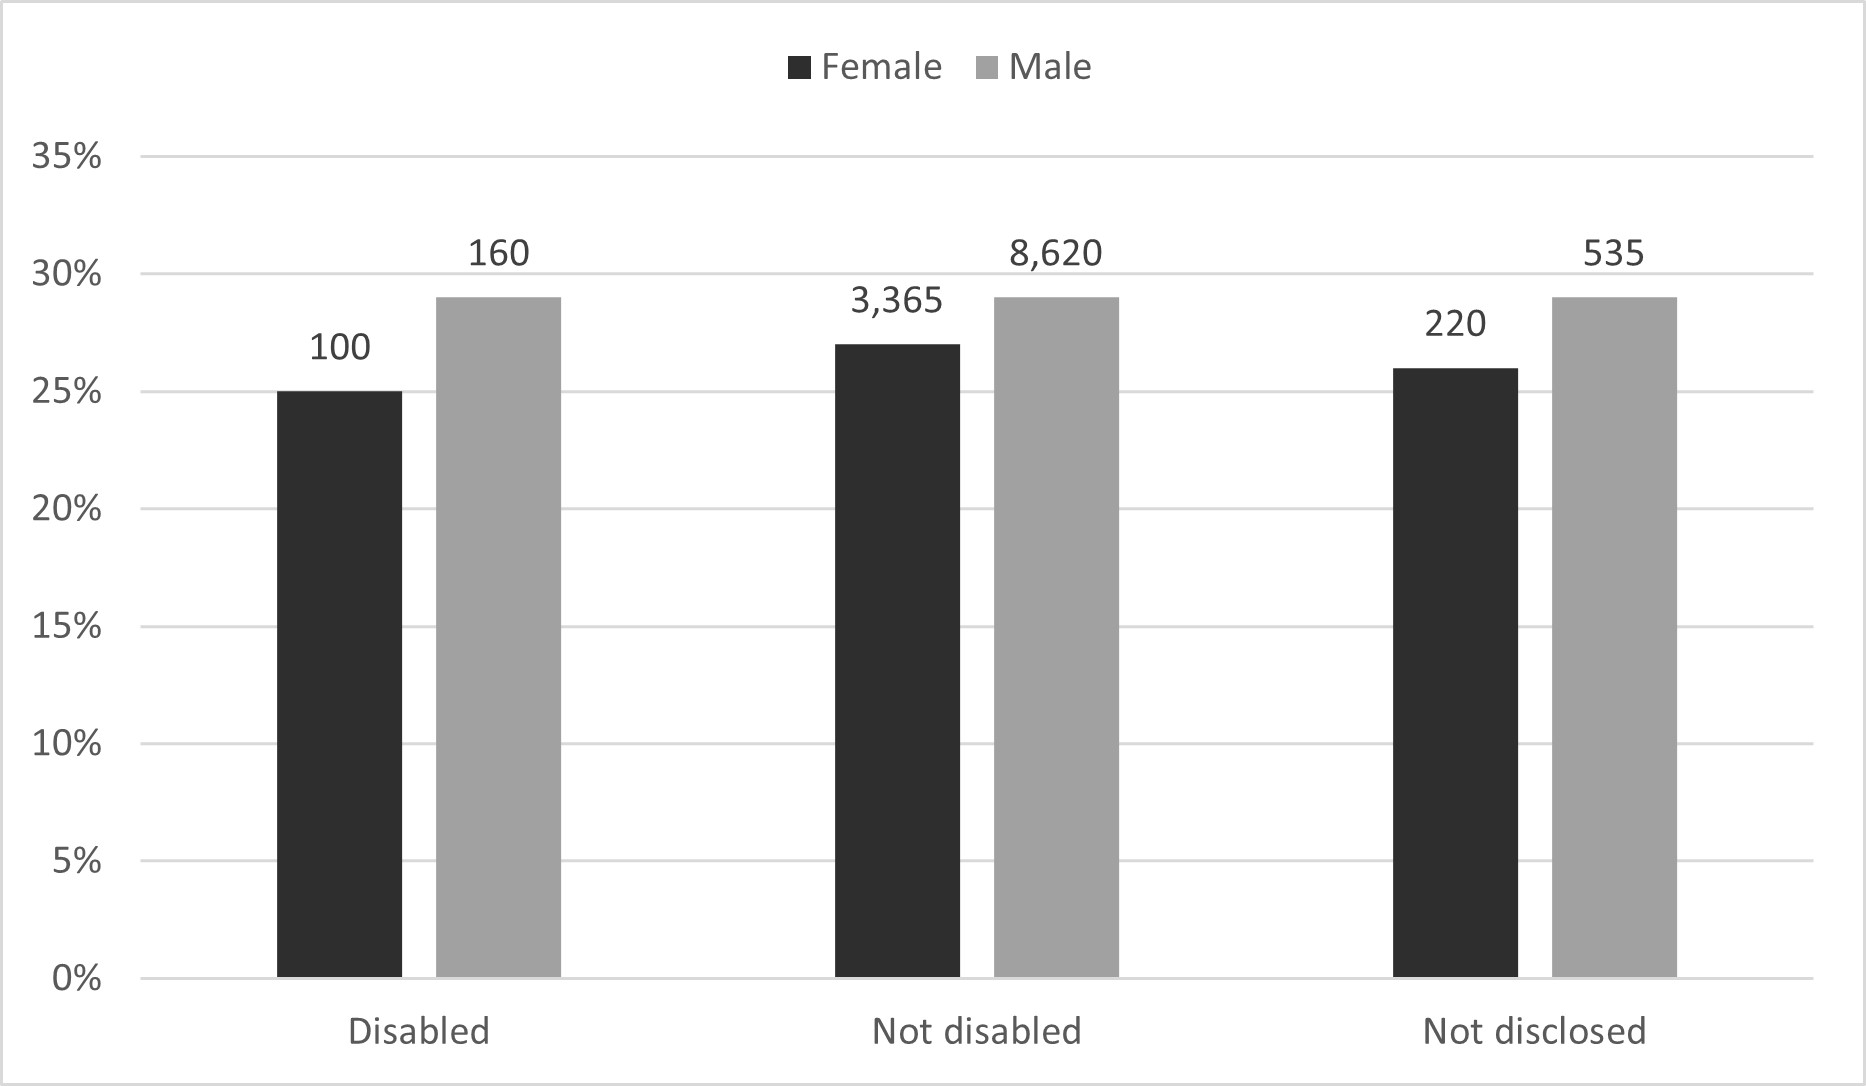
Description of figure 11: this bar chart shows that the award rate for male principal investigators is higher than female principal investigators for both those who declared a disability, and those who did not.
Source: UKRI diversity data.
Download the data for figure 11 (ODS, 3KB).
Notes:
- rates for groups comprising fewer than five individuals are not reported
- numbers above the bars represent the number of awardees
- results for unknown disability are suppressed
Studentships
Results for studentships are discussed separately from the other role types, as the source data differs from the data that is used for UKRI’s research grants and fellowships, and the mechanism for funding is different (see annex for more details). As a result, application data and award rates are not included for studentship starts and instead the findings below focus on the distribution of awards.
In this report we also introduce intersectionality for studentships and the Higher Education Statistics Agency (HESA) postgraduate student population as a comparator.
In 2021 to 2022 UKRI had 5,335 new studentship starts. The number of studentship starts across research councils varied greatly (table 21). EPSRC had 46% of all new studentships starts, while the share ranges from 13% to 5% for all other councils.
Table 21: most new studentship starts in 2021 to 2022 were at EPSRC
| Council | Number of awards | Proportion of awards |
|---|---|---|
| AHRC | 665 | 12% |
| BBSRC | 540 | 10% |
| EPSRC | 2465 | 46% |
| ESRC | 690 | 13% |
| MRC | 335 | 6% |
| NERC | 365 | 7% |
| STFC | 280 | 5% |
| Total UKRI | 5335 | 100% |
Notes: the number and proportion of studentship starts by council, and UKRI overall, in 2021 to 2022.
Age
In 2021 to 2022, for all councils, most students were in the 29 or less age category. This proportion ranged from 96% of students at STFC to 56% of students at AHRC.
Disability
The proportion of students who declared a disability remained relatively stable during the period since 2017 to 2018 for UKRI, but has increased in the Higher Education Statistics Agency (HESA) postgraduate population (figure 12).
In 2021 to 2022, the proportion of disabled students receiving research council funding varied from 13% AHRC (85 studentships) to 6% at EPSRC (155 studentships), with 8% of students declaring a disability at UKRI level (430 studentships).
Figure 12: the percentage of UKRI students reporting a known disability by year and the percentage of HESA students reporting a disability by year
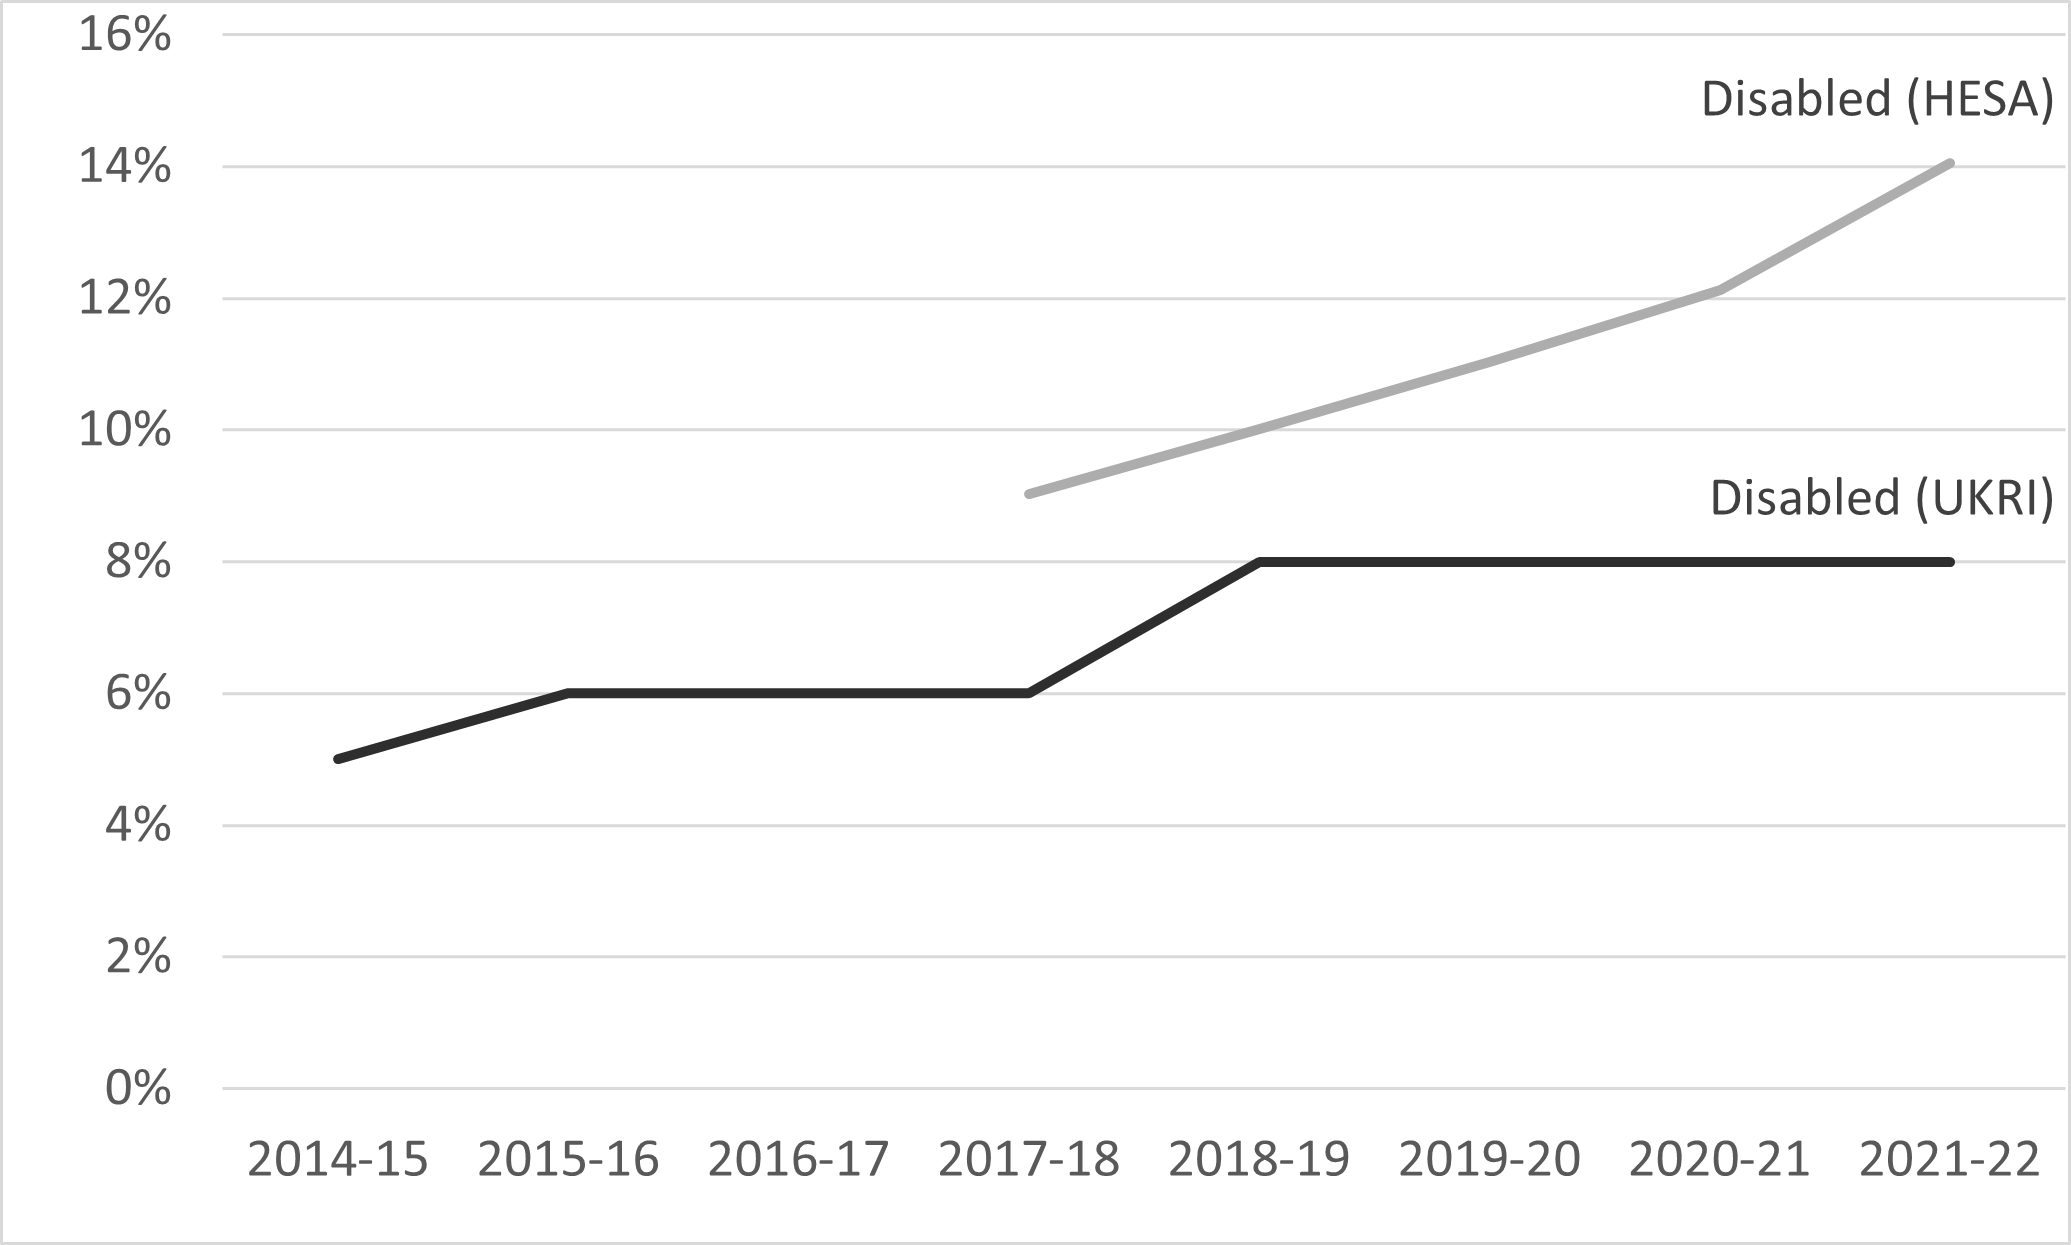
Description of figure 12: this line chart shows that the proportion of students declaring a disability is lower than HESA for all years since 2017 to 2018. Data for UKRI students reporting a known disability is shown from the financial year 2014 to 2015 to the 2021 to 2022 financial year. The percentage of HESA students reporting a disability is show from the 2017 to 2018 financial year to the 2021 to 2022 financial year.
Source: UKRI diversity data.
Download the data for figure 12 (ODS, 3KB).
Notes: Rates for groups comprising fewer than five individuals are not reported. Percentages are rounded to the nearest 1%.
Ethnicity
The percentage of studentship starts whose ethnicity was not disclosed or unknown has been consistently high since 2017 to 2018. In 2021 to 2022 ethnicity was not disclosed for 23% of studentship starts, and unknown for another 9%, so our understanding of ethnicity for studentships is partial (table 22).
After the White ethnic group, excluding non-disclosed and unknown, the highest proportion of studentship starts in 2021 to 2022 were from the Asian ethnic group for all councils (table 22).
Table 22: there were high levels of non-disclosure for studentship starts in 2021 to 2022 across all councils
| Council | Asian | Black | Mixed | Not disclosed | Other | Unknown | White | |
|---|---|---|---|---|---|---|---|---|
| AHRC | 6% | 2% | 6% | 21% | 0% | 8% | 56% | |
| BBSRC | 12% | 4% | 4% | 18% | [c] | 5% | 56% | |
| EPSRC | 11% | 2% | 3% | 26% | 0% | 10% | 47% | |
| ESRC | 11% | 4% | 6% | 16% | [c] | 12% | 50% | |
| MRC | 11% | 2% | 6% | 21% | [c] | 8% | 51% | |
| NERC | 7% | 2% | 5% | 22% | [c] | 5% | 59% | |
| STFC | 7% | [c] | [c] | 36% | [c] | 6% | 49% | |
| Cross-UKRI | 10% | 2% | 4% | 23% | 0% | 9% | 51% | |
| UKRI overall | 8% | 5% | 4% | 3% | 3% | 0% | 77% |
Notes:
- the percentage of studentship starts in each ethnic group, by research council, UKRI overall and the HESA postgraduate student population (2021 to 2022)
- rates for groups comprising fewer than five individuals are not reported
- ‘[c]’ means the value has been suppressed
Gender
The percentage of studentship starts reporting their gender as female has increased from 40% in 2014 to 2015 to 47% in 2021 to 2022, while the percentage of female HESA students has remained stable at approximately 50% since 2017 to 2018.
Intersectionality with gender
We now, for the first time, include data on the intersection of age, disability, and ethnicity with gender for studentship starts. As intersectionality per financial year produces very small numbers which are likely to be suppressed, we present intersectionality as a five-year cumulative.
In the five years to 2021 to 2022, for UKRI overall:
- 47% of studentship starts are males under the age of 29 (figure 13)
- 32% of studentships starts are White males (figure 14)
- 50% of studentship starts are males without a declared disability (figure 15)
Figure 13: percentage of studentship starts by age group and gender, UKRI, five-year cumulative (excluding unknown and non-disclosed gender)
Description of figure 13: this bar chart shows that the largest proportion of students are males in the 29 or less category.
Source: UKRI diversity data.
Download the data for figure 13 (ODS, 4KB).
Notes: numbers above the bars represent the number of students.
Figure 14: percentage of studentship starts by ethnic group and gender, UKRI, five-year cumulative (excluding unknown and non-disclosed gender)
Description of figure 14: this bar chart shows that the largest proportion of students are White males, and that a large proportion of students choose not to disclose their ethnicity.
Source: UKRI diversity data.
Download the data for figure 14 (ODS, 4KB).
Notes: numbers above the bars represent the number of students.
Figure 15: percentage of studentship starts by disability status and gender, UKRI, five-year cumulative (excluding unknown and non-disclosed gender)
Description of figure 15: this bar chart shows that the largest proportion of students are males who did not disclose a disability.
Source: UKRI diversity data.
Download the data for figure 15 (ODS, 4KB).
Notes: numbers above the bars represent the number of students.
Technical annex
Rounding and suppression
Results for groups with between 1 and 4 individuals are suppressed. Counts of five or more are rounded to the nearest multiple of five. Counts of 0 are shown.
Proportions and award rates are calculated based on unrounded numbers and rounded to the nearest 1%.
Award values are rounded to the nearest £1,000.
Guidance on interpreting data
We offer the following notes of guidance when interpreting the data:
- our analysis is based on applications, not unique applicants. An applicant can submit multiple applications in the same year and be counted more than once
- applications are grouped into financial years based on when a funding decision was made and not when the application was made
- fellowships with multiple fellows and research grants with multiple principal investigators are excluded from the data, as identifying the original investigator is not possible in our funding system
- for studentship funding, ethnicity data is not disclosed for approximately 30% of awardees in all years. Without further analysis of the data, the extent of unknown data limits the strength of the conclusions that can be drawn about the ethnicity profile of studentship starts
Diversity characteristics
The Je-S system gathers data on four protected characteristics: age, disability, ethnicity and gender. Description of variables and modification below describes how the data is collected and presented.
Applications to some funding opportunities are now hosted on our new Funding Service. The UKRI Funding Service collects all nine protected characteristics for the lead applicant throughout the application process. It will be some time before the data collected is complete enough to report on these extended characteristics.
Where the numbers within ethnicity categories are small, we aggregate ethnicities into Asian, Black, Mixed, Other and White ethnic groups following the Government Statistical Service harmonised ethnicity standard.
We recognise that aggregation of data in this way can mask the experiences of individual groups, but this is as granular as we are able to present the data without risking disclosure of information or the robustness of conclusions.
Description of variables and modification
Age
Based on applicant’s date of birth and date of decision.
Results are presented as:
- 29 or less
- 30 to 39
- 40 to 49
- 50 to 59
- 60 plus
- unknown
Disability
The following options are presented to applicants:
- an unseen disability
- autistic spectrum disorder
- blind or partially sighted
- Deaf or hearing impairment
- dyslexia
- mental health difficulties
- wheelchair user or mobility difficulties
- multiple disabilities
- a disability not listed above
- no known disability
- not disclosed
- unknown
Results are presented by disability status:
- known disability
- no known disability
- not disclosed
- unknown
Ethnicity
How ethnicities are presented (with the options in brackets):
- Asian (Bangladeshi, Chinese, Indian, Pakistani, any other Asian background)
- Black (African, Caribbean, any other Black/African/Caribbean background)
- Mixed (White and Asian, White and Black African, White and Black Caribbean, any other Mixed or multiple ethnic background)
- Other
- White (White British, White Irish, any other White background)
- unknown
- not disclosed
Gender
The options were male, female or not disclosed.
The current funding service asks applicants to provide information on gender with male, female or not disclosed as response options. For this reason, we use the terminology male and female to describe gender categories throughout this document.
We realise this is not in alignment with data reporting categories for equality monitoring data, and that gender and sex terminology is more nuanced and highly personal. We have reflected this in data collection through the new funding system.
Not disclosed and unknown
‘Not disclosed’ refers to when respondents have consciously chosen to not disclose their personal information and selected the ‘not disclosed’ option.
‘Unknown’ is where individuals have not provided their details, and therefore we have no usable information.
Data sources and limitations
Research grants and fellowships (principal investigators, co-investigators, fellows)
Time period
2014 to 2015 financial year to 2020 to 2021 financial year awardees are grouped into financial year based on the date on which UKRI decided on the application, not the date the application was submitted.
Data source
Source data used is the same as the competitive funding decision data used in UKRI’s annual reports, but with Innovate UK and Research England applications and awards removed.
Sources included are:
- Je-S for the research councils
- additional funding decisions captured outside of Je-S such as rapid response funding (including ‘UKRI response to COVID-19’), opportunities administered by funders outside of UKRI and grants awarded to MRC institutes, units and centres
Note that grants where we cannot link to person-level data are removed from the dataset (less than 1% of grants).
Studentship starts
Time period
2014 to 2015 financial year to the 2020 to 2021 financial year student starts are based on the first financial year that the studentship award was active, a time stamp that typically represents a student’s intake year.
Data source
Individual studentship information submitted by research organisations to research councils via the cross-council Je-S studentship detail functionality.
Funding for studentships is mainly provided to research organisations as a block grant. They then select candidates for specific studentship projects or fund an independent project proposal.
Limitations
UKRI does not collect EDI data for studentships through the application process. Instead, it is provided by the research organisation through the Je-S studentship detail functionality. Data provided in this way only covers studentship starts and does not include application data. It is provided to UKRI annually through a summary annual report completed by each research organisation.
However, inconsistencies between organisations in the way that this data is collected and provided to UKRI mean that it cannot currently be collated and analysed at UKRI level. Data is therefore only included on awards for studentships starts, and award rates cannot be calculated.
UKRI is reviewing its data collection process for studentships and endeavours to improve the quality of application data collected through this annual report. Therefore, award rates are not included for studentship starts.
Ethnicity data is not disclosed or unknown for approximately 30% of awardees in all years.
HESA benchmarking for studentship starts
Data source
The Higher Education Classification of Subjects (HECoS) codes for postgraduate (masters and doctoral research) students and full person equivalent. Common aggregation hierarchy level 3 is used.
HESA data is based on academic years rather than financial years.
Students were included within council-level HESA benchmarks based upon the subject or subjects appropriate to their course. Subjects were allocated proportionately to councils based upon the council funded student headcount in 2020 to 2021 HESA student data.
Statistical testing
Permutation or randomisation tests
To better support interpretation of the data, we have included statistical analyses, specifically permutation or randomisation testing for significant differences in award rates between groups.
This involved calculating the observed difference between award rates of each characteristic and comparing them with a random distribution of values generated from permutations. Ronald A. Fisher lay the groundwork for permutation tests and related ideas through his work on randomisation tests (The design of experiments).
Permutation tests have a wide range of real-world applications and can be applied to complete populations rather than samples, as is the case with the data used in this analysis (Permutation Tests: A Practical Guide to Resampling Methods for Testing Hypotheses and Construction of Permutation Tests).
Each permutation works by randomly re-assigning each applicant to a protected characteristic group, recalculating the award rate of each group, and then estimating the differences between groups. The results of these permutations show what we would see if an applicant’s characteristic had no association with their chance of receiving an award. We performed 5,000 permutations (replications).
If the absolute value is greater than the highest 5% randomised values, the difference in award rate is considered significantly different than what you would expect by chance. There are a lot of comparisons made so the chance of a false positive goes up under the null hypothesis, therefore the significance values are also corrected for multiple testing (see the ‘Use of false discovery rate (FDR) to adjust for multiple testing’ section).
Setting the number of permutations to 5,000
In studies using permutation tests, Morazzi concluded that in actual applications, 5,000 permutations are enough for testing at the significance level of 5% (see Some remarks about the number of permutations one should consider to perform a permutation test).
References
The design of experiments. Fisher RA.
Permutation Tests: A Practical Guide to Resampling Methods for Testing Hypotheses. Good P.
Some remarks about the number of permutations one should consider to perform a permutation test. Marozzi M.
Construction of Permutation Tests. Welch WJ.
Calculation of p-value
The p-value is calculated by counting how many times the permutations produce results from random generation that are at least as extreme as the observed values. This number is then divided by the number of permutations + 1 (adding 1 to the number of permutations ensures that the actual observed difference is also included in the set of permutations samples).
For example, if 500 permutations gave an absolute value that is the same of higher than the observed value, the p value would be 500/1001 = 0.499.
Significance value threshold of 0.05
The p-value is the probability of obtaining the observed result when the null hypothesis, that there is no association between the characteristic and the outcome, is true. A p-value of 0.05 is an arbitrary, though commonly used, threshold to determine statistical significance in many research fields. The use of a p-value of 0.05 has become a convention over time. This uniformity helps comparing results across studies.
By comparing the p-value to a pre-defined significance level, we can decide whether to reject or fail to reject the null hypothesis. If the p-value is less than or equal to the significance level, we reject the null hypothesis and conclude that the difference is statistically significant. Otherwise, we fail to reject the null hypothesis. By setting a 0.05 threshold for significance we allow for a 5% probability of having a false positive (accepting the alternative hypothesis when the null hypothesis is true).
Use of false discovery rate (FDR) to adjust for multiple testing
When multiple hypothesis tests are performed, the likelihood of observing at least one significant result by chance increases, leading to an inflated false positive rate (Type I error). To address this issue, multiple testing correction methods are employed, one of them being FDR.
If performed manually this is how FDR works:
- rank the non-adjusted p-values from lowest to highest
- create a column with the ranks of the p-values, lowest is 1, second lowest 2 and so on
- multiply the non-adjusted p-value by the number of tests and then divide that number by the rank
Example: lowest p-value in a group of 6 tests is 0.0008, the rank will be 1 because it’s the lowest, the adjusted p-value would be 0.0008*6/1 = 0.0048
Limitations
The results must be interpreted with caution, due to the complex nature of EDI data. There is high level of intersectionality across EDI characteristics and between EDI characteristics and other variables (for example, socioeconomic background).
Interpreting a statistically significant difference between two groups as the result of direct discrimination or bias against the less successful group could be misleading because of variables not accounted for. In addition, this method is not appropriate to look at the relative importance of each EDI characteristic in explaining differences in award rates, as it only compares differences between groups within each characteristic.
The data is based on application count rather than individuals, so if the same individual applies more than once or in different role capacities, they are counted multiple times. In addition, each application is treated as an independent data point even though in reality some applicants might be on the same grant application, meaning their success is not independent from the success of other applicants on the same grant.
This does not apply to fellows, as there is only one fellow per fellowship, and only very rarely to principal investigators, but happens often in grants with multiple co-investigators and researcher co-investigators.
Results
Tables 23 to 26 show the results from the permutations testing.
Note that only significant interactions are shown. The award rates for the characteristic in category 1 are compared to the award rates for category 2, and the difference and the ranges expected under the null calculated. All values are adjusted for multiple testing.
Table 23: age
| Role | Category 1 | Category 2 | Recorded award rate difference | Upper range | Lower range | Adjusted significance |
|---|---|---|---|---|---|---|
| Fellow | 60+ | 29 or less | -19% | 0.12 | -0.13 | 0.02 |
| Fellow | 60+ | 30-39 | -14% | 0.06 | -0.06 | 0.00 |
| Fellow | 60+ | 40-49 | -13% | 0.05 | -0.05 | 0.00 |
| Fellow | 60+ | 50-59 | -17% | 0.06 | -0.06 | 0.00 |
Table 24: disability
| Role | Category 1 | Category 2 | Recorded award rate difference | Upper range | Lower range | Adjusted significance |
|---|---|---|---|---|---|---|
| Fellow | Unknown | Disabled | 43% | 0.24 | -0.20 | 0.00 |
| Fellow | Unknown | Not disabled | 40% | 0.22 | -0.20 | 0.00 |
| Fellow | Unknown | Not disclosed | 41% | 0.23 | -0.19 | 0.00 |
| Principal investigator | Unknown | Disabled | 19% | 0.14 | -0.13 | 0.01 |
| Principal investigator | Unknown | Not disabled | 20% | 0.12 | -0.12 | 0.00 |
| Principal investigator | Unknown | Not disclosed | 18% | 0.13 | -0.12 | 0.01 |
Table 25: ethnicity
| Role | Category 1 | Category 2 | Recorded award rate difference | Upper range | Lower range | Adjusted significance |
|---|---|---|---|---|---|---|
| Co-investigator | Black | Asian | 7% | 0.06 | -0.06 | 0.04 |
| Co-investigator | Not disclosed | Asian | 8% | 0.03 | -0.03 | 0.00 |
| Co-investigator | Not disclosed | Mixed | 6% | 0.04 | -0.05 | 0.03 |
| Co-investigator | Other | Asian | 12% | 0.07 | -0.07 | 0.01 |
| Co-investigator | Other | Mixed | 9% | 0.08 | -0.08 | 0.04 |
| Co-investigator | Unknown | Asian | 19% | 0.11 | -0.11 | 0.00 |
| Co-investigator | Unknown | Mixed | 17% | 0.11 | -0.12 | 0.02 |
| Co-investigator | White | Asian | 5% | 0.02 | -0.02 | 0.00 |
| Co-investigator | White | Not disclosed | -3% | 0.03 | -0.03 | 0.03 |
| Co-investigator | White | Unknown | -14% | 0.11 | -0.11 | 0.03 |
| Fellow | Unknown | Asian | 53% | 0.31 | -0.22 | 0.01 |
| Fellow | Unknown | Black | 46% | 0.34 | -0.28 | 0.02 |
| Fellow | Unknown | Mixed | 51% | 0.32 | -0.24 | 0.01 |
| Fellow | Unknown | Not disclosed | 52% | 0.31 | -0.23 | 0.01 |
| Fellow | Unknown | Other | 54% | 0.34 | -0.29 | 0.01 |
| Fellow | White | Unknown | -50% | 0.20 | -0.30 | 0.01 |
| Principal investigator | Mixed | Asian | 7% | 0.06 | -0.06 | 0.04 |
| Principal investigator | Not disclosed | Asian | 9% | 0.05 | -0.05 | 0.00 |
| Principal investigator | Not disclosed | Black | 11% | 0.08 | -0.09 | 0.02 |
| Principal investigator | Unknown | Asian | 31% | 0.17 | -0.15 | 0.00 |
| Principal investigator | Unknown | Black | 33% | 0.18 | -0.17 | 0.00 |
| Principal investigator | Unknown | Mixed | 23% | 0.17 | -0.16 | 0.02 |
| Principal investigator | Unknown | Not disclosed | 21% | 0.17 | -0.16 | 0.02 |
| Principal investigator | Unknown | Other | 26% | 0.19 | -0.19 | 0.02 |
| Principal investigator | White | Asian | 8% | 0.03 | -0.03 | 0.00 |
| Principal investigator | White | Black | 10% | 0.08 | -0.08 | 0.02 |
| Principal investigator | White | Unknown | -23% | 0.15 | -0.16 | 0.02 |
Table 26:
| Role | Category 1 | Category 2 | Recorded award rate difference | Upper range | Lower range | Adjusted significance |
|---|---|---|---|---|---|---|
| Fellow | Male | Female | -8% | 0.03 | -0.03 | 0.00 |
| Fellow | Not disclosed | Female | -14% | 0.13 | -0.12 | 0.04 |
| Fellow | Unknown | Female | 45% | 0.30 | -0.21 | 0.00 |
| Fellow | Unknown | Male | 53% | 0.30 | -0.21 | 0.00 |
| Fellow | Unknown | Not disclosed | 59% | 0.30 | -0.26 | 0.00 |
| Principal investigator | Unknown | Female | 24% | 0.15 | -0.14 | 0.01 |
| Principal investigator | Unknown | Male | 22% | 0.16 | -0.14 | 0.01 |
| Principal investigator | Unknown | Not disclosed | 22% | 0.17 | -0.16 | 0.02 |