
Introduction
This document provides an update on the Engineering and Physical Sciences Research Council (EPSRC) ethnicity portfolio data to include the financial years for the period 2019 to 2020, through to 2023 to 2024.
See the first edition of this data report covering financial year 2014 to 2015 to financial year 2018 to 2019.
Building on the UK Research and Innovation (UKRI) equal opportunities monitoring data, we analyse the ethnicity, gender, age and disability data we hold on our investigators. This includes looking closely at the applications we receive and award rates for research grants and fellowships, as well as exploring participation in our peer review processes.
Collecting and analysing diversity data supports our understanding of our portfolio and is a key component of our equality, diversity and inclusion action plan. We use diversity data to monitor policy implementation and identify areas of concern or underrepresentation. This contextual information informs us of where problem areas exist and where we can take a strategic lead to focus our interventions to address the challenges.
For other detailed data reports on the EPSRC portfolio see:
- ethnicity and race inequity in our portfolio: findings of our community engagement and actions for change
- detailed report on understanding our portfolio by a gender perspective
- gender diversity in our portfolio: survey findings and community engagement
- detailed analysis of the diversity of participation in peer review
- EPSRC grant funding: statistical analysis of diversity in the portfolio and peer review: EPSRC-commissioned technical report from the Royal Statistical Society
Background information
For the data presented in this report, applicants were asked for personal characteristics information through the Joint electronic submission (Je-S) system. This analysis does not include UKRI Funding Service data because the data was collected via Je-S, which was the primary funding system used during the period covered by this report.
For ethnicity, applicants are provided with Office for National Statistics (ONS) harmonised options Level 1 to Level 3, as described in the ‘Ethnic group categorisation’ section.
In this report where data is accessible, all the analysis follows a Level 3 breakdown structure of the ‘all ethnic group’ into the disaggregated ethnicities.
In EPSRC we have now looked at our applicants and awardees as well as participation in peer review by more detailed disaggregate ethnic groups. This publication presents data covering the financial years 2014 to 2015, to 2023 to 2024.
Ethnic group categories
Ethnic group level 1 consists of two categories: Minority Ethnic and White
Ethnic group level 2 consists of four categories, White and three Minority Ethnic groups:
- Mixed
- Asian
- Black
Ethnic group level 3 are further split into three White groups and 12 Minority Ethnic groups (including Mixed, Asian and Black).
The three White groups are:
- British
- Irish
- any other White background
The four Mixed groups are:
- White and Black Caribbean
- White and Black African
- White and Asian
- any other Mixed or Multiple ethnic background
The five Asian groups are:
- Indian
- Pakistani
- Bangladeshi
- Chinese
- any other Asian Background
The three Black groups are:
- African
- Caribbean
- any other Black, African, Caribbean background
Summary of findings
Applications and award
We present applications and awards -related results by detailed ethnicity categories for the three application roles (principal investigator, co-investigator, fellowship) and doctoral studentships.
Applicants and awardees
Comparisons with the Higher Education Statistics Agency (HESA) academic population share reveal that the proportion of certain ethnic groups as awardees exceeds their HESA engineering and physical sciences (EPS) population share, whereas the opposite is true for others. For example:
- the share of principal investigators and researchers from Black, Pakistani and Bangladeshi ethnicity is below their HESA population shares
- the share of principal investigators and researchers from Chinese, Indian and Mixed ethnicity is greater than their HESA EPS population share
The proportion of minority ethnic applicants and awardees over the reported period reveals a dynamic landscape with varying trends. Asian ethnic groups consistently constitute the largest share, followed by Mixed and Black ethnic groups, with Chinese and Indian ethnicities being the most prevalent within the Asian category and ‘Other’ being the largest proportion within the Mixed group.
While the number of applicants and awardees generally increased for Asian and Mixed groups across most categories (principal investigator, co-investigator, and fellowship), award rates relative to applications remained relatively stable for principal investigator and co-investigator roles. Among Black ethnic groups, African ethnicity is predominant. However, due to the small numbers reported, no other statistically meaningful data could be derived for the Black ethnic groups.
Award rates
The award rate for principal investigator, co-investigator and fellowship applicants who identify as White is higher than that of applicants from minority ethnic groups in most reporting years (and accounting for fluctuations from small numbers).
The award rates for the Asian and Chinese ethnic groups closely reflect the overall award rate for minority ethnic applicants as they are the predominant groups.
Doctoral studentships
For recipients of doctoral studentships, we do not have ethnicity information for around 36% of students. As a result, our understanding of the ethnicity composition of studentship starts is partial.
Minority ethnic students form 17% of the awardees who disclosed their ethnicity in 2021 to 2022. Students from Asian ethnic groups are the largest group within the minority ethnic group, followed by those from the Mixed and Black ethnic groups.
Peer review participation
We present information on the EPSRC Peer Review College membership, reviewers, panel membership and panel chairs by detailed ethnicity categories.
The proportion of minority ethnic researchers within our peer review community has significantly increased over time but differentially across categories. The proportion of minority ethnic groups including Asian (excluding Chinese), Black, Chinese, Mixed and Other is increasing from 10.9% in 2014 to 2015, to 20.2% in 2024 to 2025. However, it remains below the HESA EPS academic population share percentage at 24.0%.
There is an increase in the proportion of minority ethnic researchers being requested to provide reviews by EPSRC.
The proportion of minority ethnic panel members has seen a steady increase from 7.1% to 13.4% over the reporting period.
Guidance and technical notes
In this report, the proportion of applicants and awardees by ethnicities are presented as stacked bar graphs.
Each stacked bar graph displays the percentage of the whole of each group. It shows the relative percentage of each ethnic group.
Groups with counts between one and four are suppressed and not shown in the graphs, therefore the added bars may not present to a 100% proportion. Counts of zero are also not shown.
The symbol ‘[c]’ means the value has been suppressed.
The numbers in the graph refer to the counts for the group. All counts of five or more are rounded to the closest multiple of five.
The numbers in the bar graphs refer to the number in the relevant categories.
The three-level ethnicity categories presented are consistent with the ONS options (see ’Ethnic group categorisation’). We have grouped them into broad and detailed ethnicity categories:
- broad ethnicity categories (Level 1) refer to White and Minority Ethnic groups
- minority ethnic categories (Level 2) are broken down into Asian (excluding Chinese), Chinese, Black, Mixed ethnic groups
- Asian, Black and Mixed ethnic groups are further broken down to the Level 3 disaggregated categories
In these datasets the Chinese ethnic category has been separated from the Asian category. This is due to the relative size of the Chinese ethnic population compared to that of the Asian category. This enables the applications, awards and participation in peer review for this group to be examined.
‘Not disclosed’ refers to when respondents have consciously chosen to not disclose their personal information and selected the ‘Not disclosed’ option. ‘Unknown’ refers to when individuals have not provided their details and therefore the funding service has no usable information.
HESA staff data is not available for the ‘Other’ ethnic group in the minority ethnic category or the White ethnic group. HESA student data is not available for detailed ethnicity categories. HESA student population estimates for 2021 to 2022 was used for the comparison as the latest year is not available at the time of this analysis.
The HESA EPS minority ethnic population proportions have been created using the HESA 2022 to 2023 staff return:
- staff full-person equivalent
- staff (excluding atypical)
- academic employment function
- teaching and research
HESA cost centres are departments originating from the HESA finance records and have been used for a number of years as a way of coding higher education. For EPSRC, individuals are from the following cost centres (2012 to 2013 onwards):
- general engineering, chemical engineering
- mineral, metallurgy and materials engineering
- civil engineering
- electrical, electronic and computer engineering
- mechanical, aero and production engineering
- information technology, systems sciences and computer software engineering
- mathematics
- chemistry
- physics
Important things to note
Some groups are very small (total numbers less than 20) and detailed analysis is not appropriate on these groups.
We do not have ethnicity information on 6 to 9% of applicants for research grants and fellowships.
We do not have ethnicity information on 36% of recipients of doctoral studentships.
Data sources
Funding data for research grants and fellowships for the period 2014 to 2015, through to 2023 to 2024, was primarily gathered through returns by individuals to their Je-S account, which the research community used to apply for UKRI funding. The Je-S account held personal information including ethnicity.
Studentship data over the time period for student starts was provided by research organisations through the Je-S studentships detail functionality.
HESA data is used to understand the diversity profile of the academic and postgraduate student community. This enables us to compare the diversity data for applicant and funding recipients with the diversity profile of the postgraduate research (PGR) population in the UK and that of the academic population who are likely to apply for funding.
Although the Funding Service has been used for some EPSRC activities, including prioritisation panels and submission of applications, this data has not been included in this report as it was not captured at the time of this analysis. As a result, the most recent data, particularly for 2023 to 2024, may not fully reflect the complete position of applications and awards.
Comparisons of minority ethnic applicants and awardees with HESA EPS academic population
The EPS academic research base in the UK is one of the most international sectors in the UK. As a result, we compare our data to HESA EPS academic populations.
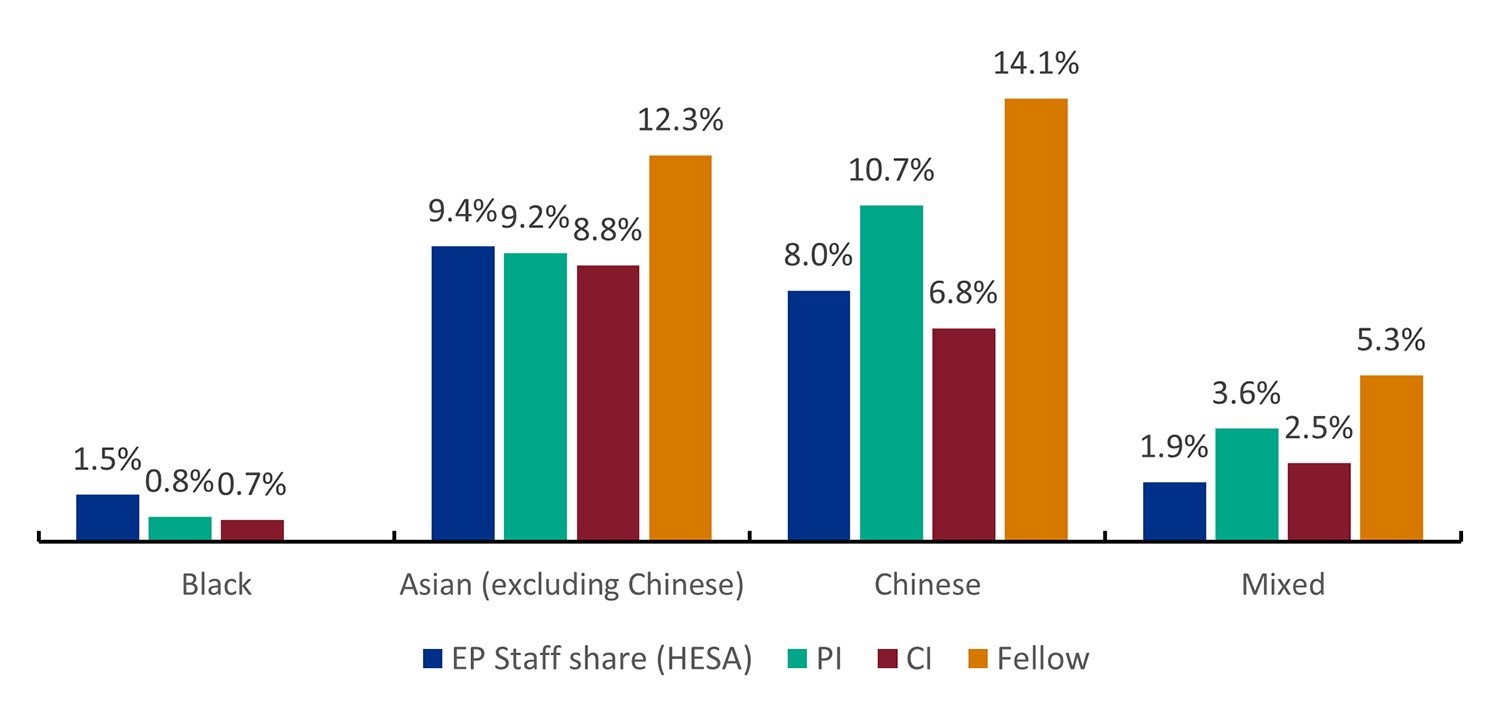
Figure 1: share of applicants by ethnicity for all roles (2022 to 2023)
Download the data for figure 1 (ODS, 4KB)
Figure note: share for the groups comprising fewer than five individuals and zero are not reported.
Figure 1 compares the share of applicants by ethnicity in 2022 to 2023 for principal investigator, co-investigator and Fellows, alongside the HESA EPS academic population, respectively.
Applicants from Black ethnic backgrounds are underrepresented across all roles (principal investigator, co-investigator, Fellow) compared to the HESA EPS staff share. The data shows a significant disparity, with application rates at less than 1% for principal investigator and co-investigator positions, and fewer than five applicants for fellowships, compared to a HESA EPS staff share of 2%.
The proportion of principal investigator and co-investigator roles for applicants from Asian (excluding Chinese) backgrounds is proportional to HESA EPS staff share (approximately 9% for both roles). However, for fellowships, the proportion of Asian applicants is slightly higher (12%). Among the Chinese ethnicity, there are higher proportions of applicants (11% and 14%, respectively) compared to the HESA EPS share (8%) for principal investigator and fellowship roles. However, for co-investigator roles, the representation is slightly lower at 7%.
Mixed ethnicity applicants are proportionally represented or slightly over-represented across all roles (principal investigator, co-investigator and Fellow) compared to the HESA EPS staff share. The data shows 4% for principal investigator, 3% for co-investigator, and 6% for Fellows, compared to a HESA EPS staff share of 2%.
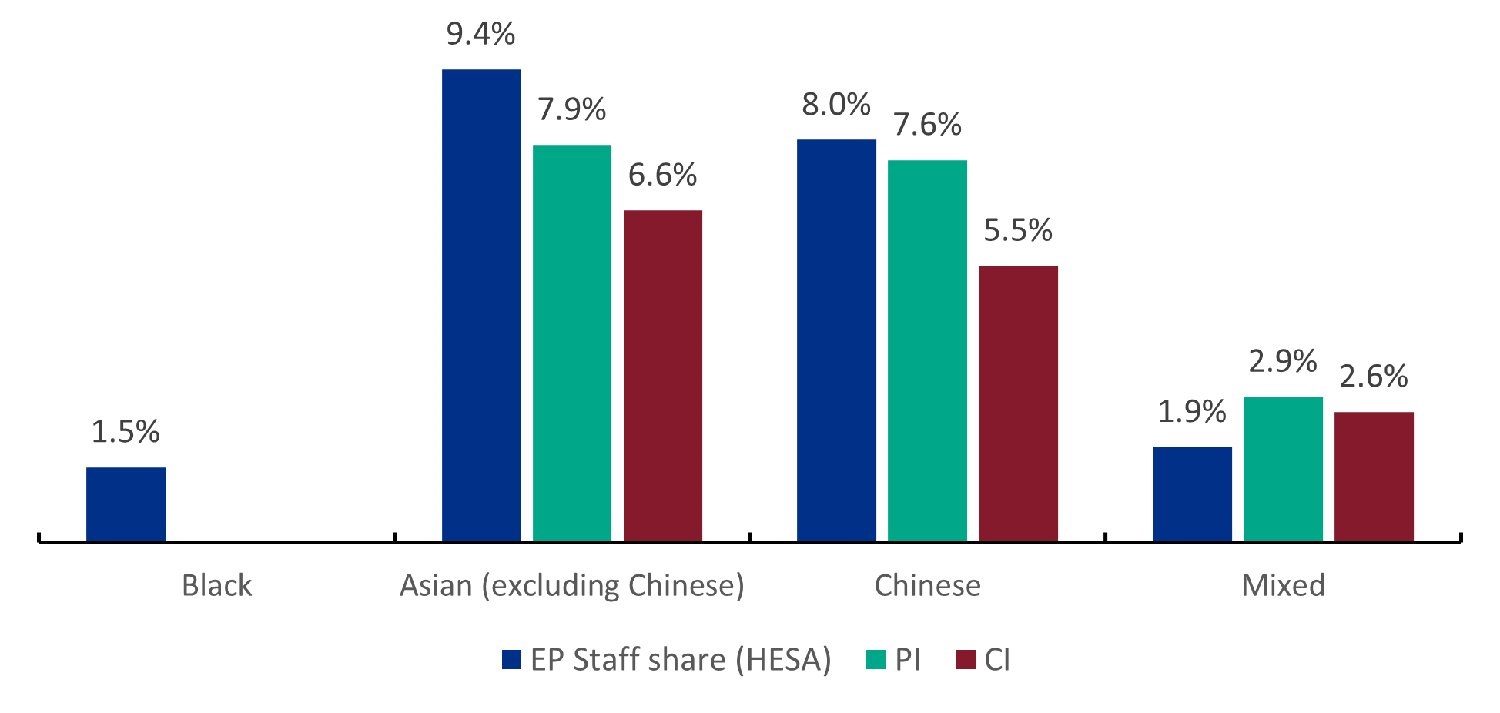
Figure 2: share of awardees by ethnicity for all roles (2022 to 2023)
Download the data for figure 2 (ODS, 3KB)
Figure 2 compares the share of awardees by ethnicity in 2022 to 2023 for principal investigator, co-investigator and Fellows, alongside the HESA EPS academic population, respectively.
Across all roles (principal investigator, co-investigator, Fellow), awardees from Asian (including Chinese) and Black ethnic backgrounds are either slightly or significantly underrepresented, respectively, compared to the HESA EPS staff share. Principal investigators and co-investigators from Black ethnic backgrounds are the most underrepresented, with fewer than five awardees, compared to the HESA EPS academic population (2%).
Among fellowship awardees, fewer than five fellows from each minority ethnic group (Black, Asian, Chinese, and Mixed) were awarded, which remained underrepresented relative to their respective HESA EPS shares.
There is over-representation relative to the HESA EPS academic population for the proportion of Mixed principal investigators and co-investigators.
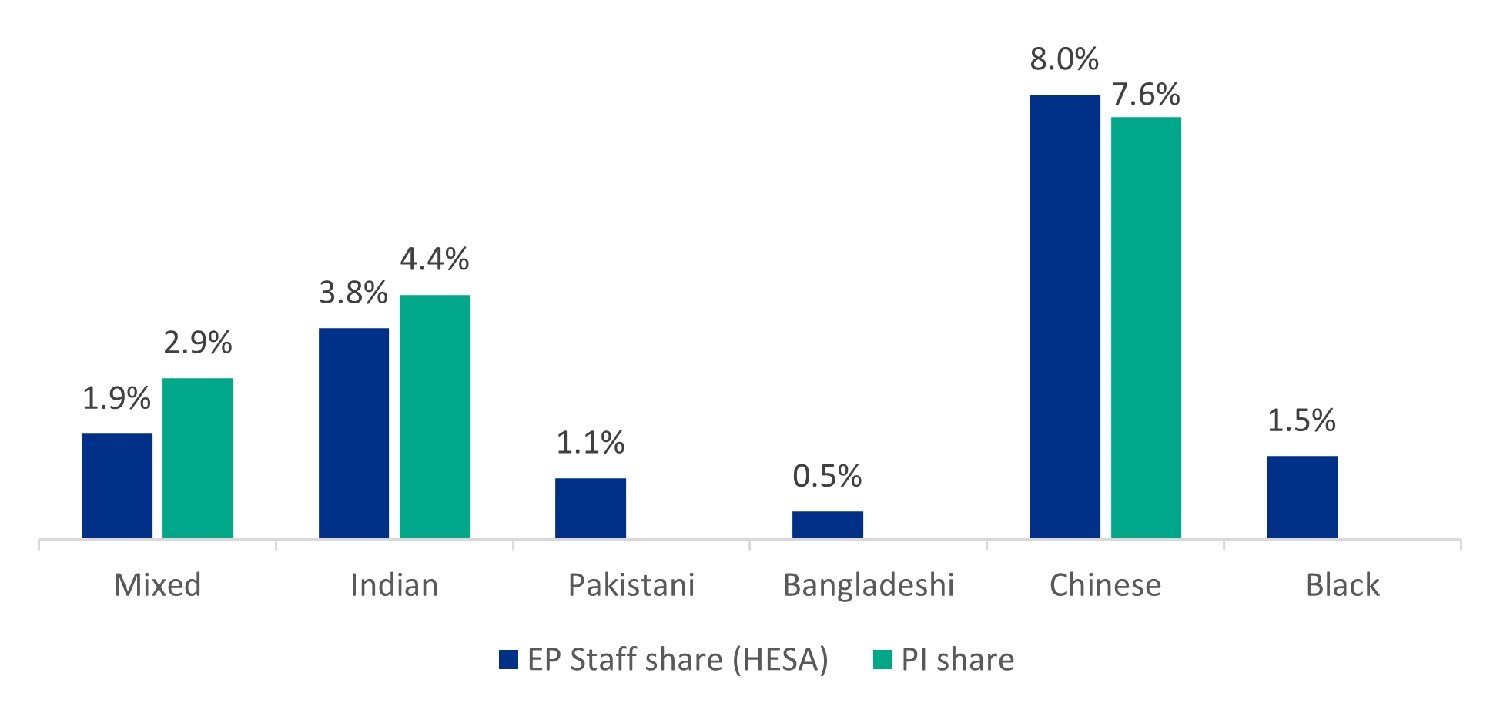
Figure 3: Principal investigator share (awardees) and HESA EPS staff population
Download the data for figure 3 (ODS, 3KB)
Figure 3 shows that:
- the share of principal investigators from Pakistani, Bangladeshi and Black ethnicities are underrepresented (note that Black and Mixed ethnicities in Figure 3 are analysed at Level 2, while other ethnicities are analysed at Level 3)
- the share of principal investigators from Indian and Mixed ethnicities is greater than the HESA EPS academic staff share
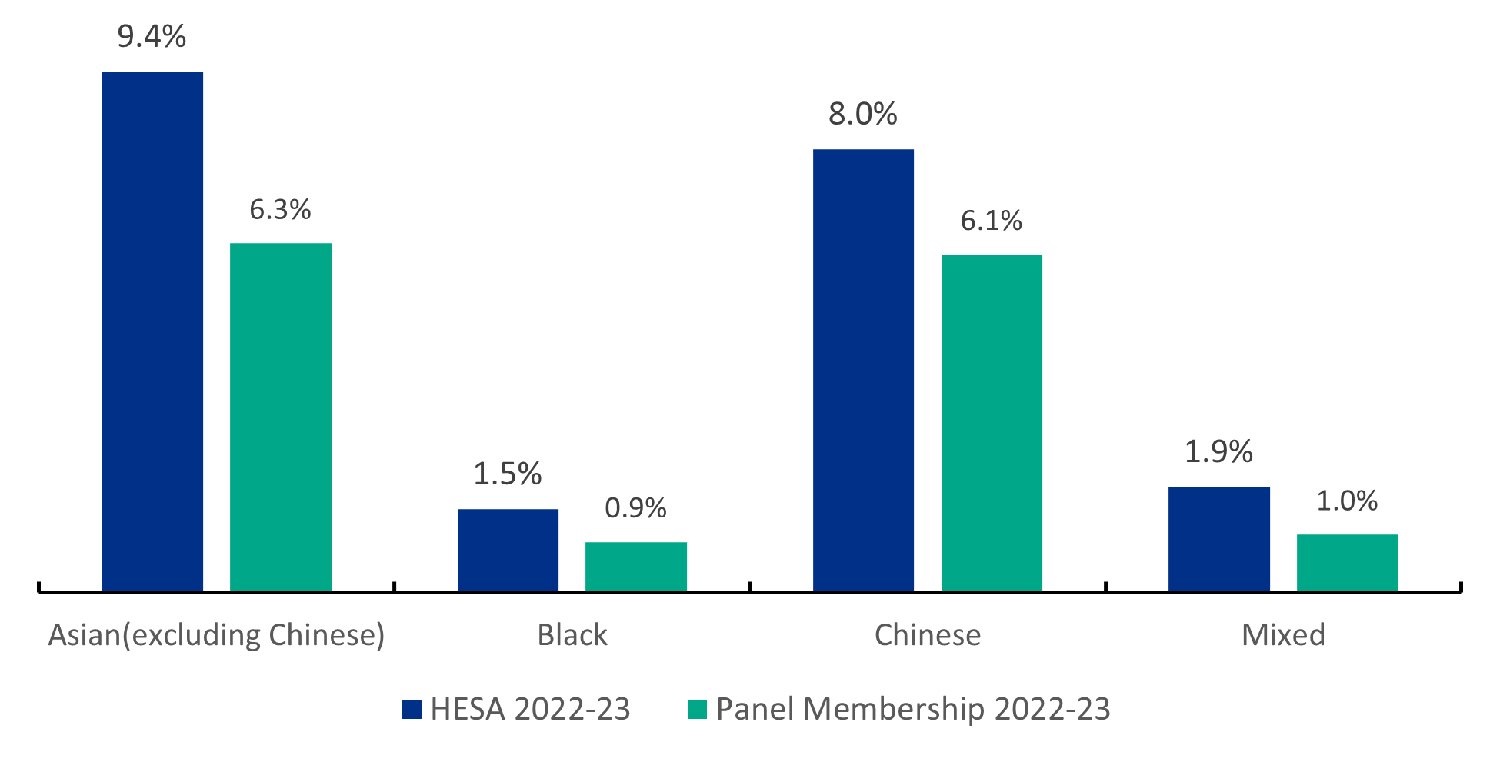
HESA EPS ethnic minority population proportions
Four tables are shown for the HESA EPS academic population by ethnicity, breaking down into three levels as presented in the Ethnic Group Categorisation section:
- table 1 shows Level 1 category
- table 2 shows Level 2 category for Minority Ethnic groups
- tables 3 and 4 show Level 3 category for disaggregated Asian and Black ethnic groups
| HESA EPS 2022-23h | Number | Percentage of EPS academic population |
|---|---|---|
| Minority Ethnic | 3,580 | 24.0% |
| White | 10,160 | 68.2% |
| Unknown | 1,155 | 7.8% |
| Total | 14,895 | 100.0% |
| HESA EPS 2022-23 | Number | Percentage of ethnic minority | Percentage of EPS academic population |
|---|---|---|---|
| Asian (excluding Chinese) | 1,395 | 39.0% | 9.4% |
| Black | 230 | 6.4% | 1.5% |
| Chinese | 1,190 | 33.2% | 8.0% |
| Mixed | 285 | 8.0% | 1.9% |
| Other | 480 | 13.4% | 3.2% |
| Total | 3,580 | 100.0% | 24.0% |
| HESA EPS 2022-23: Asian ethnicity | Number | Percentage of Asian Ethnic | Percentage of Minority Ethnic | Percentage of EPS academic population |
|---|---|---|---|---|
| Bangladeshi | 75 | 2.9% | 2.1% | 0.5% |
| Chinese | 1,190 | 46.0% | 33.2% | 8.0% |
| Indian | 565 | 21.9% | 15.8% | 3.8% |
| Pakistani | 165 | 6.4% | 4.6% | 1.1% |
| Other | 590 | 22.8% | 16.5% | 4.0% |
| Total | 2,585 | 100.0% | 72.2% | 17.4% |
| HESA EPS 2022-23: Black ethnicity | Number | Percentage of Black Ethnic | Percentage of Minority Ethnic | Percentage of EPS academic population |
|---|---|---|---|---|
| African | 215 | 93.5% | 6.0% | 1.4% |
| Caribbean | 5 | 2.2% | 0.1% | 0.0% |
| Other | 10 | 4.3% | 0.3% | 0.1% |
| Total | 230 | 100.0% | 6.4% | 1.5% |
Table 4 note: the rounded figure of 0.0% for EPS Black British Caribbean academic population is 0.03%
EPSRC applicant and awards data
Ethnic group breakdown Level 1: all ethnic groups
The proportion of minority ethnic applicants exhibits a mixed trend compared to the HESA EPS minority ethnic academic population of 24% (HESA, 2022 to 2023). Representation is exceeding this benchmark in some roles while others remaining underrepresented.
We observe a gradual increase in proportion of minority ethnic applicants for principal investigators, co-investigators and fellows over the reported period. While the proportion of co-investigators remains lower, the representation among principal investigator and fellowship applicants slightly exceeds the estimated minority ethnic EPS academic population (HESA: 24.0% in 2022 to 2023).
The proportion of fellowship awardees from minority ethnic groups has shown the most significant increase, rising from 7% in financial year 2014 to 2015 to 22% in 2022 to 2023, and 33% in 2023 to 2024. This growth surpasses the trends observed among principal investigators and co-investigators. However, caution is advised in interpretation due to the relatively small number of fellows.
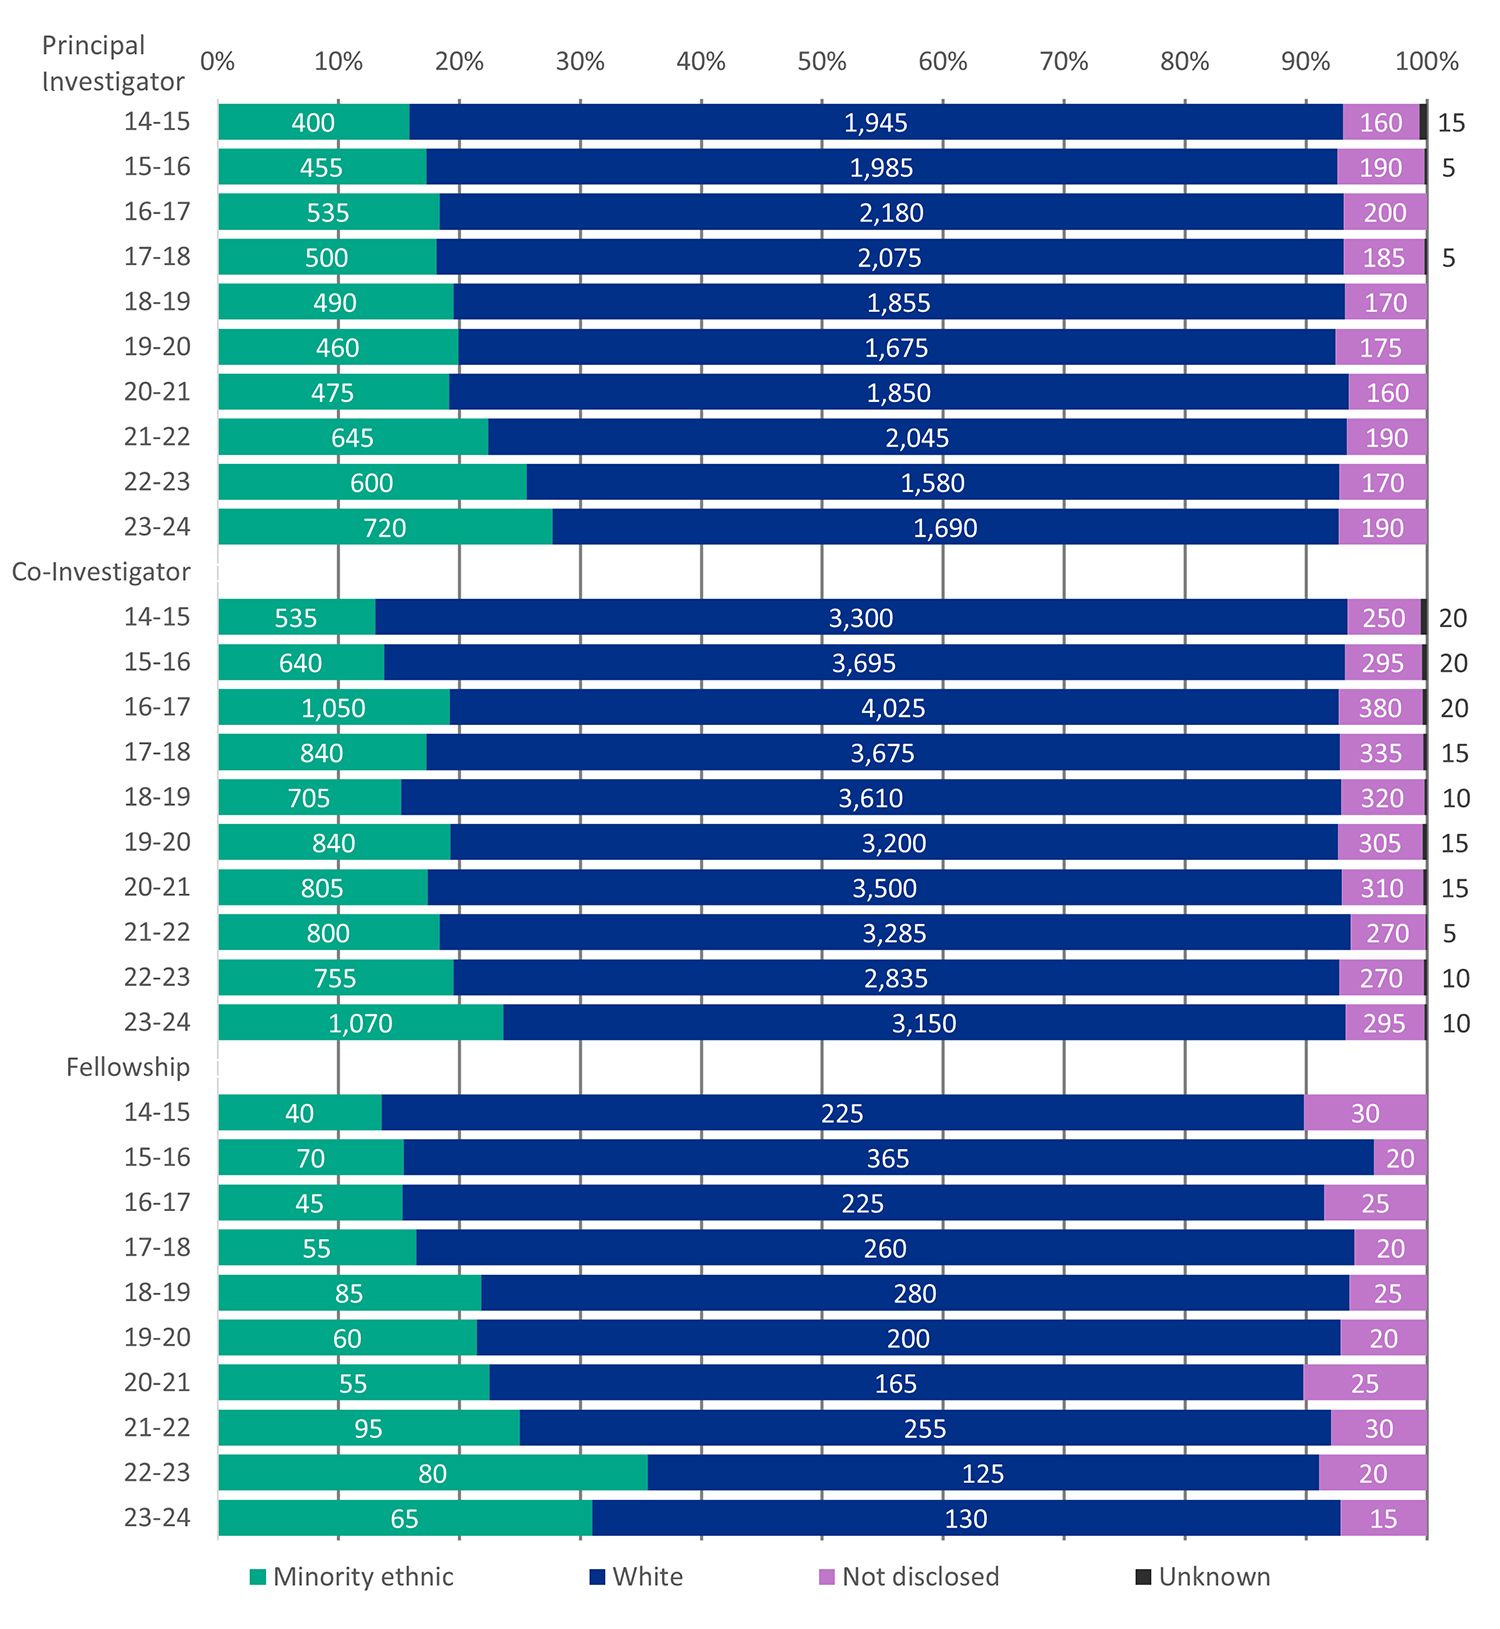
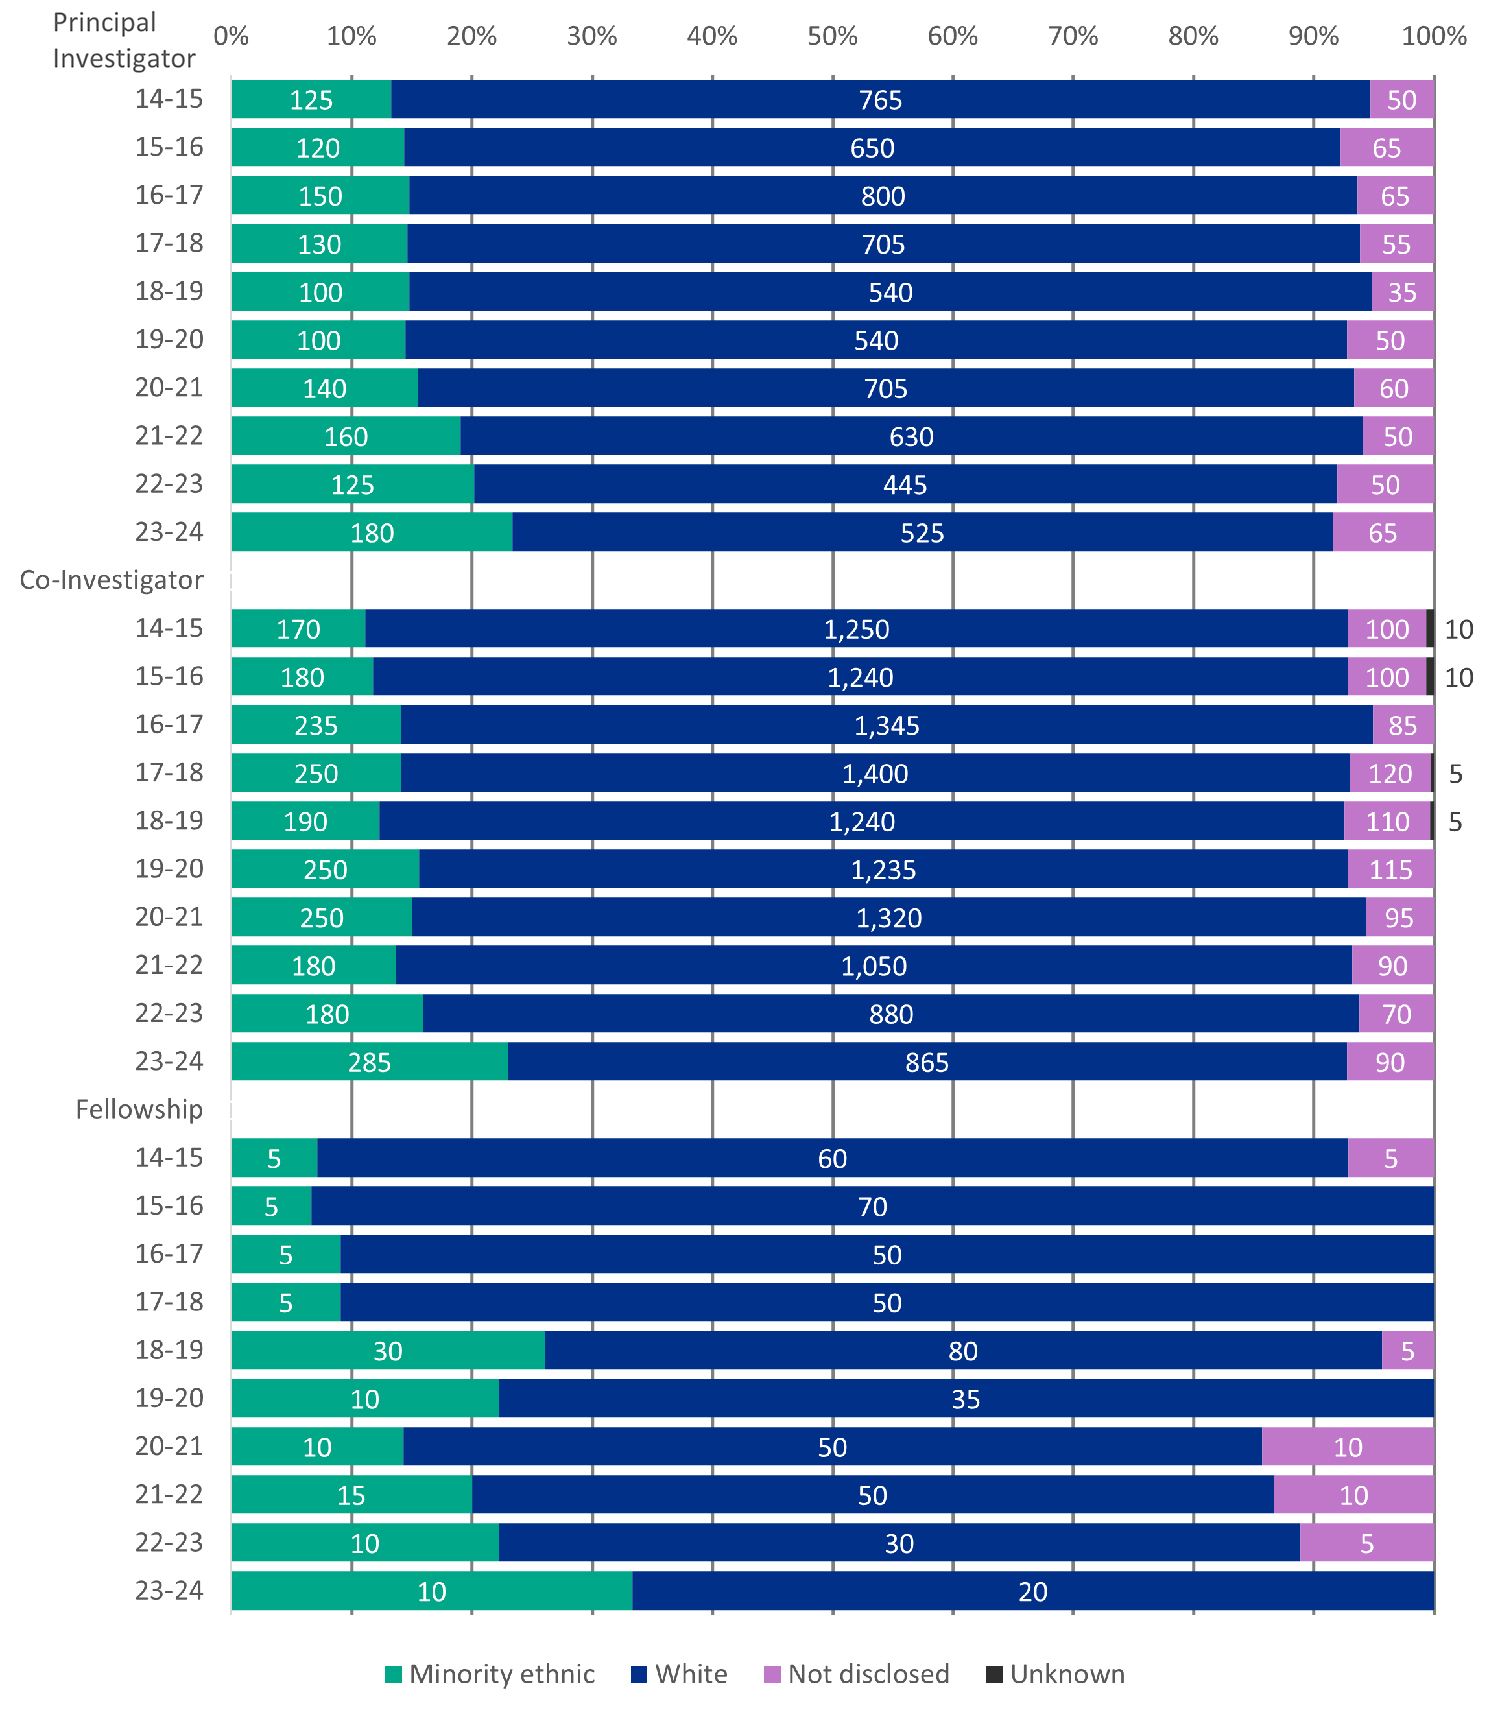
Figure 4: proportion and number of applicants for minority ethnic and White group by role and year
Download the data for figure 4 (ODS, 5KB)
Figure note: groups with count between 1 and 4 are suppressed and not shown, therefore the added bars may not present to 100% proportions. Counts of 0 are also not shown.
Figure 5: proportion and number of awardees for minority ethnic and White group by role and year
Download the data for figure 5 (ODS, 4KB)
Figure note: groups with count between 1 and 4 are suppressed and not shown, therefore the added bars may not present to 100% proportions. Counts of 0 are also not shown.
Ethnic group breakdown Level 2: Minority Ethnic groups
Drilling down into the Minority Ethnic category, the Asian group (including Chinese ethnicity) is the largest group, forming 85% of the total Minority Ethnic category for both applicants and awardees.
The proportion of Asian awardees (85%) exceeds the HESA EPS 2022 to 2023 academic population proportion identified with an Asian background (approximately 72% of all Minority Ethnic). Around 38% of the awardees from the Minority Ethnic group are from a Chinese ethnicity.
In 2022 to 2023, the proportion of principal investigators and co-investigators from Black ethnic groups who were awarded grants is underrepresented compared to the proportion of Black ethnic groups within HESA EPS academic proportion (6.4% of all minority ethnic). In addition, the data for these awardees is suppressed due to the number being less than 5.
In 2022 to 2023, the share of principal investigator and co-investigator awardees in the Mixed ethnic group (17% and 18% of all Minority Ethnic) is higher than the HESA EPS academic population estimate (at 8% of all minority ethnic).
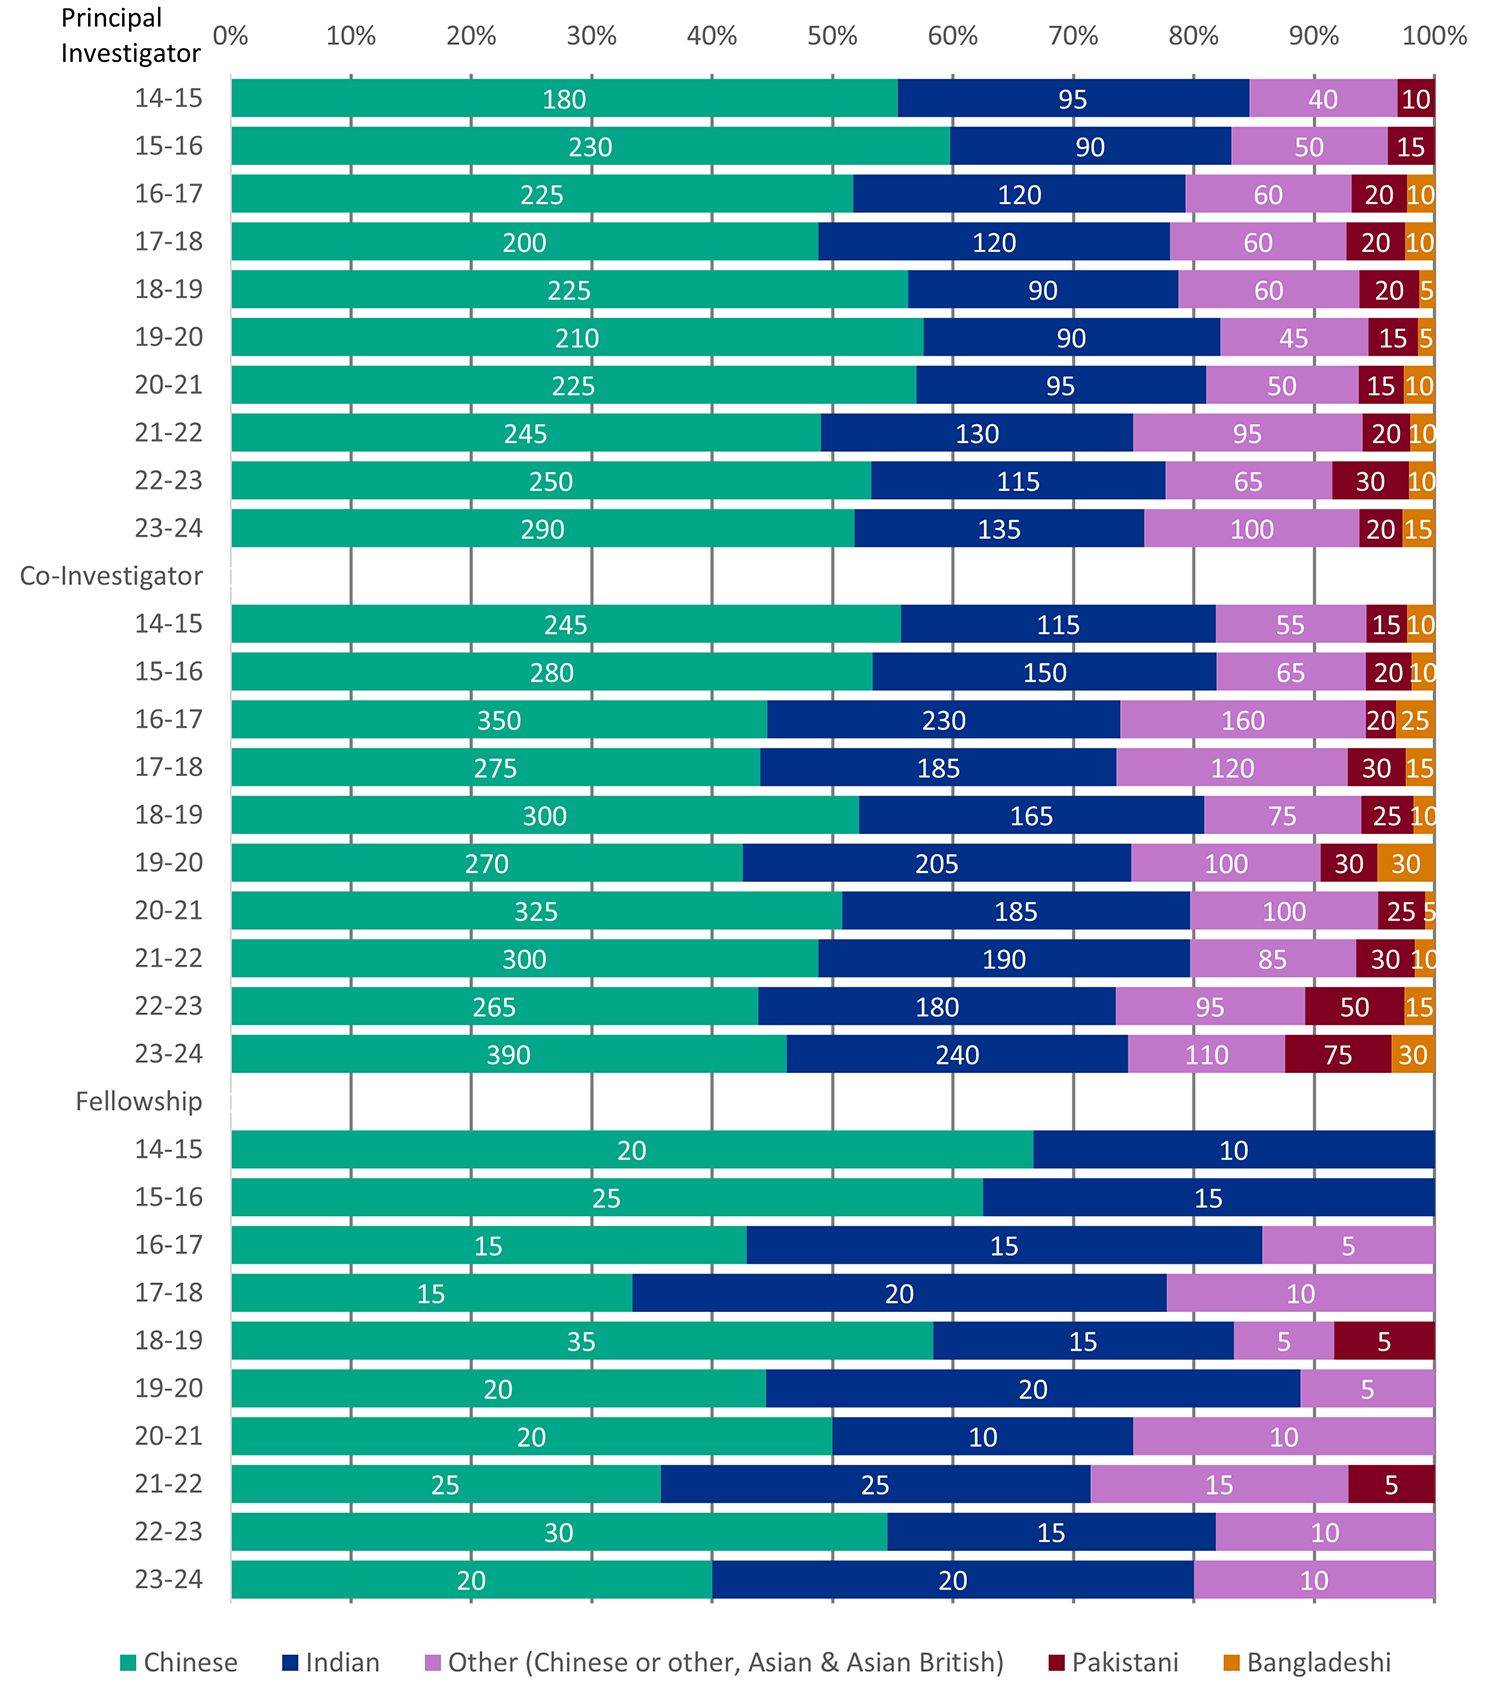
Figure 6: proportion and number of applicants for detailed minority ethnic groups by role and year
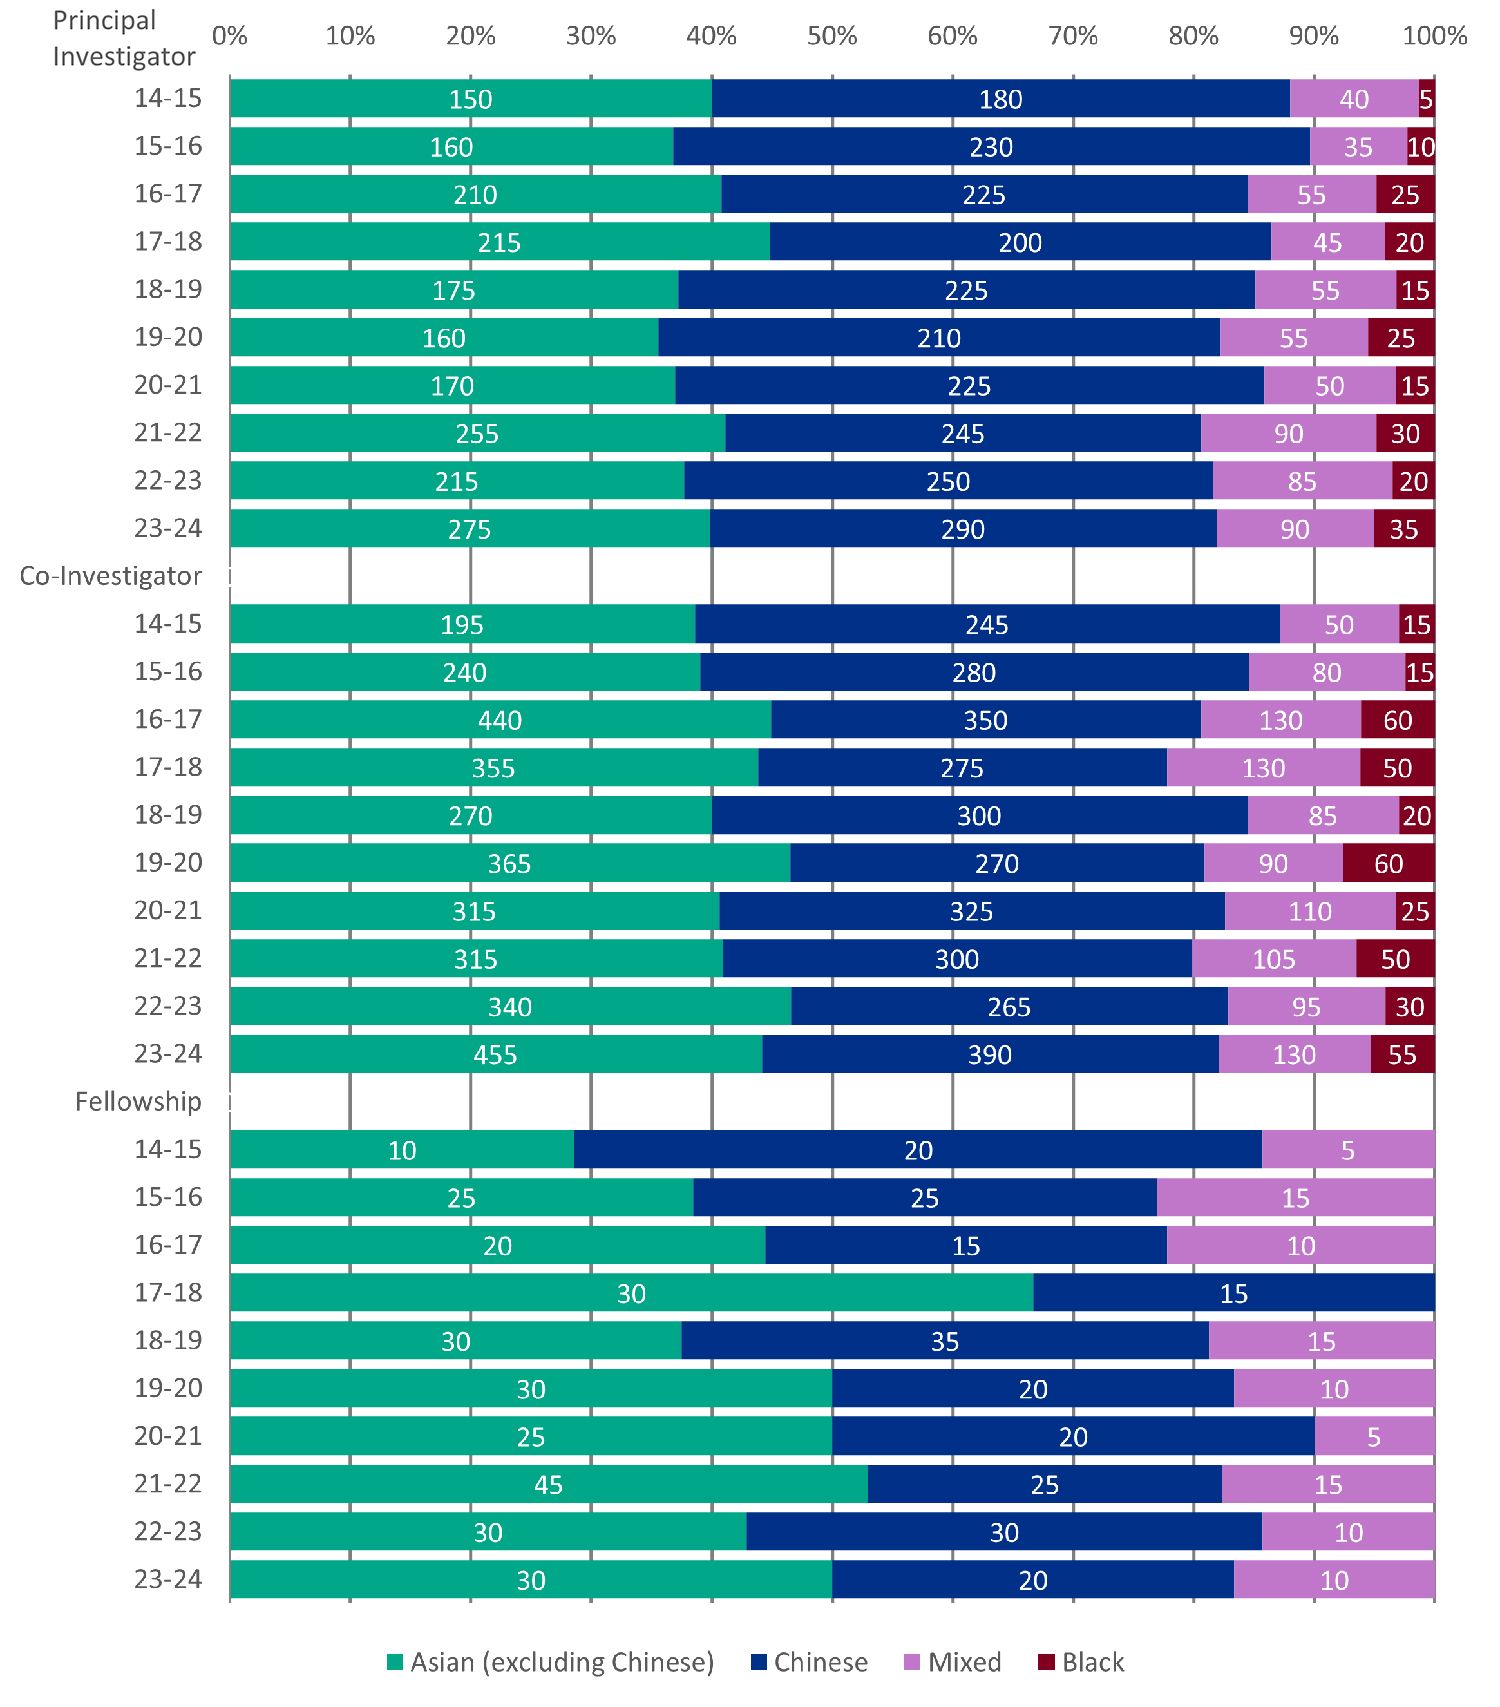
Download the data for figure 6 (ODS, 4KB)
Figure note: groups with count between 1 and 4 are suppressed and not shown, therefore the added bars may not present to 100% proportions. Counts of 0 are also not shown.
Figure 7: proportion and number of awardees for detailed minority ethnic groups by role and year
Download the data for figure 7 (ODS, 4KB)
Figure note: groups with count between 1 and 4 are suppressed and not shown, therefore the added bars may not present to 100% proportions. Counts of 0 are also not shown.
| Year | Asian (excluding Chinese) | Chinese | Mixed | Black |
|---|---|---|---|---|
| 2014-15 | [c] | [c] | [c] | [c] |
| 2015-16 | [c] | [c] | [c] | [c] |
| 2016-17 | [c] | [c] | [c] | [c] |
| 2017-18 | [c] | [c] | [c] | [c] |
| 2018-19 | 5 | 15 | 5 | [c] |
| 2019-20 | [c] | [c] | [c] | [c] |
| 2020-21 | [c] | [c] | [c] | [c] |
| 2021-22 | 5 | [c] | [c] | [c] |
| 2022-23 | [c] | [c] | [c] | [c] |
| 2023-24 | [c] | [c] | [c] | [c] |
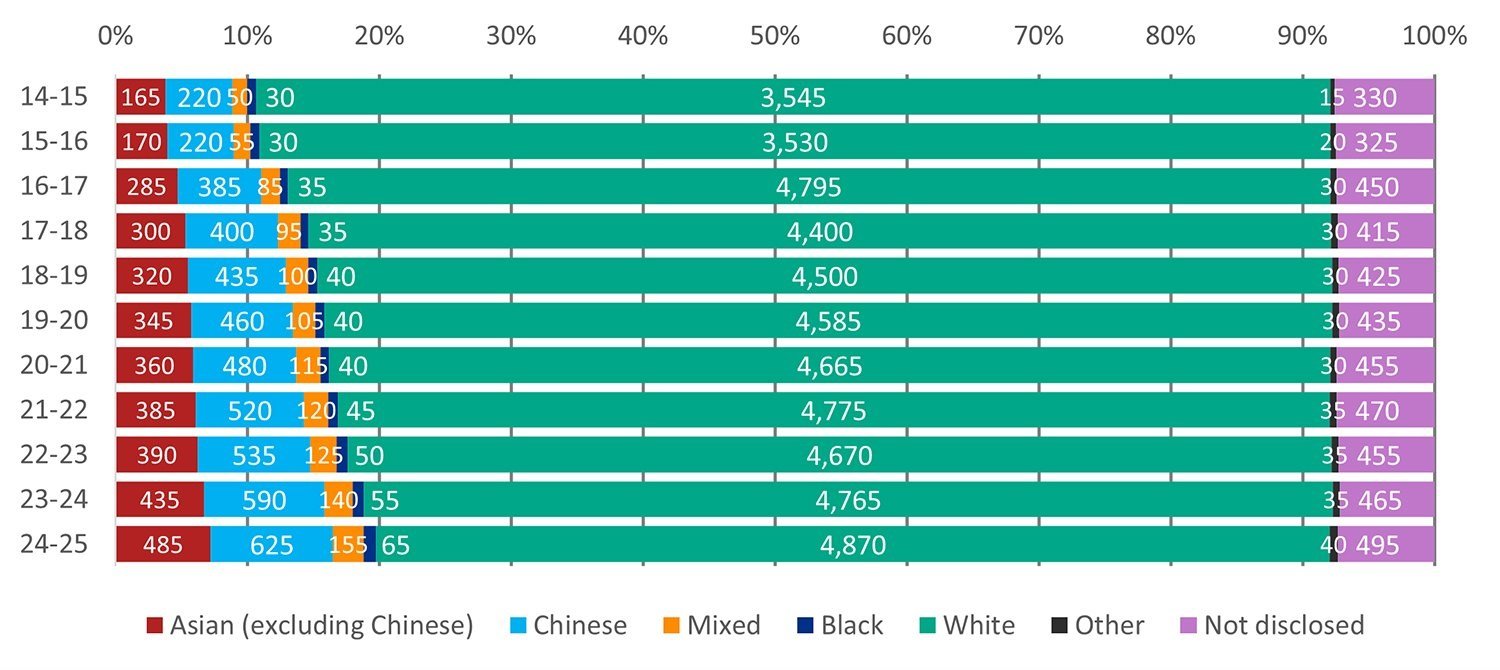
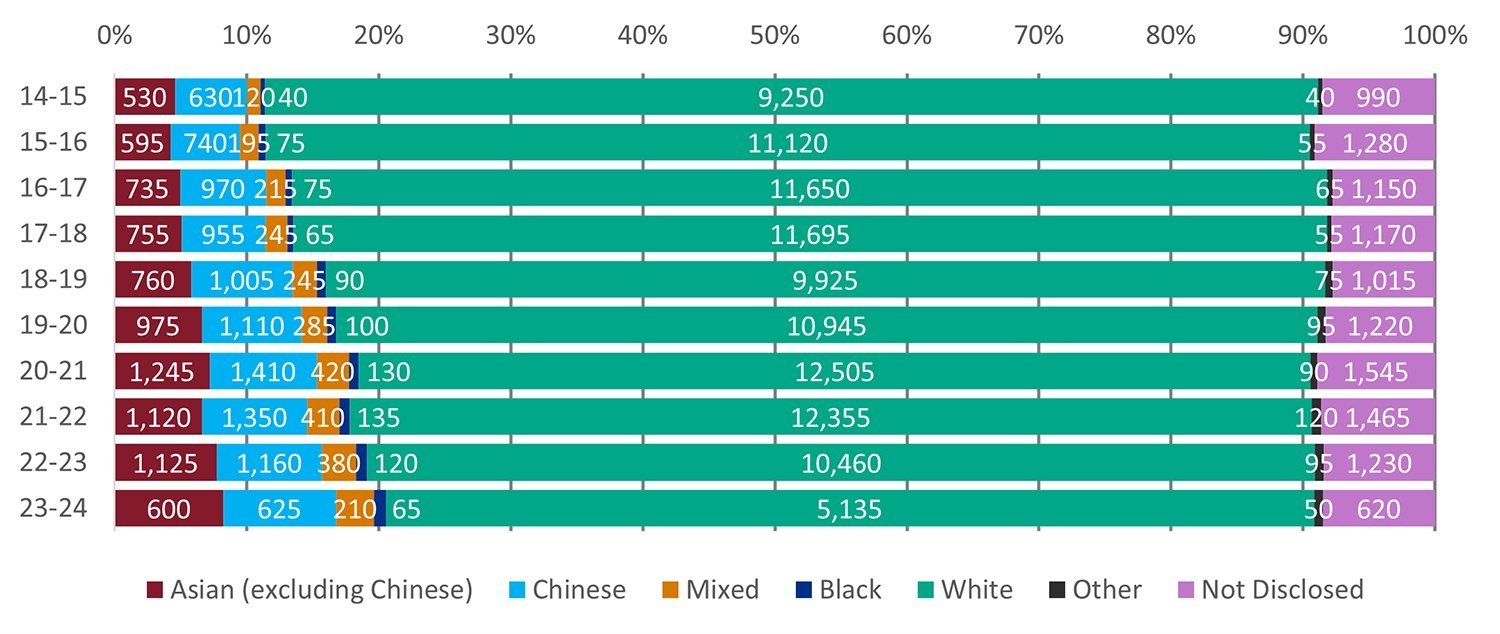
Ethnic group breakdown Level 3: disaggregated ethnic category of the Asian group
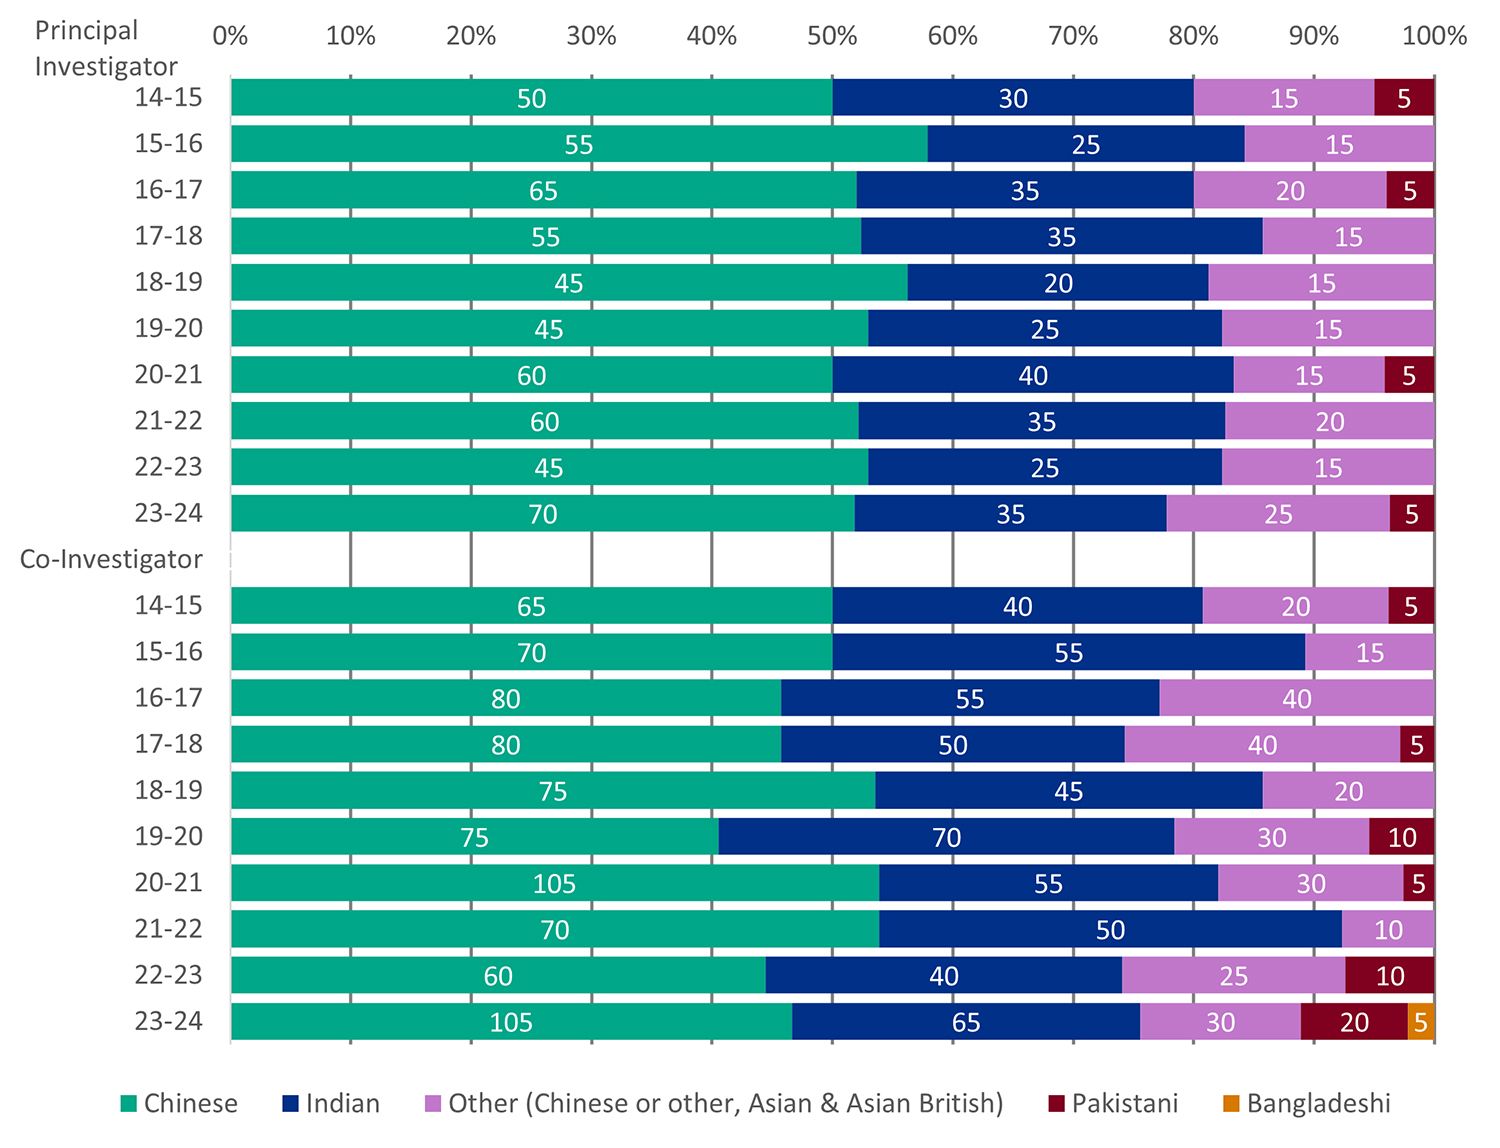
Among the Asian ethnic group, the Chinese and Indian ethnic groups form the largest grouping in all ten years.
The 2023 EPS HESA academic population of the Asian ethnic group consists of the following ethnicities:
- Chinese 46.0%
- Indian 21.9%
- Pakistani 6.4%
- Bangladeshi 2.9%
Chinese and Indian researchers form the largest proportion of applicants and awardees from the Asian ethnic groups for principal investigators, co-investigators and Fellows. Collectively, the two ethnicities form around 80% of all Asian investigator applicants and awardees. These two ethnicities are overrepresented compared to their 2023 HESA share in EPS, which is 67.9% of the Asian ethnic group.
In 2022 to 2023, Pakistani (approx. 6.4%) and Bangladeshi (approx. 2.1%) ethnicities form the smallest proportion amongst principal investigator applicants within the Asian ethnicity. The proportion of Bangladeshi principal investigator applicants is lower than their 2022 to 2023 HESA population estimate (2.9% of the Asian ethnic group), whereas that of Pakistani principal investigators is comparable to their HESA estimate (6.4% of the Asian ethnic group).
The proportion of Pakistani and Bangladeshi awardees are underrepresented.
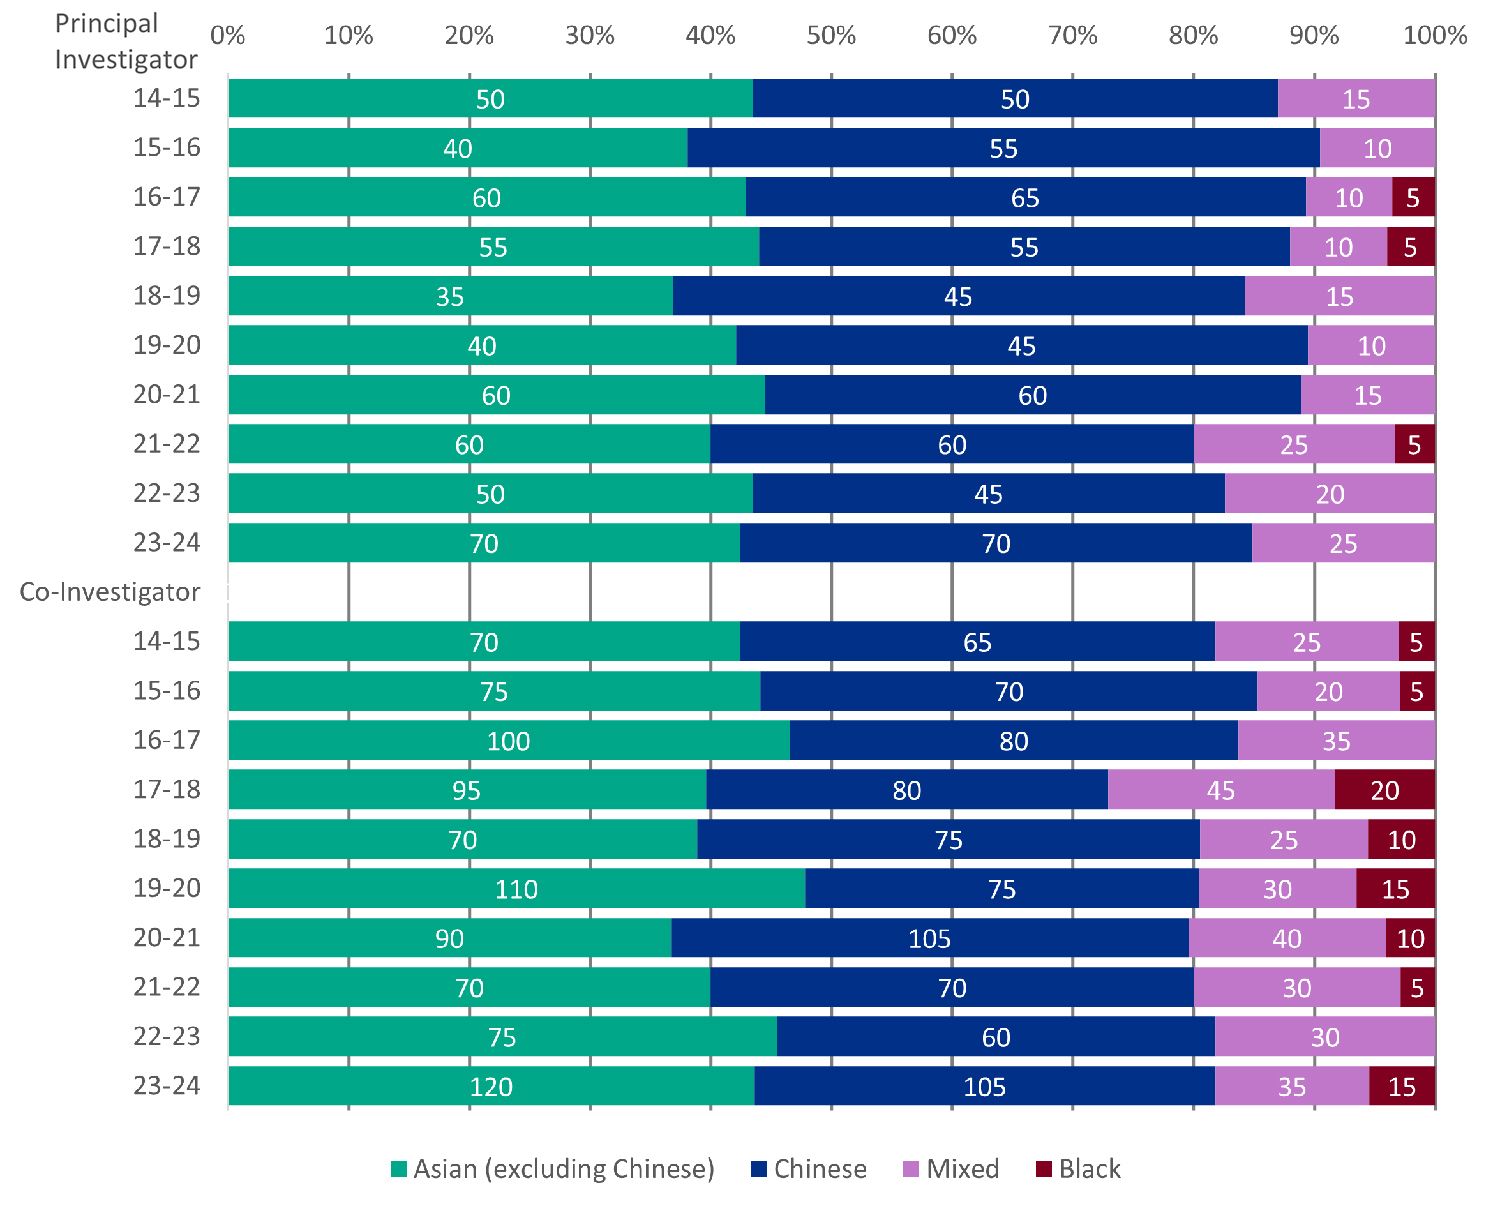
Figure 8: proportion and number of applicants for the Asian group by role and year
Download the data for figure 8 (ODS, 4KB)
Figure note: groups with count between 1 and 4 are suppressed and not shown, therefore the added bars may not present to 100% proportions. Counts of 0 are also not shown.
Figure 9: proportion and number of awardees for the Asian group by role and year
Download the data for figure 9 (ODS, 4KB)
Figure note: groups with count between 1 and 4 are suppressed and not shown, therefore the added bars may not present to 100% proportions. Counts of 0 are also not shown.
| Year | Chinese | Indian | Other | Pakistani | Bangladeshi |
|---|---|---|---|---|---|
| 2014-15 | [c] | [c] | [c] | 0 | 0 |
| 2015-16 | [c] | [c] | 0 | 0 | 0 |
| 2016-17 | [c] | [c] | [c] | 0 | 0 |
| 2017-18 | [c] | [c] | 0 | 0 | 0 |
| 2018-19 | 15 | [c] | [c] | [c] | 0 |
| 2019-20 | [c] | [c] | 0 | 0 | 0 |
| 2020-21 | [c] | [c] | [c] | 0 | [c] |
| 2021-22 | [c] | [c] | [c] | [c] | 0 |
| 2022-23 | [c] | [c] | [c] | 0 | 0 |
| 2023-24 | [c] | [c] | [c] | 0 | 0 |
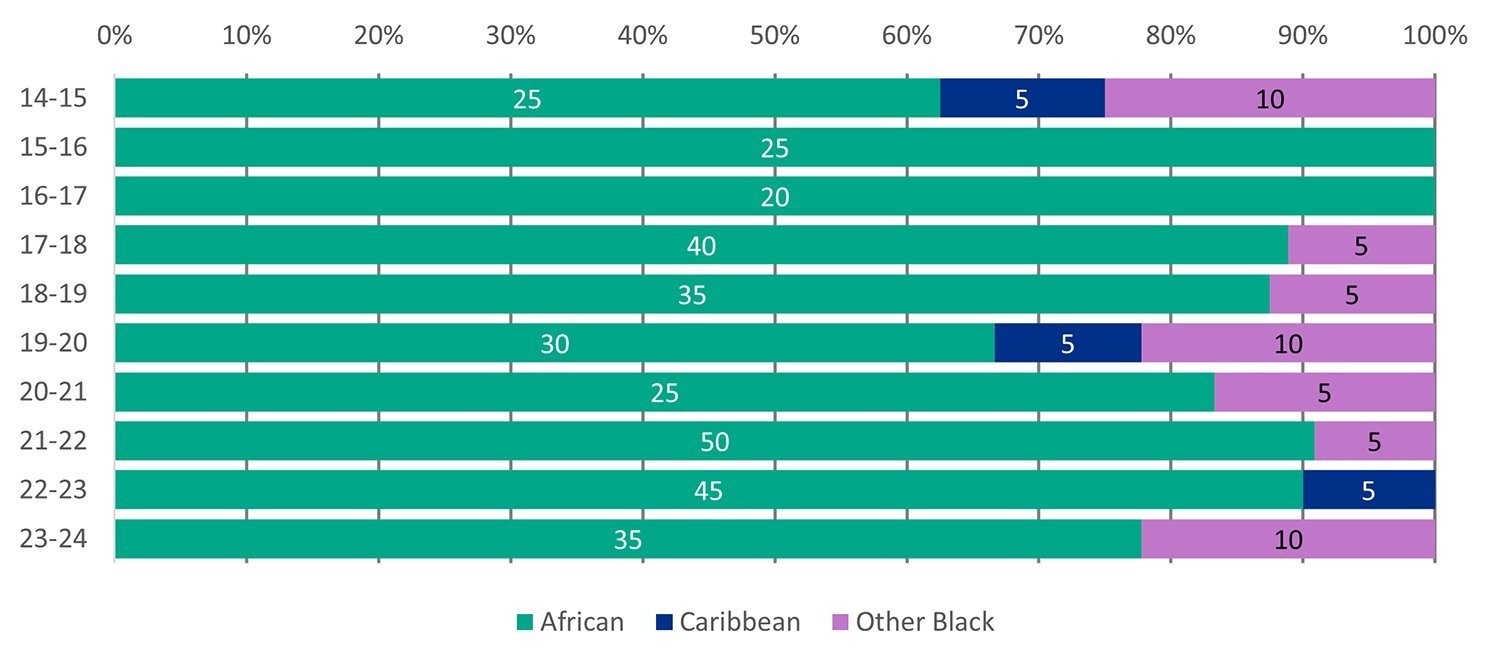
Ethnic group breakdown Level 3: disaggregated ethnic category of the Black group
Among Black ethnic groups, the Black British-African ethnicity is the predominant ethnic group.
| Role | Year | African | Caribbean | Other Black |
|---|---|---|---|---|
| Principal investigator | 2014-15 | 5 | 0 | [c] |
| Principal investigator | 2015-16 | 10 | 0 | [c] |
| Principal investigator | 2016-17 | 25 | 0 | [c] |
| Principal investigator | 2017-18 | 20 | 0 | [c] |
| Principal investigator | 2018-19 | 10 | 0 | [c] |
| Principal investigator | 2019-20 | 25 | [c] | [c] |
| Principal investigator | 2020-21 | 10 | [c] | [c] |
| Principal investigator | 2021-22 | 25 | [c] | [c] |
| Principal investigator | 2022-23 | 20 | 0 | [c] |
| Principal investigator | 2023-24 | 30 | [c] | [c] |
| Co-investigator | 2014-15 | 10 | [c] | [c] |
| Co-investigator | 2015-16 | 10 | [c] | [c] |
| Co-investigator | 2016-17 | 55 | [c] | [c] |
| Co-investigator | 2017-18 | 50 | 0 | 0 |
| Co-investigator | 2018-19 | 15 | [c] | [c] |
| Co-investigator | 2019-20 | 55 | [c] | [c] |
| Co-investigator | 2020-21 | 25 | [c] | [c] |
| Co-investigator | 2021-22 | 40 | [c] | [c] |
| Co-investigator | 2022-23 | 30 | [c] | [c] |
| Co-investigator | 2023-24 | 50 | [c] | [c] |
| Fellowship | 2014-15 | [c] | 0 | 0 |
| Fellowship | 2015-16 | [c] | 0 | 0 |
| Fellowship | 2016-17 | [c] | 0 | 0 |
| Fellowship | 2017-18 | 0 | 0 | 0 |
| Fellowship | 2018-19 | [c] | [c] | [c] |
| Fellowship | 2019-20 | 0 | 0 | 0 |
| Fellowship | 2020-21 | 0 | 0 | 0 |
| Fellowship | 2021-22 | [c] | 0 | 0 |
| Fellowship | 2022-23 | [c] | 0 | 0 |
| Fellowship | 2023-24 | [c] | 0 | 0 |
| Role | Year | African | Caribbean | Other Black |
|---|---|---|---|---|
| Principal investigator | 2014-15 | [c] | 0 | [c] |
| Principal investigator | 2015-16 | [c] | 0 | 0 |
| Principal investigator | 2016-17 | [c] | 0 | [c] |
| Principal investigator | 2017-18 | 5 | 0 | [c] |
| Principal investigator | 2018-19 | [c] | 0 | 0 |
| Principal investigator | 2019-20 | [c] | [c] | 0 |
| Principal investigator | 2020-21 | [c] | 0 | 0 |
| Principal investigator | 2021-22 | 5 | 0 | 0 |
| Principal investigator | 2022-23 | [c] | 0 | 0 |
| Principal investigator | 2023-24 | [c] | 0 | 0 |
| Co-investigator | 2014-15 | [c] | [c] | [c] |
| Co-investigator | 2015-16 | [c] | 0 | [c] |
| Co-investigator | 2016-17 | [c] | 0 | 0 |
| Co-investigator | 2017-18 | 20 | 0 | 0 |
| Co-investigator | 2018-19 | [c] | [c] | [c] |
| Co-investigator | 2019-20 | 15 | 0 | 0 |
| Co-investigator | 2020-21 | 5 | 0 | [c] |
| Co-investigator | 2021-22 | [c] | [c] | 0 |
| Co-investigator | 2022-23 | [c] | [c] | 0 |
| Co-investigator | 2023-24 | 15 | 0 | 0 |
| Fellowship | 2014-15 | 0 | 0 | 0 |
| Fellowship | 2015-16 | 0 | 0 | 0 |
| Fellowship | 2016-17 | 0 | 0 | 0 |
| Fellowship | 2017-18 | 0 | 0 | 0 |
| Fellowship | 2018-19 | [c] | 0 | [c] |
| Fellowship | 2019-20 | 0 | 0 | 0 |
| Fellowship | 2020-21 | 0 | 0 | 0 |
| Fellowship | 2021-22 | 0 | 0 | 0 |
| Fellowship | 2022-23 | 0 | 0 | 0 |
| Fellowship | 2023-24 | [c] | 0 | 0 |
Due to small application and award numbers, no meaningful data can be drawn for Black ethnic groups.
In each of the 10 reporting years, the number of fellowship applicants and awardees from the Black ethnic group were less than five.
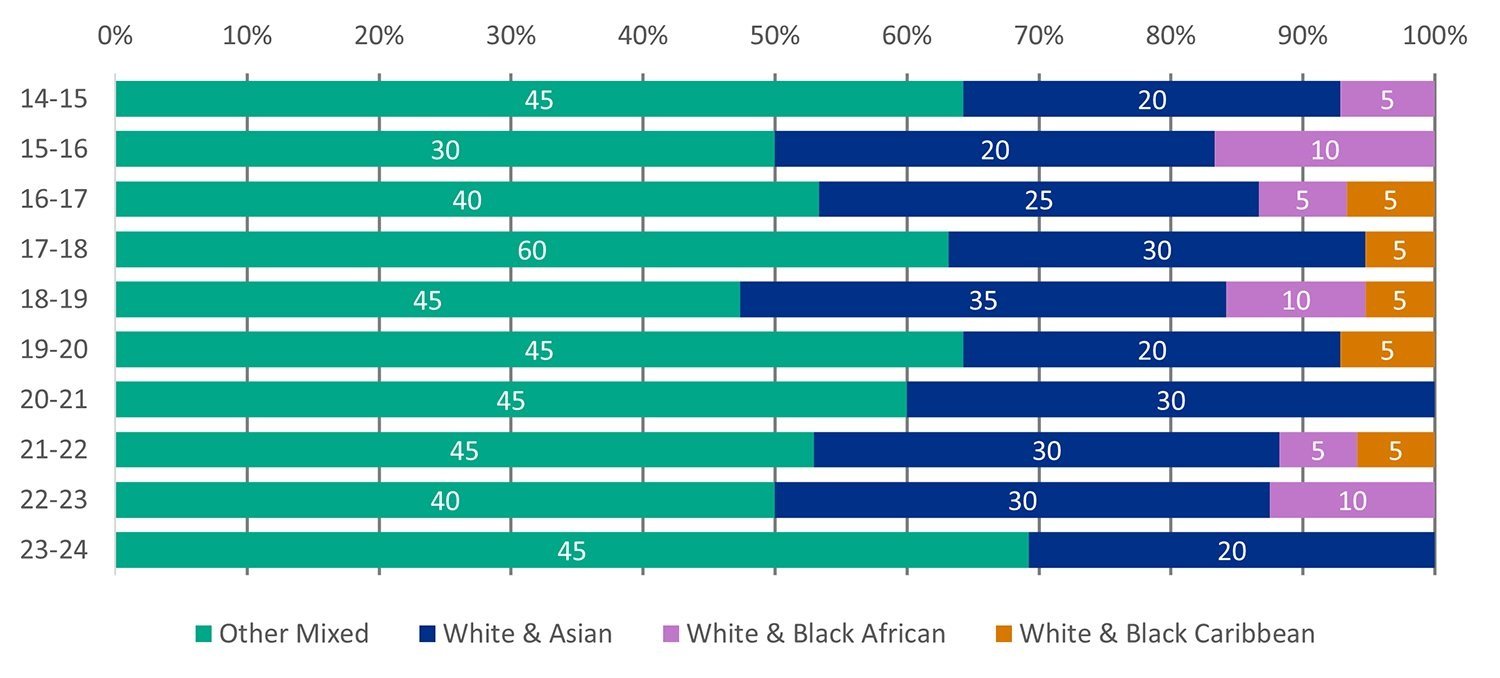
Ethnic group breakdown Level 3: disaggregated ethnic category of the Mixed group
Within the Mixed ethnic group, the ‘Other’ ethnicity is the largest for both applicants and awardees.
Over 60% of the applicants and awardees in the Mixed ethnic group identified as ‘Other’, suggesting that the current categories are not effectively capturing the full range of possible identities.
Approximately, 20% of principal investigator applicants and awardees from the Mixed ethnic group said that they identified with the White and Asian ethnicity.
The number of Fellows awarded from the Mixed ethnic group were less than five in the ten reporting years.
Figure 10: proportion and number of applicants for the Mixed group by role and year
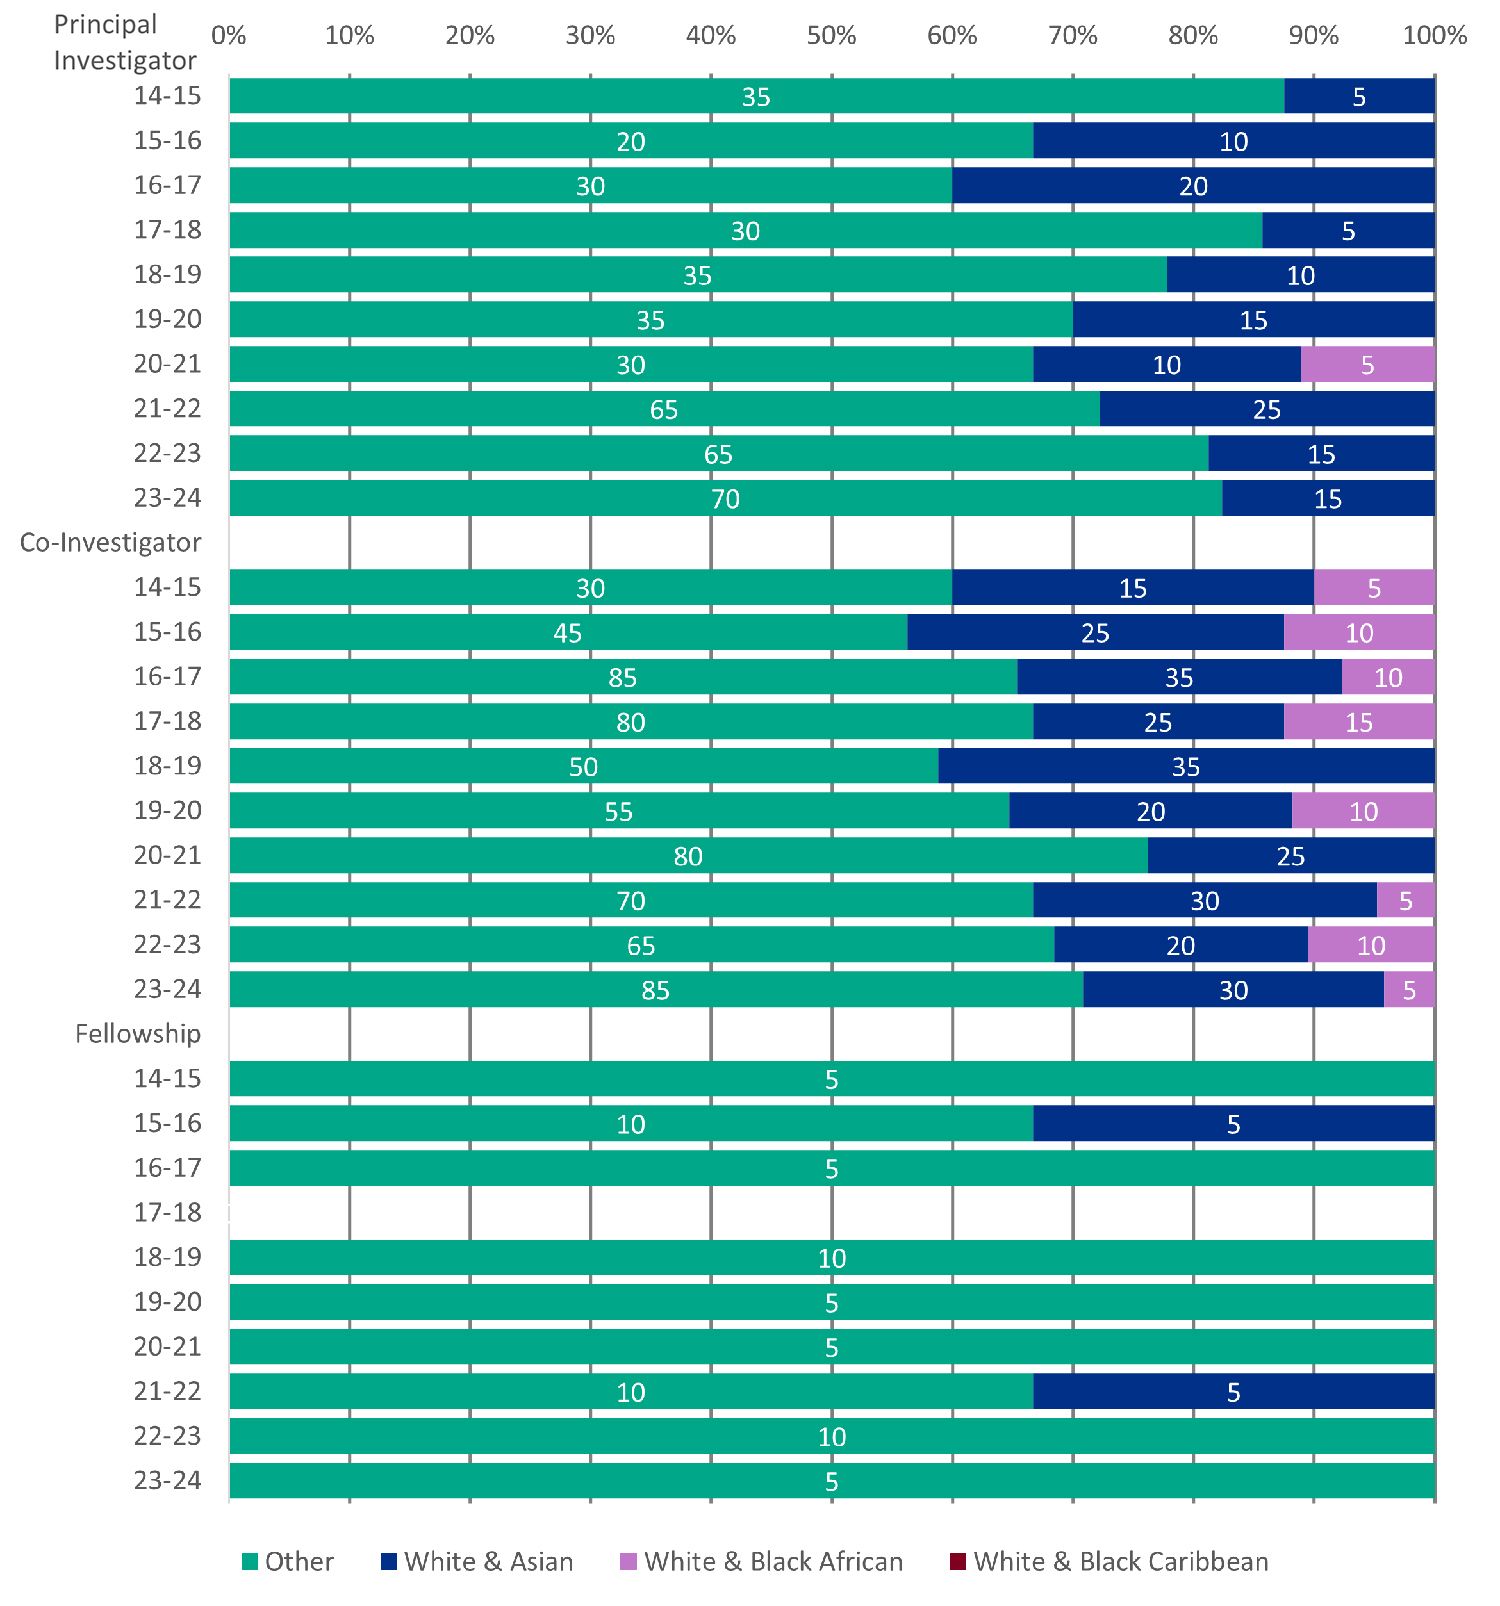
Download the data for figure 10 (ODS, 4KB)
Figure note: groups with count between 1 and 4 are suppressed and not shown, therefore the added bars may not present to 100% proportions. Counts of 0 are also not shown.
Figure 11: proportion and number of awardees for the Mixed group by role and year
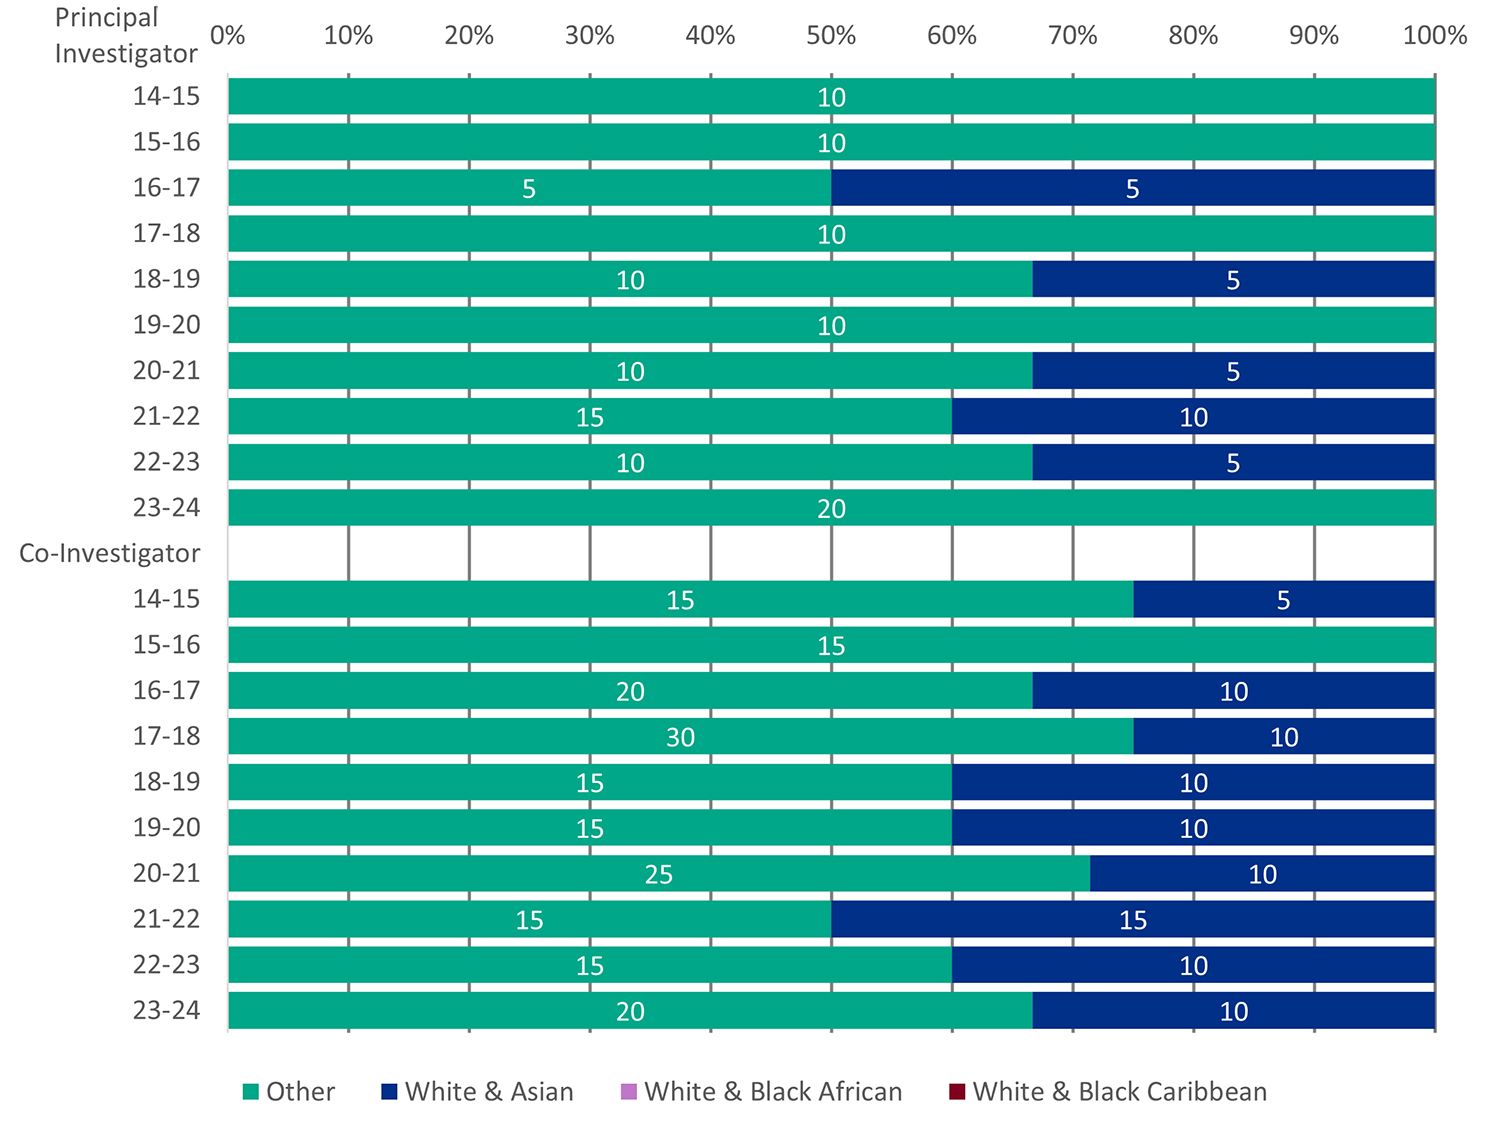
Download the data for figure 11 (ODS, 4KB)
Figure note: groups with count between 1 and 4 are suppressed and not shown, therefore the added bars may not present to 100% proportions. Counts of 0 are also not shown.
| Year | Other | White and Asian | White and Black African | White and Black Caribbean |
|---|---|---|---|---|
| 2014-15 | [c] | 0 | 0 | 0 |
| 2015-16 | 0 | [c] | 0 | [c] |
| 2016-17 | [c] | [c] | 0 | 0 |
| 2017-18 | 0 | 0 | 0 | 0 |
| 2018-19 | [c] | [c] | 0 | 0 |
| 2019-20 | [c] | 0 | 0 | 0 |
| 2020-21 | [c] | [c] | 0 | 0 |
| 2021-22 | [c] | [c] | 0 | 0 |
| 2022-23 | [c] | 0 | 0 | 0 |
| 2023-24 | [c] | 0 | 0 | 0 |
Award rates by detailed ethnicity categories by role and year
Award rates within the minority ethnic group varies.
The award rates for the Asian and Chinese ethnic groups closely reflect the overall award rate for minority ethnic applicants, as these groups represent the majority within the minority ethnic population.
The award rate for principal investigator, co-investigator and fellowship applicants who identify as White is generally higher than that of applicants from minority ethnic groups across most reporting years, even when accounting for fluctuations due to small number statistics.
The award rate of Fellows from minority ethnic groups is not presented for most years, as the number of awardees from these groups are less than five.
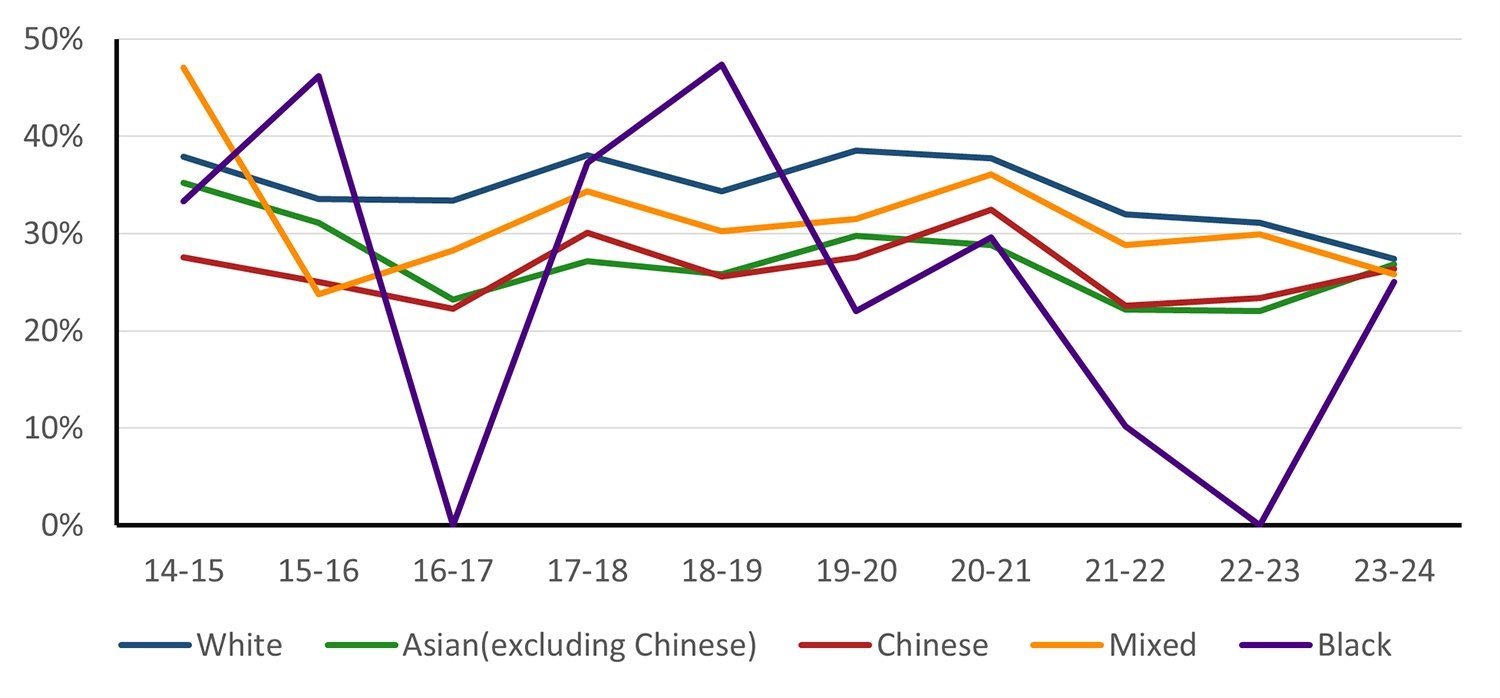
Figure 12: award rates for principal investigator by year
Download the data for figure 12 (ODS, 4KB)
Figure notes: Award rates for groups comprising fewer than five individuals are not reported. The symbol ‘[c]’ means the value has been suppressed.
Figure 13: award rates for co-investigator by year
Download the data for figure 13 (ODS, 4KB)
Figure notes: Award rates for groups comprising fewer than five individuals are not reported. The symbol ‘[c]’ means the value has been suppressed.
| Year | White | Asian (excluding Chinese) | Chinese | Mixed | Black |
|---|---|---|---|---|---|
| 2014-15 | 27% | [c] | [c] | [c] | 0% |
| 2015-16 | 19% | [c] | [c] | [c] | 0% |
| 2016-17 | 23% | [c] | [c] | [c] | 0% |
| 2017-18 | 20% | [c] | [c] | 0% | 0% |
| 2018-19 | 28% | 25% | 47% | 31% | [c] |
| 2019-20 | 18% | [c] | [c] | [c] | 0% |
| 2020-21 | 29% | [c] | [c] | [c] | 0% |
| 2021-22 | 20% | 13% | [c] | [c] | 0% |
| 2022-23 | 22% | [c] | [c] | [c] | 0% |
| 2023-24 | 15% | [c] | [c] | [c] | [c] |
Comparisons of EPSRC doctoral studentships with EPS PGR population
The ethnicity of approximately 36% of EPSRC’s doctoral students is either undisclosed or unknown. For the years 2022 to 2023 and 2023 to 2024, this figure rises to around 40% and 36%, respectively. Among students with disclosed ethnicity, around 17% in 2021 to 2022, and 19% and 21% in 2022 to 2023 and 2023 to 2024, respectively, identify as being from minority ethnic groups.
Note: it is suspected that the higher proportion of ‘unknown’ and ’not disclosed’ data is due to personal data being submitted by the university research office rather than by individual students.
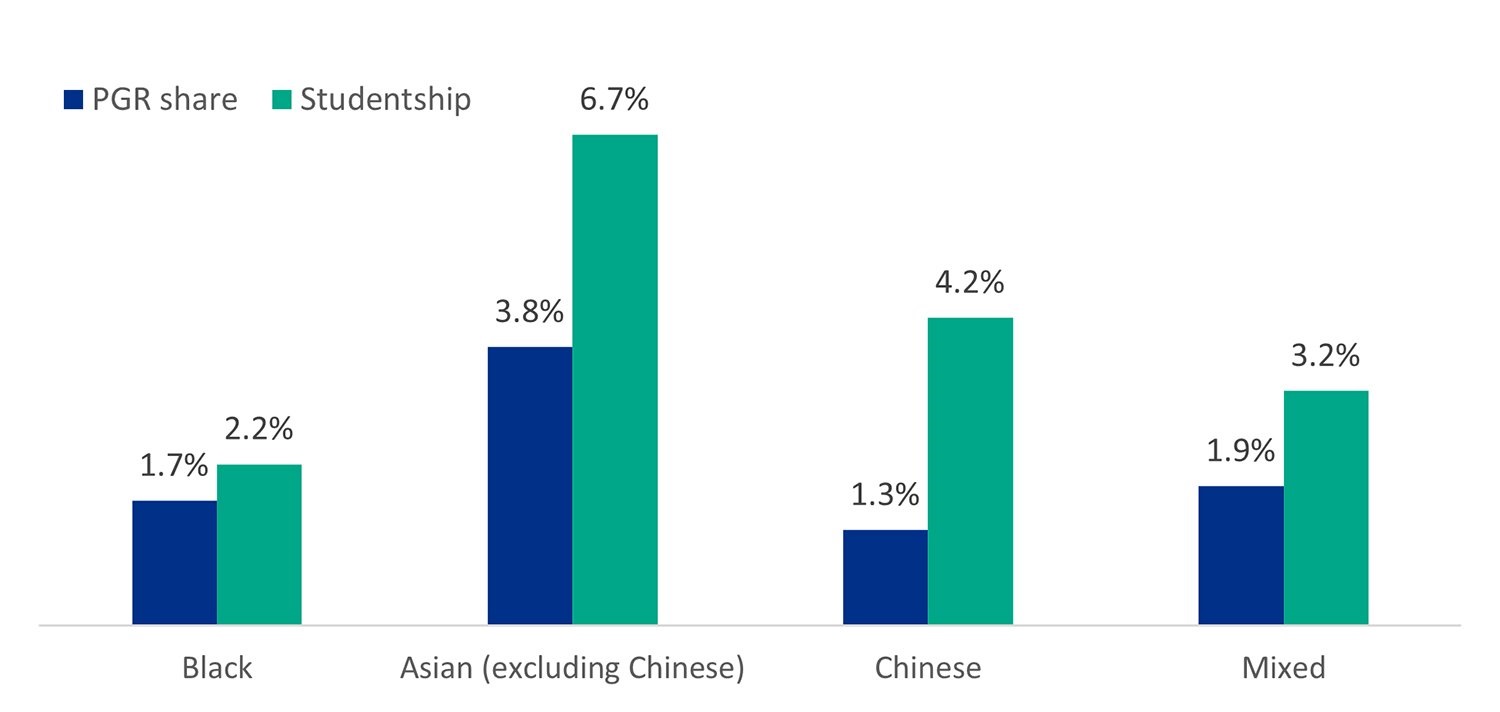
Among minority ethnic recipients of studentships, more than 60% are from the Asian ethnic (including Chinese) group, followed by students with Mixed ethnicities and then Black ethnicities, which reflects the relative composition of the aggregate minority ethnic PGR population (HESA estimate). HESA student records cover all students in the UK regardless of domicile or nationality, except for ethnicity, which is characterised as ‘students with a UK permanent address’.
All minority ethnic groups are overrepresented relative to their share of the PGR population share. However, it is important to note that studentship data is affected by high non-disclosure rates and HESA student records on ethnicity are characterised as ‘students with a UK permanent address’.
Figure 14: comparison of EPSRC studentships and aggregated HESA minority ethnic PGR population (2021 to 2022)
Download the data for figure 14 (ODS, 3KB)
EPSRC studentship data
Ethnic group breakdown for all ethnic groups
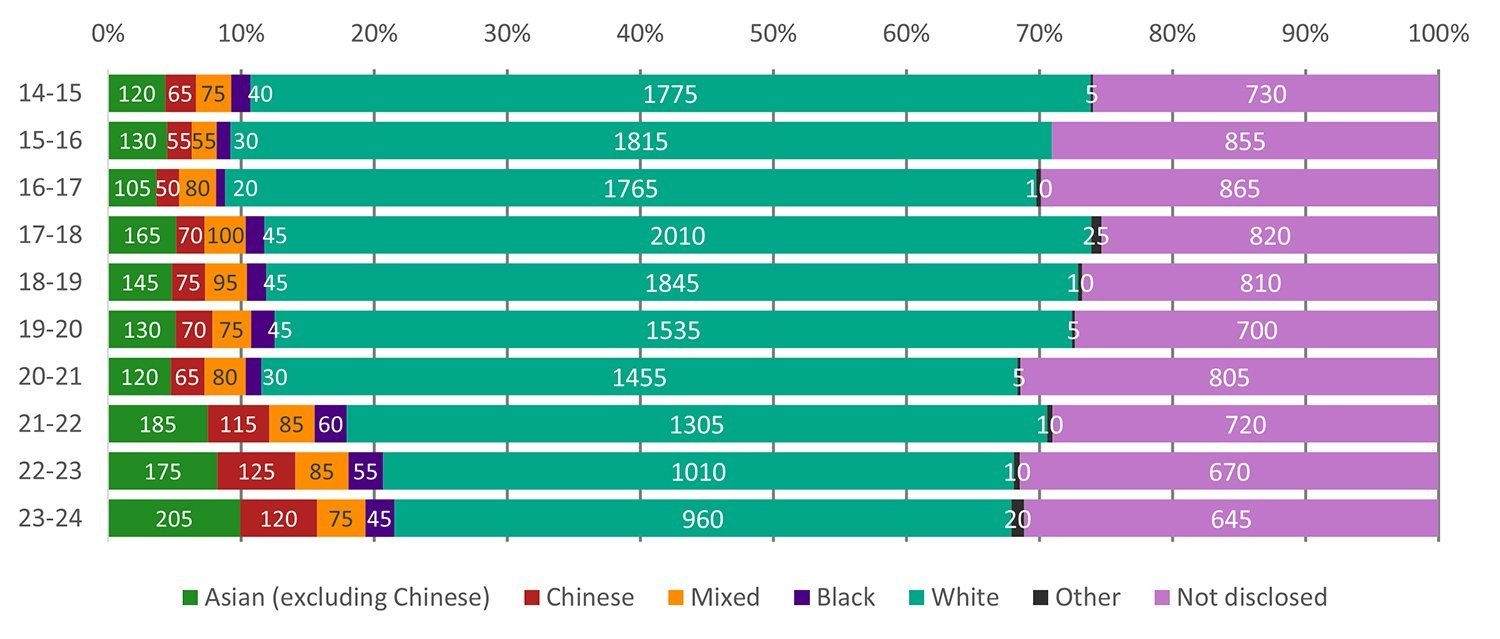
Doctoral students who identify themselves as Asian represent the largest share of doctoral student new starts from the minority ethnic group each year.
The ethnicity of around 36% of EPSRC’s doctoral students are not disclosed or unknown. Where ethnicity is disclosed, 17% of doctoral student new starts are from minority ethnic groups. In 2021 to 2022, HESA data shows that approximately 10% of PGR from the EPS disciplines identify themselves as from a minority ethnic group. However, it should be remembered that HESA student records on ethnicity are characterised as ‘students with a UK permanent address’.
EPSRC doctoral students from Asian (including Chinese) ethnic groups represent over 60% of all minority ethnic recipients, followed by students with Mixed and then Black ethnicities.
Figure 15: proportion of EPSRC studentship new starts by year
Download the data for figure 15 (ODS, 4KB)
Figure notes: Award rates for groups comprising fewer than five individuals are not reported. The symbol ‘[c]’ means the value has been suppressed. For accessibility, the ‘unknown’ category is not displayed on the chart but is included in the downloadable file.
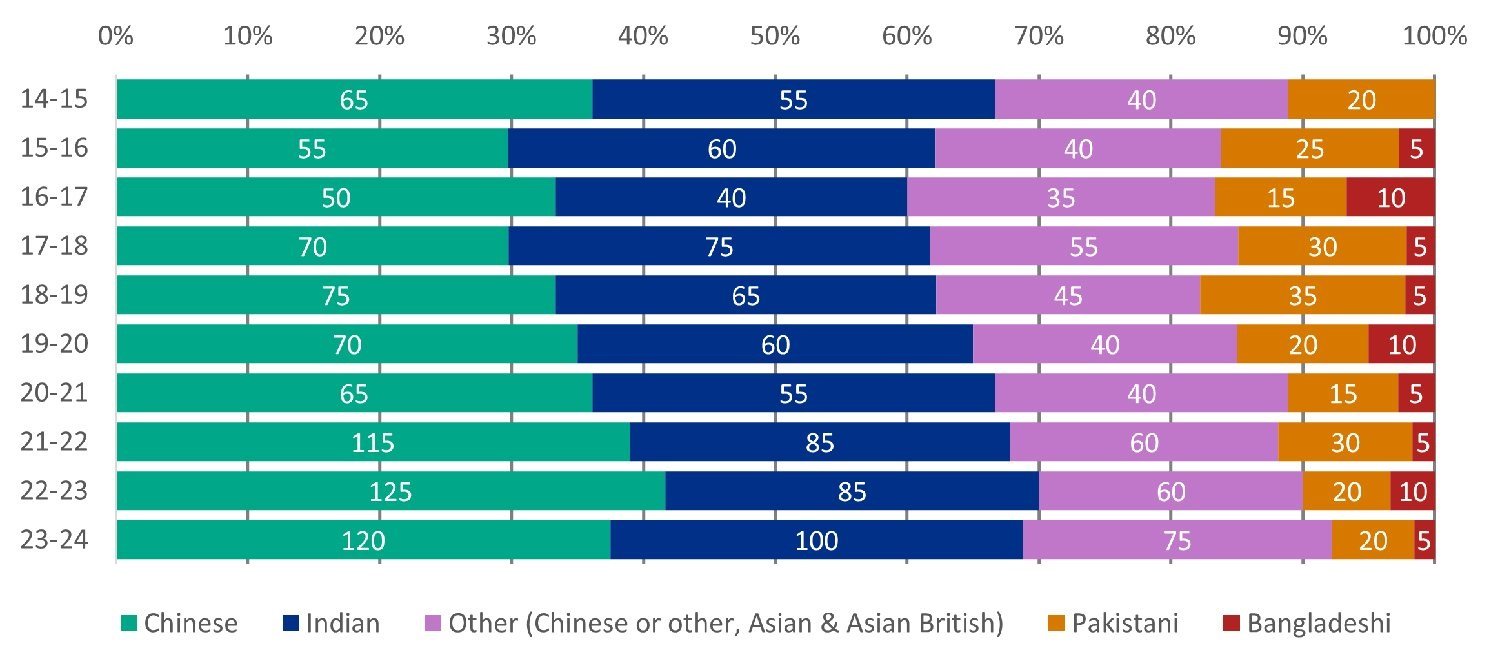
Ethnic group breakdown Level 3: disaggregated ethnic category of the Asian group
Doctoral students from Chinese and Indian ethnic groups account for more than 60% of the Asian ethnic group studentship new starts across the reporting period.
Within the Asian ethnic group, students from Indian and Chinese ethnicities make up 60% or more of studentship starts. The ‘Other’ ethnicity is the next largest group, comprising approximately 20%.
Doctoral students with Pakistani and Bangladeshi ethnicities form the smallest groups (ranging from 2% to 16% of the Asian ethnic group over the reporting period).
Figure 16: proportion and number of Asian EPSRC studentship new starts by year
Download the data for figure 16 (ODS, 3KB)
Figure notes: Award rates for groups comprising fewer than five individuals are not reported. The symbol ‘[c]’ means the value has been suppressed.
Ethnic group breakdown Level 3: disaggregated ethnic category of the Black group
Doctoral students who identify as Black British-African are the predominant group of studentship new starts amongst the Black ethnic group.
Amongst awardees from Black ethnic groups, students from Black British-African ethnicities are the predominant recipients.
There are only small numbers of doctoral students from Black British-Caribbean and Other Black ethnicities.
The pattern of distribution amongst the Black ethnic group of doctoral students has not shown any major changes over the ten reporting years.
Figure 17: proportion and number of Black EPSRC studentship new starts by year
Download the data for figure 17 (ODS, 3KB)
Ethnic group breakdown Level 3: disaggregated ethnic category of Mixed group
Doctoral students who identify as Other represent more than half of the Mixed ethnic group studentship new starts.
Amongst the Mixed ethnic group, over 50% of doctoral students identify their ethnicity as ‘Other’, followed by the White and Asian ethnicity.
Doctoral students identifying as White and Black African, and White and Black Caribbean, make up a much smaller proportion of this group.
The pattern of distribution amongst the Mixed ethnic group doctoral students has not shown any major changes over the 10 reporting years.
Figure 18: proportion and number of Mixed EPSRC studentship new starts by year
Download the data for figure 18 (ODS, 3KB)
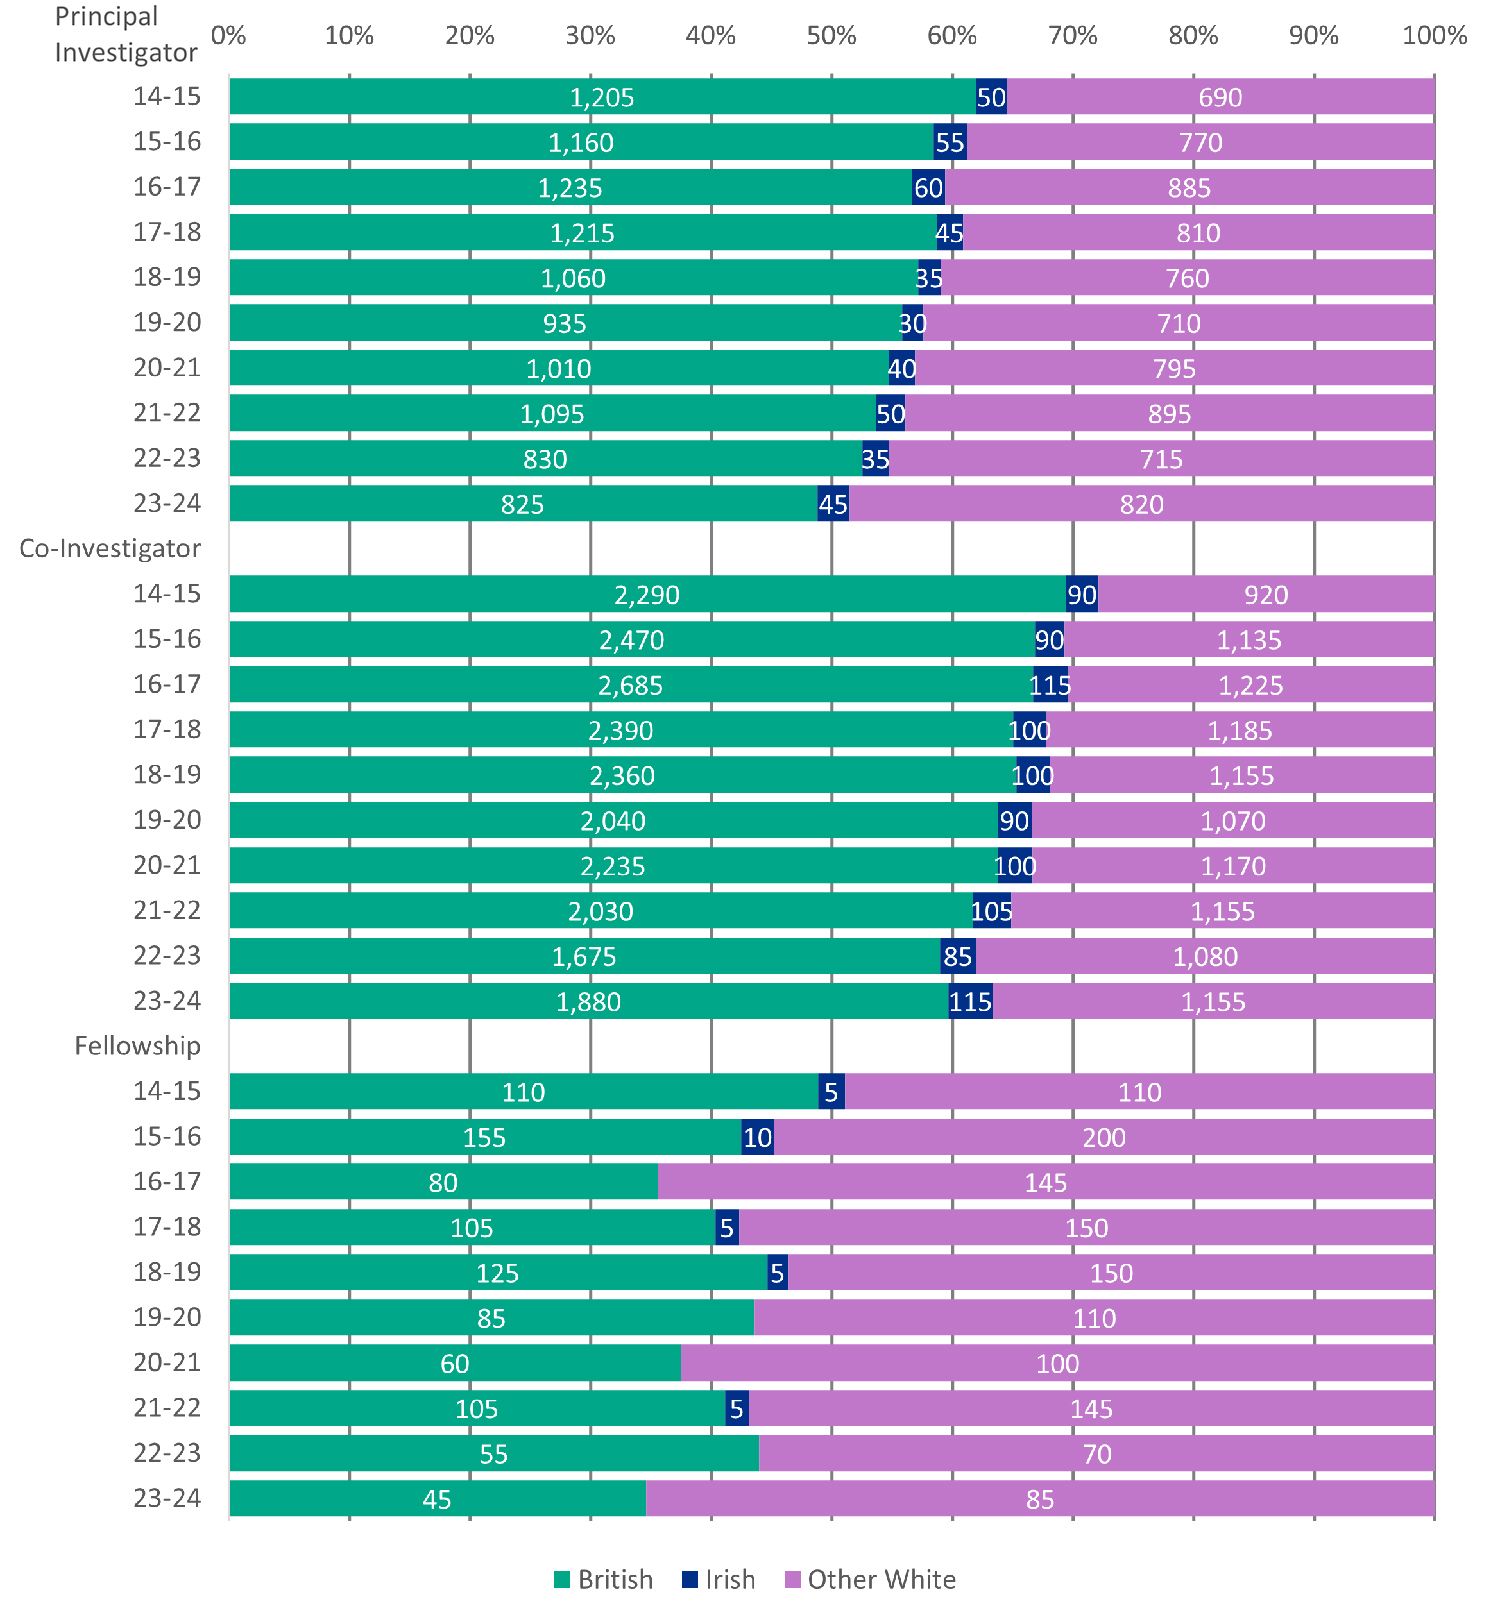
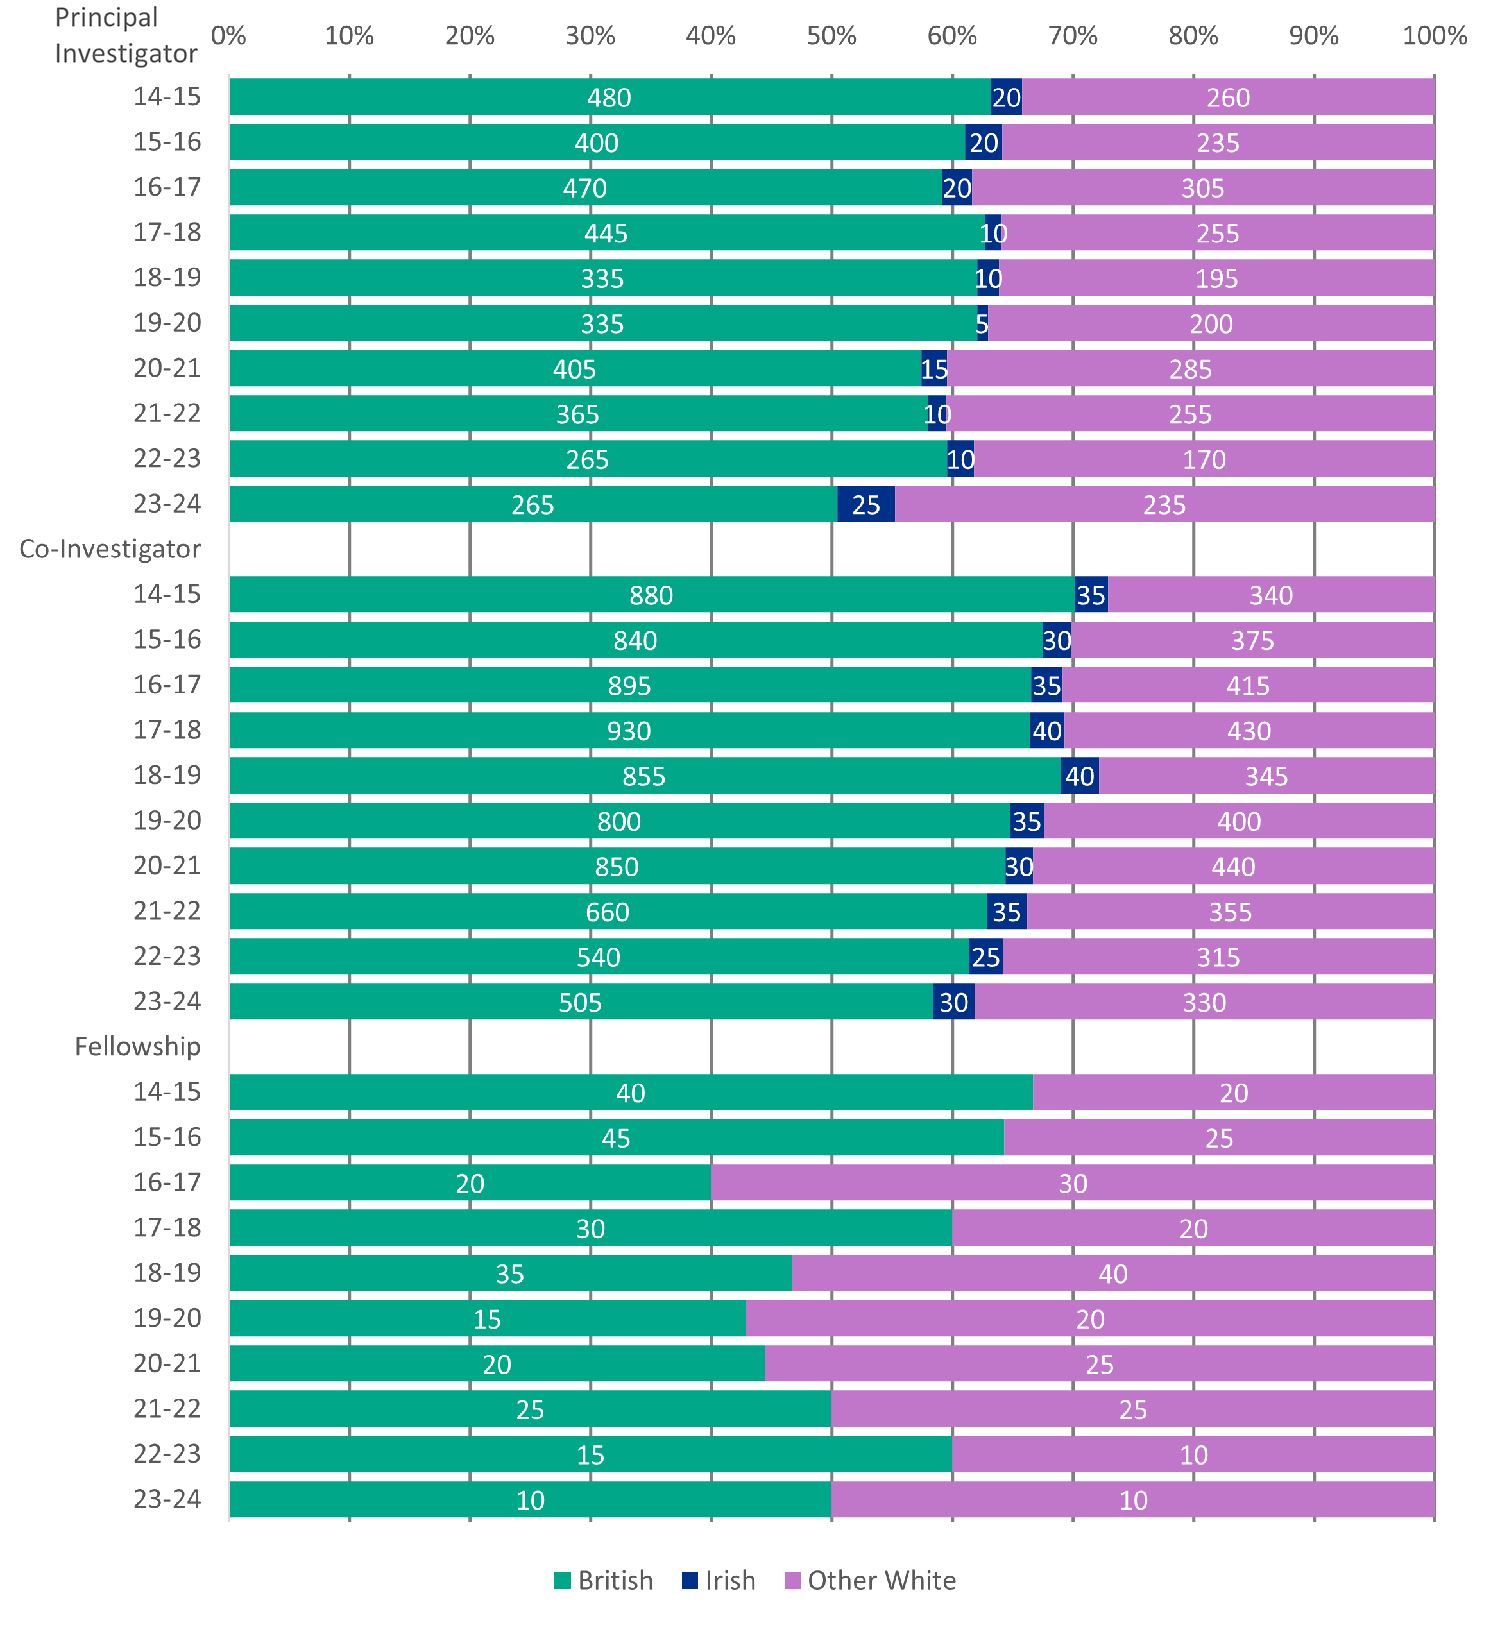
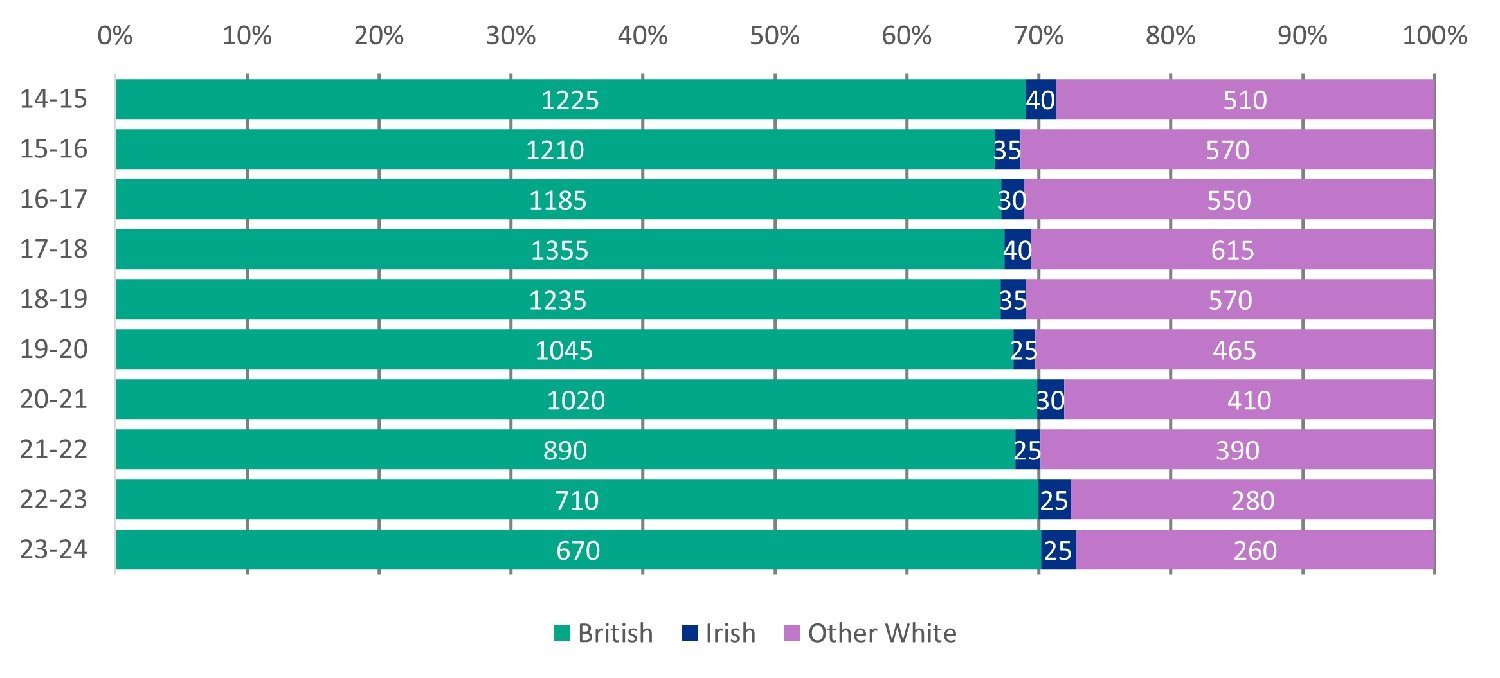
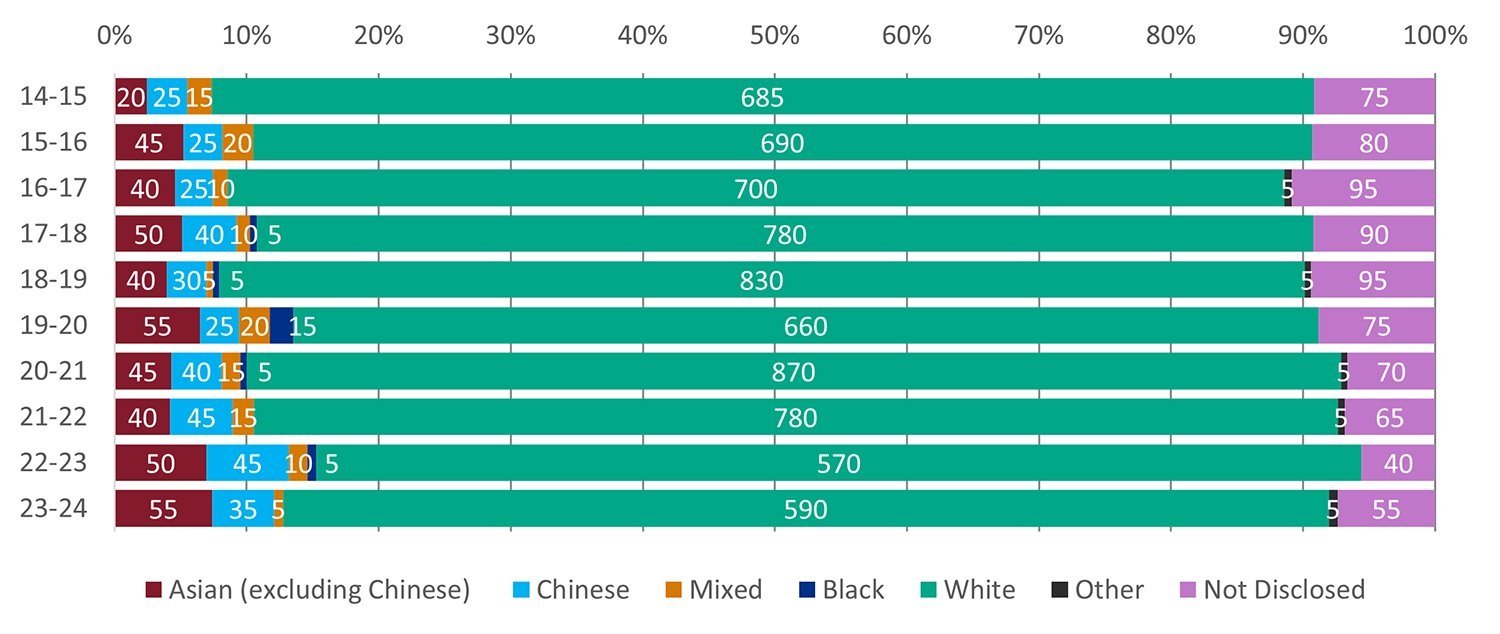
Applicants and awardees disaggregated ethnic category of the White group
White British researchers make up around 50% of the White ethnic group principal investigator and co-investigator applicants, and about 40% of the White ethnic group fellowship applicants.
Exploring the White ethnic group, around 50% of principal investigator and co-investigator applicants identify as White British, making this category the largest amongst the White ethnic group, followed by the ethnicities of White Other and White Irish. This distribution is also reflected in the allocation of awards.
The distribution of fellowship awardees is more evenly split between the White British and White Other ethnic categories, with White British applicants comprising around 40%.
The distribution of awardees within the White ethnic group has not significantly changed over the reporting period, although there has been a gradual increase in the number of applicants and awardees from the White Other category.
Figure 19: proportion and number of applicants for the White group by role and year
Download the data for figure 19 (ODS, 4KB)
Figure 20: proportion and number of awardees for the White group by role and year
Download the data for figure 20 (ODS, 4KB)
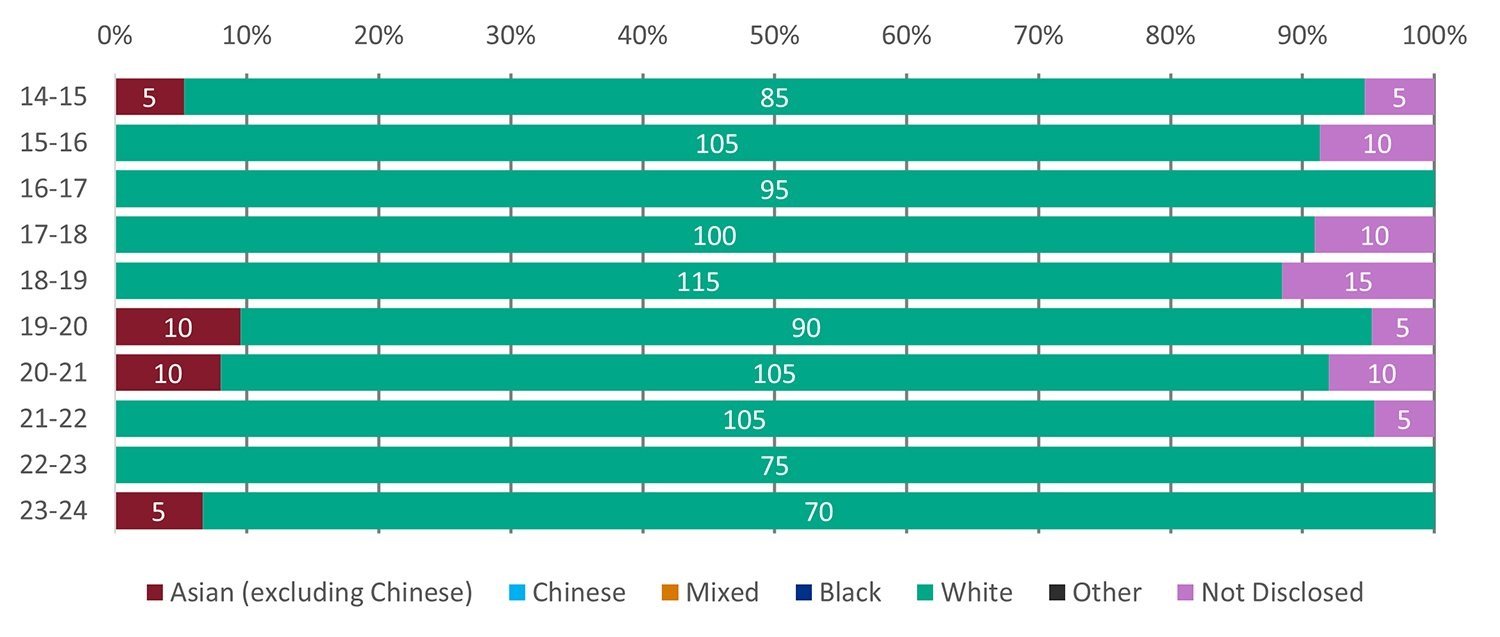
Doctoral studentship disaggregated ethnic category of the White group
Doctoral students who identify as White British form two-thirds of all White ethnic group studentship new starts.
Students identifying as White account for approximately 48% of all EPSRC studentship recipients in 2021 to 2022, 41% in 2022 to 2023, and 44% in 2023 to 2024. This represents a decrease from around 57% in 2018 to 2019.
Of the White ethnic group studentship awardees, two-thirds are from the White British ethnic group, followed by almost 30% from the White Other ethnic group.
The pattern of distribution amongst doctoral students in the White ethnic group has not shown any significant changes over the reporting period.
Figure 21: proportion and number of White EPSRC studentship new starts by year
Download the data for figure 21 (ODS, 3KB)
EPSRC Peer Review College
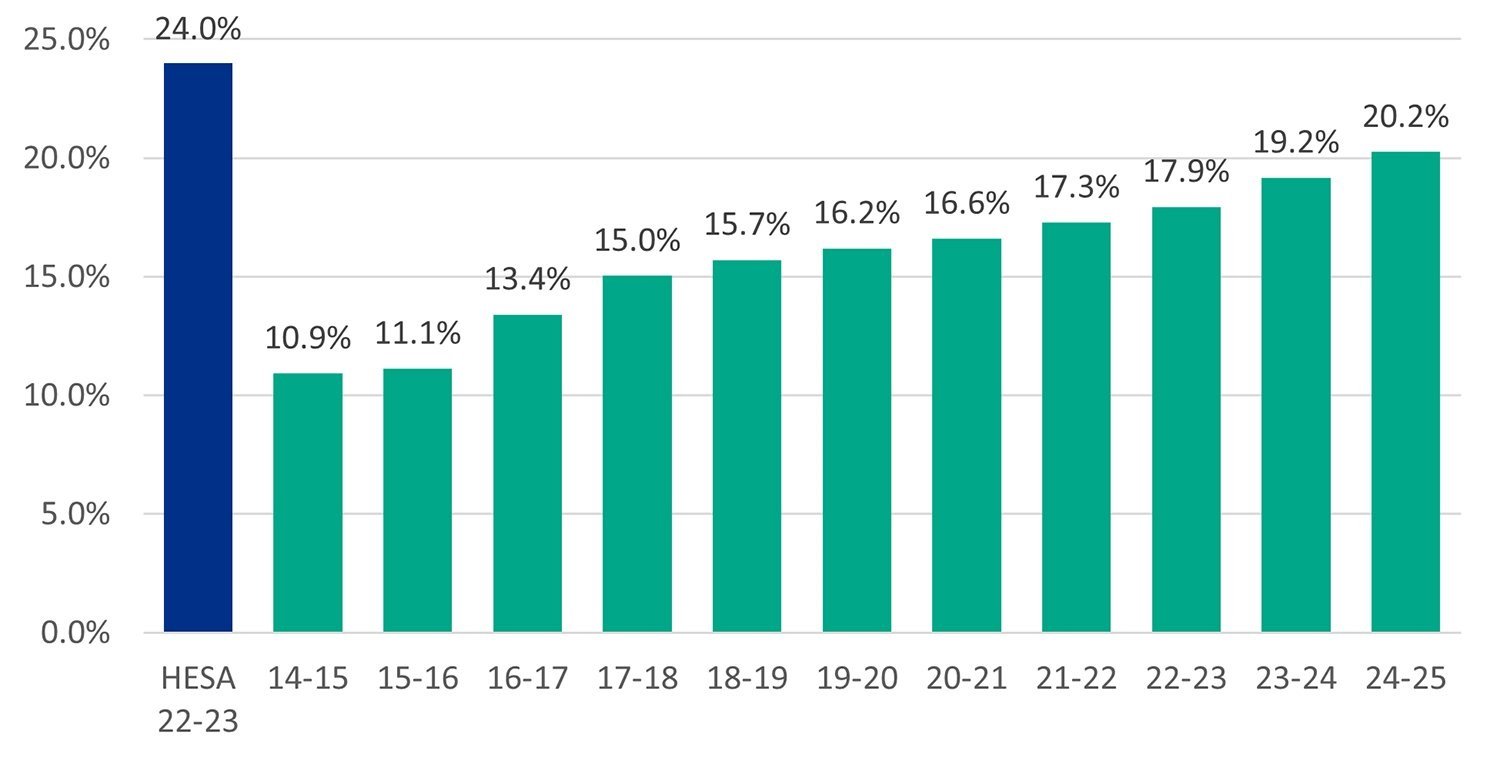
For eleven consecutive years, there has been an increase in the proportion of individuals identifying as minority ethnic.
The proportion of minority ethnic groups, including Asian (excluding Chinese), Black, Chinese, Mixed, and Other, has increased from 10.9% in 2014 to 2015, to 20.2% in 2024 to 2025. However, this remains below the HESA EPS academic population share of 24.0%.
Figure 22: proportion of minority ethnic in the Peer Review College by year compared with the HESA EPS minority ethnic population
Download the data for figure 22 (ODS, 4KB)
| Financial year | Asian (excluding Chinese) | Black | Chinese | Mixed | Not disclosed | Other | Unknown | White |
|---|---|---|---|---|---|---|---|---|
| 2014-15 | 4% | 1% | 5% | 1% | 8% | 0% | 1% | 81% |
| 2015-16 | 4% | 1% | 5% | 1% | 7% | 0% | 1% | 80% |
| 2016-17 | 5% | 1% | 6% | 1% | 7% | 0% | 1% | 78% |
| 2017-18 | 5% | 1% | 7% | 2% | 7% | 1% | 1% | 77% |
| 2018-19 | 5% | 1% | 7% | 2% | 7% | 1% | 1% | 76% |
| 2019-20 | 6% | 1% | 8% | 2% | 7% | 1% | 1% | 76% |
| 2020-21 | 6% | 1% | 8% | 2% | 7% | 1% | 1% | 75% |
| 2021-22 | 6% | 1% | 8% | 2% | 7% | 1% | 1% | 75% |
| 2022-23 | 6% | 1% | 8% | 2% | 7% | 1% | 1% | 74% |
| 2023-24 | 7% | 1% | 9% | 2% | 7% | 1% | 1% | 73% |
| 2024-25 | 7% | 1% | 9% | 2% | 7% | 1% | 1% | 72% |
Figure 23: Peer Review College numbers and proportions of ethnicity groups by year
 Download the data for figure 23 (ODS, 4KB)
The proportion of minority ethnic researchers within our peer review community has significantly increased but differentially across categories.
In financial year 2015 to 2016, EPSRC refreshed the College membership and actively encouraged nominations from under-represented groups.
Since 2021, EPSRC has been actively encouraging self-nominations for the College membership to increase the minority ethnic representation on the College. See how to join the college
Reviewer population
There is an increase in the proportion of minority ethnic researchers being requested to provide reviews by EPSRC.
| Financial year | Asian (excluding Chinese) | Black | Chinese | Mixed | Not disclosed | Other | Unknown | White |
|---|---|---|---|---|---|---|---|---|
| 2014-15 | 4% | 0% | 5% | 1% | 8% | 0% | 4% | 77% |
| 2015-16 | 4% | 1% | 5% | 1% | 9% | 0% | 4% | 76% |
| 2016-17 | 5% | 0% | 6% | 1% | 8% | 0% | 3% | 76% |
| 2017-18 | 5% | 0% | 6% | 2% | 8% | 0% | 3% | 76% |
| 2018-19 | 6% | 1% | 7% | 2% | 8% | 1% | 3% | 74% |
| 2019-20 | 6% | 1% | 7% | 2% | 8% | 1% | 4% | 72% |
| 2020-21 | 7% | 1% | 8% | 2% | 9% | 1% | 4% | 69% |
| 2021-22 | 6% | 1% | 8% | 2% | 8% | 1% | 4% | 70% |
| 2022-23 | 7% | 1% | 8% | 2% | 8% | 1% | 5% | 68% |
| 2023-24 | 8% | 1% | 8% | 3% | 8% | 1% | 5% | 67% |
Figure 24: numbers and proportions of requested reviews by ethnic group by year
Download the data for figure 24 (ODS, 4KB)
| Financial year | Asian (excluding Chinese) | Black | Chinese | Mixed | Not disclosed | Other | Unknown | White |
|---|---|---|---|---|---|---|---|---|
| 2014-15 | 5% | 0% | 7% | 1% | 8% | 0% | 1% | 79% |
| 2015-16 | 4% | 1% | 6% | 2% | 9% | 0% | 0% | 78% |
| 2016-17 | 5% | 1% | 8% | 1% | 7% | 0% | 0% | 77% |
| 2017-18 | 6% | 0% | 7% | 1% | 7% | 0% | 0% | 77% |
| 2018-19 | 7% | 1% | 9% | 2% | 7% | 1% | 0% | 74% |
| 2019-20 | 7% | 1% | 9% | 2% | 8% | 1% | 0% | 72% |
| 2020-21 | 8% | 1% | 10% | 2% | 8% | 1% | 0% | 70% |
| 2021-22 | 8% | 1% | 10% | 2% | 8% | 1% | 0% | 70% |
| 2022-23 | 8% | 1% | 10% | 2% | 8% | 1% | 0% | 70% |
| 2023-24 | 9% | 1% | 11% | 3% | 8% | 1% | 0% | 67% |
Figure 25: numbers and proportions of usable reviews by ethnic group by year
Download the data for figure 25 (ODS, 4KB)
We observe an increase in the proportion of reviewer requests from Asian and Chinese researchers.
Chinese and ‘Asian excluding Chinese’ reviewers are well represented in providing usable reviews.
In comparison to other minority ethnic groups, Mixed and Black reviewers are comparatively underrepresented in the pool of review requests. The proportion of Mixed reviewers is consistent with their HESA EPS academic population, whereas Black reviewers are proportionately lower.
EPSRC panel members and panel chairs
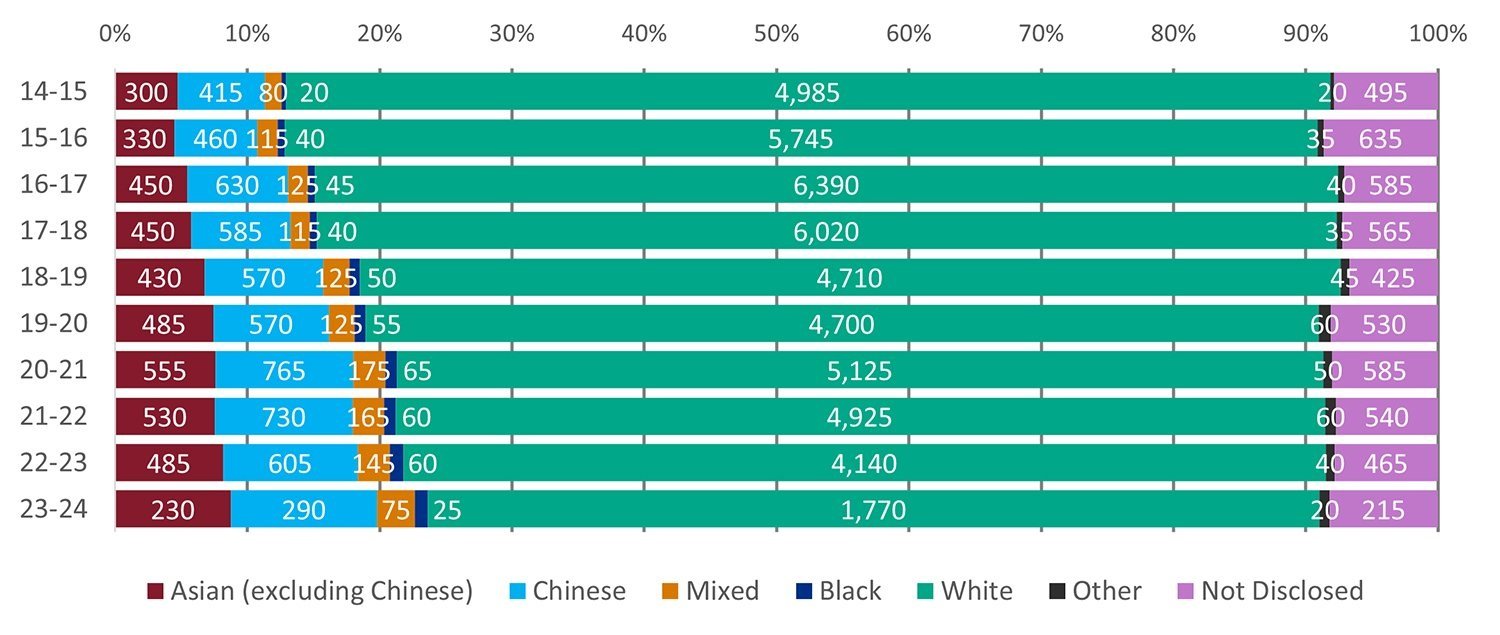
A steady increase has been observed in the proportion of minority ethnic panel members.
Figure 26: panel membership by minority ethnic group in 2022-23 compared to HESA EPS academic population
Download the data for figure 26 (ODS, 3KB)
Since 2014 to 2015 the number of minority ethnic on panels has increased from 7.1% to 13.4%.
The ethnic diversity of Panel Chairs is around 80% White. The proportion of minority ethnic people in the role of Chair is under-represented. However, due to the high ‘not disclosed’ and ‘unknown’ panel member data, this is difficult to establish with certainty. There is a slight growth over the last four reporting years of minority ethnic panel chairs.
| Financial year | Asian (excluding Chinese) | Black | Chinese | Mixed | Not disclosed | Other | Unknown | White |
|---|---|---|---|---|---|---|---|---|
| 2014-15 | 2% | [c] | 3% | 2% | 8% | [c] | 8% | 77% |
| 2015-16 | 5% | [c] | 3% | 2% | 9% | [c] | 7% | 74% |
| 2016-17 | 4% | [c] | 3% | 1% | 10% | 1% | 9% | 73% |
| 2017-18 | 5% | 1% | 4% | 1% | 9% | [c] | 9% | 73% |
| 2018-19 | 4% | 1% | 3% | 1% | 9% | 1% | 7% | 76% |
| 2019-20 | 6% | 2% | 3% | 2% | 8% | [c] | 9% | 71% |
| 2020-21 | 4% | 1% | 3% | 1% | 6% | 1% | 6% | 78% |
| 2021-22 | 4% | [c] | 4% | 2% | 6% | 1% | 5% | 78% |
| 2022-23 | 6% | 1% | 6% | 1% | 5% | [c] | 5% | 75% |
| 2023-24 | 7% | [c] | 5% | 1% | 7% | 1% | 5% | 74% |
Figure 27: numbers and proportions of panel members by ethnicity by year
Download the data for figure 27 (ODS, 4KB)
| Financial year | Asian (excluding Chinese) | Black | Chinese | Mixed | Not disclosed | Other | Unknown | White |
|---|---|---|---|---|---|---|---|---|
| 2014-15 | 5% | 0% | 0% | 0% | 6% | 0% | 5% | 84% |
| 2015-16 | 0% | 0% | 0% | 0% | 7% | [c] | 4% | 85% |
| 2016-17 | 0% | 0% | 0% | 0% | [c] | [c] | 6% | 85% |
| 2017-18 | 0% | 0% | 0% | [c] | 9% | 0% | 4% | 81% |
| 2018-19 | 0% | 0% | 0% | 0% | 9% | 0% | 4% | 84% |
| 2019-20 | 7% | [c] | 0% | [c] | 6% | 0% | 6% | 78% |
| 2020-21 | 6% | 0% | 0% | 0% | 6% | [c] | [c] | 83% |
| 2021-22 | 0% | 0% | 0% | [c] | 5% | 0% | [c] | 87% |
| 2022-23 | 0% | 0% | 0% | 0% | [c] | 0% | [c] | 89% |
| 2023-24 | 8% | 0% | 0% | 0% | [c] | [c] | 6% | 81% |
Figure 28: numbers and proportions of panel chairs by ethnicity by year
Download the data for figure 28 (ODS, 4KB)
Conclusions
While underrepresentation is evident for certain minority ethnic researchers within our portfolio, we have observed incremental improvements in representation across various roles and funding streams.
Award rates for principal investigator, co-investigator and Fellowship applicants from White ethnic groups are consistently higher than that of applicants from minority ethnic groups.
Researchers identifying as Chinese and Indian form the largest proportion of applicants and awardees from the Asian ethnic group for principal investigator, co-investigators and fellows. Collectively, the two ethnicities form around 80% of all Asian investigator applicants and awardees. These two ethnicities are well represented as applicants and awardees when compared to their HESA EPS academic population at 49% of the Asian ethnic group.
The proportion of principal investigator awardees who identify themselves as Black, Bangladeshi and Pakistani are underrepresented compared to the HESA EPS academic population.
While there has been an increase in the proportion of minority ethnic researchers participating in peer review, this is still not representative of the HESA EPS academic population.