
Introduction
This document provides an update on the Engineering and Physical Sciences Research Council (EPSRC) gender portfolio data to include the financial years for the period 2019 to 2020, to 2023 to 2024.
See our previous report on gender diversity in our portfolio covering financial year 2007 to 2008 to financial year 2018 to 2019.
Building on the UKRI equal opportunities monitoring data, we analyse the ethnicity, gender, age and disability data we hold on our investigators. This includes looking closely at the applications we receive and award rates for research grants and fellowships, as well as exploring participation in our peer review processes.
Collecting and analysing diversity data supports our understanding of our portfolio and is a key component of our equality, diversity and inclusion action plan. We use diversity data to monitor policy implementation and identify areas of concern or underrepresentation. This contextual information informs us of where problem areas exist and where we can take a strategic lead to focus our interventions to address the challenges.
For other detailed data reports on the EPSRC portfolio see:
- gender diversity in our portfolio: survey findings and community engagement
- ethnicity and race inequity in our portfolio: findings of our community engagement and actions for change
- detailed ethnicity analysis report
- detailed analysis of the diversity of participation in peer review
- EPSRC grant funding: statistical analysis of diversity in the portfolio and peer review
Data sources, context and methodology
Funding data for research grants and fellowships related to applicants, reviewers and panel members for the period financial year 2019 to 2020 to financial year 2023 to 2024 was primarily gathered through returns by individuals to their Joint Electronic Submission (Je-S) account, which the research community used to apply for UKRI funding. This analysis does not include UKRI Funding Service data because Je-S was the primary funding system used during the period covered by this report. The Je-S account held personal information including gender.
Studentship data over the time period for student starts by year was submitted by research organisations through the Je-S Studentships detail functionality.
Higher Education Statistics Agency (HESA) data is used to understand the diversity profile of the academic and postgraduate student community. This enables us to compare the diversity data for funding recipients with the diversity profile of the postgraduate research population in the UK, and that of the academic population who are likely to apply for funding.
The UKRI Je-S portal collected gender data across three options: ‘Male’, ‘Female’ and ‘Not disclosed’. ‘Not disclosed’ refers to individuals who have consciously chosen not to disclose their information and have purposely selected the ‘Not disclosed’ category. There is also an ‘Unknown’ category in our dataset, and this refers to instances where individuals have not provided their details.
Although the Funding Service has been used for some EPSRC activities, including prioritisation panels and submission of applications, this data has not been included in the report as it was not captured at the time of this analysis. As a result, the most recent data, particularly for 2023 to 2024, may not fully reflect the complete position of applications and awards.
Summary of findings
Applications and awards
We present applications and awards-related results by gender for the three application roles principal investigator, co-investigator, fellowship and doctoral studentships.
Applicants and awardees
While a gradual increase in female principal investigator applicants and awardees is observed over time, their proportion remains underrepresented compared to the HESA engineering and physical sciences (EPS) academic population share. For example, in 2022 to 2023, the share of female principal investigator applicants (17%) and awardees (16%) fell below their HESA EPS academic proportion (20%).
While the proportion of female fellowship applicants generally mirrors the HESA EPS academic proportion, the proportion of female awardees exhibits significant fluctuations over time, generally exceeding the HESA EPS academic proportion. This volatility in female fellowship awardees, in contrast to the more stable trends observed for principal investigator and co-investigator awardees, may be partly attributed to the smaller number of fellowship awardees overall, which can amplify the appearance of fluctuations.
Award rates
The female principal investigator award rates for research grants fluctuates, but generally remains within a few percentage points of the male award rate.
Fellowship award rates display the most dramatic swings in gender representation, with female rates averaging approximately 30% and male rates averaging 20%. Female award rates have exceeded male award rates since 2015 to 2016, although the numbers of applications received and awards made to females are much lower compared to males.
Doctoral studentships
The proportion of female PGR students within our portfolio, though consistently a little below the corresponding HESA EPS postgraduate research female student proportion, has mirrored the HESA EPS postgraduate research female student trend over time. On average, female PGR proportion is approximately 30% compared to 31% of HESA PGR share.
Similarly, our male PGR student proportion reflects the significant male majority seen in the HESA EPS postgraduate research share, with an average representation of about 70% compared to 69% for HESA PGR male student proportion. Since the year 2020 to 2021 we have observed a modest increase in female student representation.
While the proportional representation indicates a trend towards increased female PGR students, the absolute numbers of both male and female PGR students fluctuate annually. This suggests that the proportional shift may be influenced by variations in total PGR student size and composition, possibly due to a decrease in male awardees rather than an increase in female awardees.
Peer review participation
We present information on the EPSRC Peer Review College, reviewers, panel membership and panel chairs by detailed gender categories.
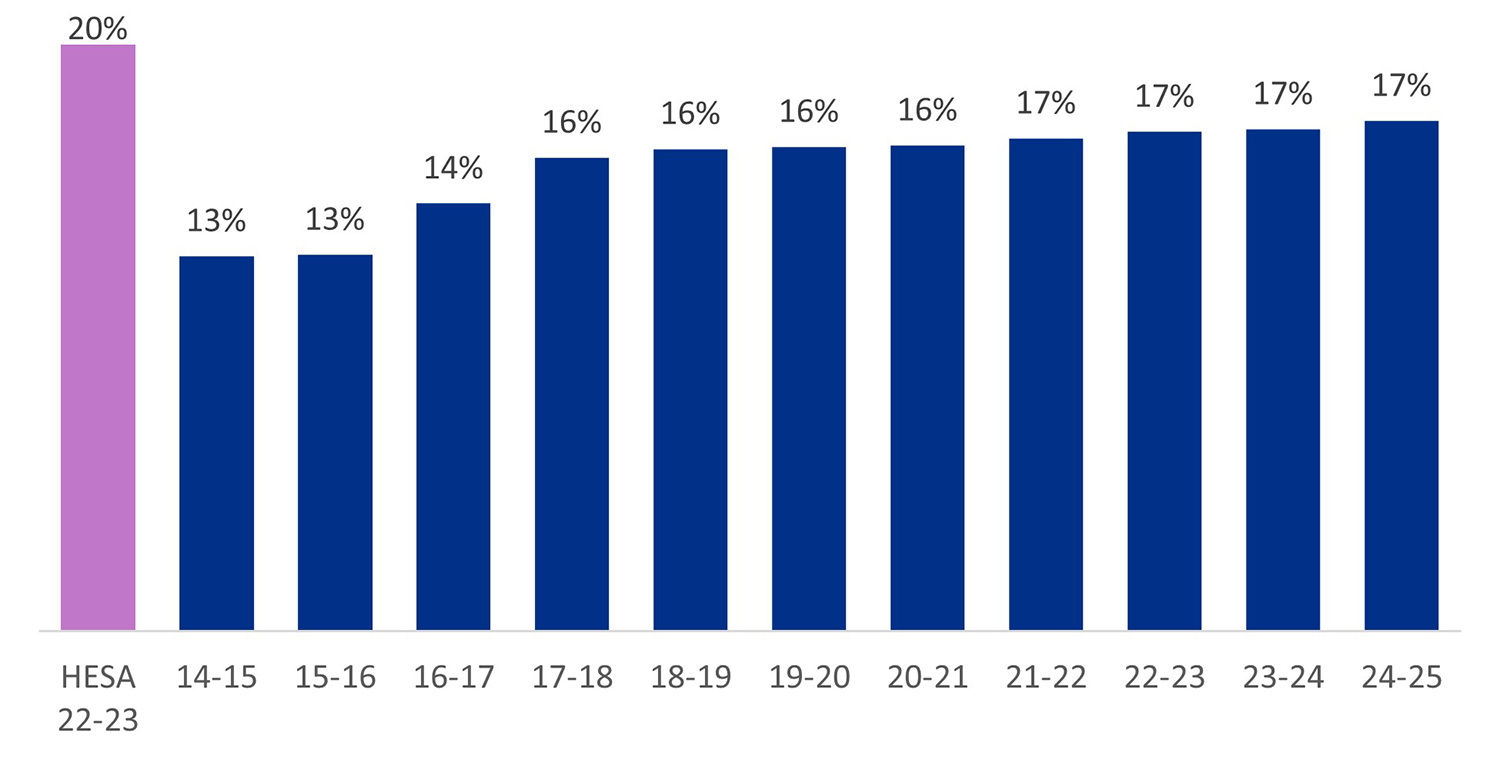
The proportion of female researchers within our Peer Review College has demonstrated steady, albeit slow, incremental increase from 13% in 2014 to 2015, gradually increasing to 17% by 2021 to 2022, and remaining stable through 2024 to 2025. However, this remains below the HESA EPS academic proportion of 20%.
From year 2021 to 2022 to year 2024 to 2025, the female and male representations in the Peer Review College remain constant at 17% and 81% for the four recent years. The data shows a very steady trend, with very little change year on year, apart from the small increase in the female proportion. This stability at 17% might suggest that while the college has grown, the rate of increase in female members has matched the overall growth, preventing further proportional shifts.
Compared to ‘requested reviews’, ‘usable reviews’ exhibited a similar pattern of a majority male representation due to the population size and limited increase in female participation. However, the absolute numbers of usable reviews were consistently lower than those of requested reviews. Notably, usable return rates for both genders were lower in 2023 to 2024 (32% for females and 36% for males) compared to 2022 to 2023 (36% for females and 41% for males).
This decline is partly attributed to the lack of capture and inclusion of diversity data from the Funding Service. Furthermore, the 2023 to 2024 return rates are notably lower than the average usable return rates observed from year 2019 to 2020 to year 2021 to 2022 (females: 39%, males: 43%), indicating a more recent drop.
A clear and consistent increase in the proportion of female panel members is evident over the decade (year 2014 to 2015 to year 2023 to 2024), with an average representation of 34%. Female representation in panel chairs also shows an overall increase, though with substantial year-to-year fluctuations, averaging 35% over the period.
The female proportions in both panel membership and chairs are significantly higher than the HESA EPS female proportion. This higher female proportion can be attributed to the EPSRC’s mixed-gender panel policy, which requires a 30% target representation for the underrepresented gender on panels.
Note: we acknowledge that 30% is higher than the HESA EPS academic population for women. However, EPSRC’s remit is broad, we invest in research areas and critical technologies which have wide research remits, with researchers from disciplines contributing to these research challenges from outside the core EPS subjects. These include research areas that traditionally have a higher proportion of females, such as the social sciences and clinical settings.
Guidance and technical notes
In this report, the proportion of applicants and awardees by gender are presented as stacked bar graphs. Each stacked bar graph displays the percentage of the whole of each group. It shows the relative percentage of each gender.
Groups with counts between one and four are suppressed and not shown in the graphs, therefore the added bars may not present to a 100% proportion. Counts of zero are also not shown.
The numbers in the graph refer to the counts for the group. All counts of five or more are rounded to the closest multiple of five.
‘Not disclosed’ refers to when respondents have consciously chosen to not disclose their personal information and selected the ‘not disclosed’ option. ‘Unknown’ refers to when individuals have not provided their details and therefore the funding service has no usable information.
HESA staff data is not available for the ‘not disclosed’ category. HESA student population estimates for 2021 to 2022 was used for the comparison, as the latest years data is not available at the time of this analysis.
The HESA EPS gender population proportions have been created using the HESA 2022 to 2023 staff return:
- staff full-person equivalent
- staff (excluding atypical)
- academic employment function
- teaching and research
HESA cost centres are departments originating from the HESA finance records and have been used for a number of years as a way of coding higher education. For EPSRC, individuals are from the following cost centres (2012 to 2013 onwards):
- general engineering, chemical engineering
- mineral, metallurgy and materials engineering
- civil engineering
- electrical, electronic and computer engineering
- mechanical, aero and production engineering
- information technology, systems sciences and computer software engineering
- mathematics
- chemistry
- physics
Comparisons of EPSRC applicants and awardees by gender with HESA EPS academic population
The EPS staff share for 2022 to 2023, as reported by HESA, demonstrates a significant gender imbalance, with 80% male representation and 20% female representation. This disparity provides a crucial context for understanding both EPSRC applicant and awardee data.
Figure 1: share of applicants by gender for all roles, 2022 to 2023
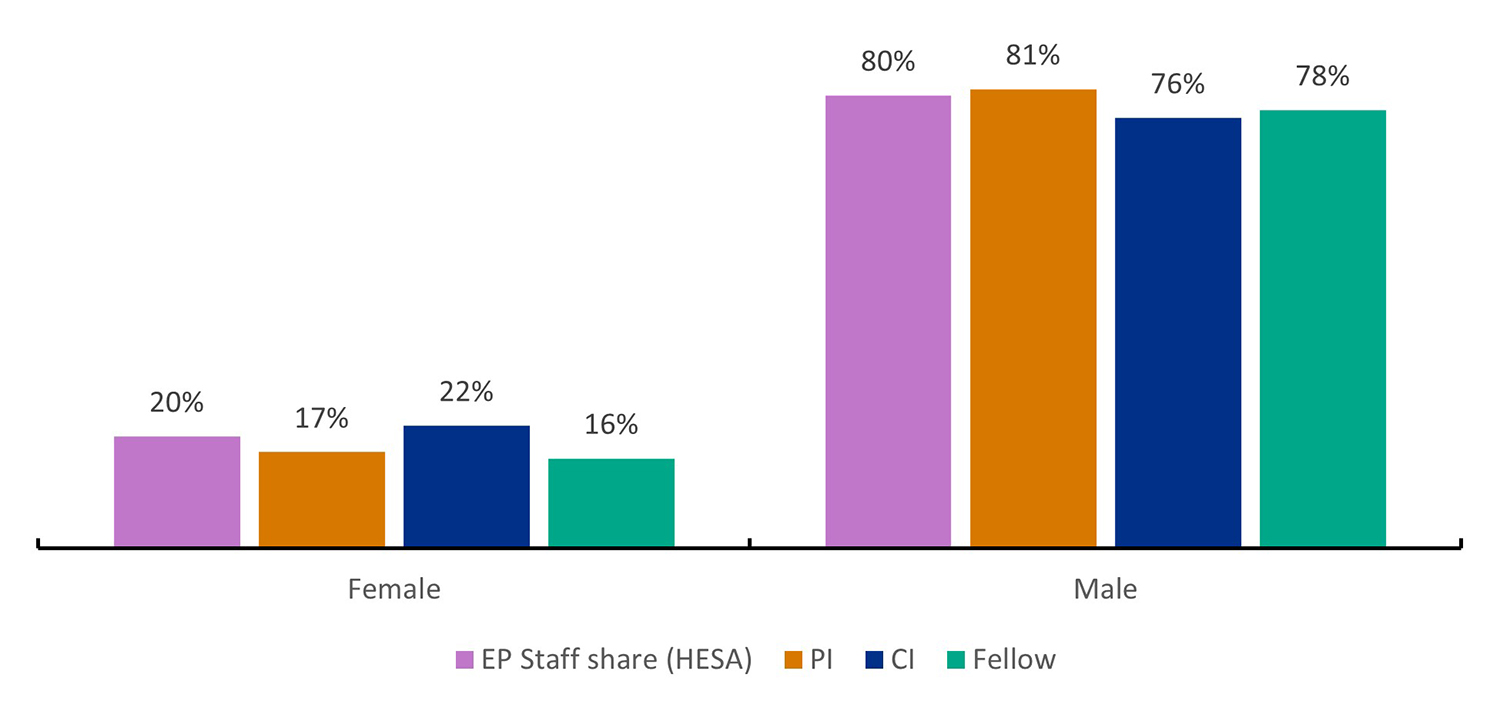
Figure note: share for the ‘unknown’ group comprising fewer than five individuals and zero are not reported.
Download the data for figure 1 (ODS, 3KB)
Figure 1 compares the share of EPSRC applicants by gender in 2022 to 2023 for principal investigator, co-investigator and Fellows, alongside the HESA EPS academic population, respectively.
Principal investigator applications show a notable underrepresentation of women (17%) compared to the HESA EPS academic population (20%). Male principal investigator applicants are slightly above representation of the HESA population. A small (2%) proportion of principal investigator applicants did not disclose their gender information.
Co-investigator applications exhibit a slightly higher female representation (22%) than the HESA benchmark, with a slightly lower representation (76%) for male applicants.
Fellowship applications demonstrate the lowest female representation (16%) compared to the HESA benchmark, with male applicants being slightly underrepresented in fellowship applications at 78%.
Figure 2: share of awardees by gender for all roles, 2022 to 2023
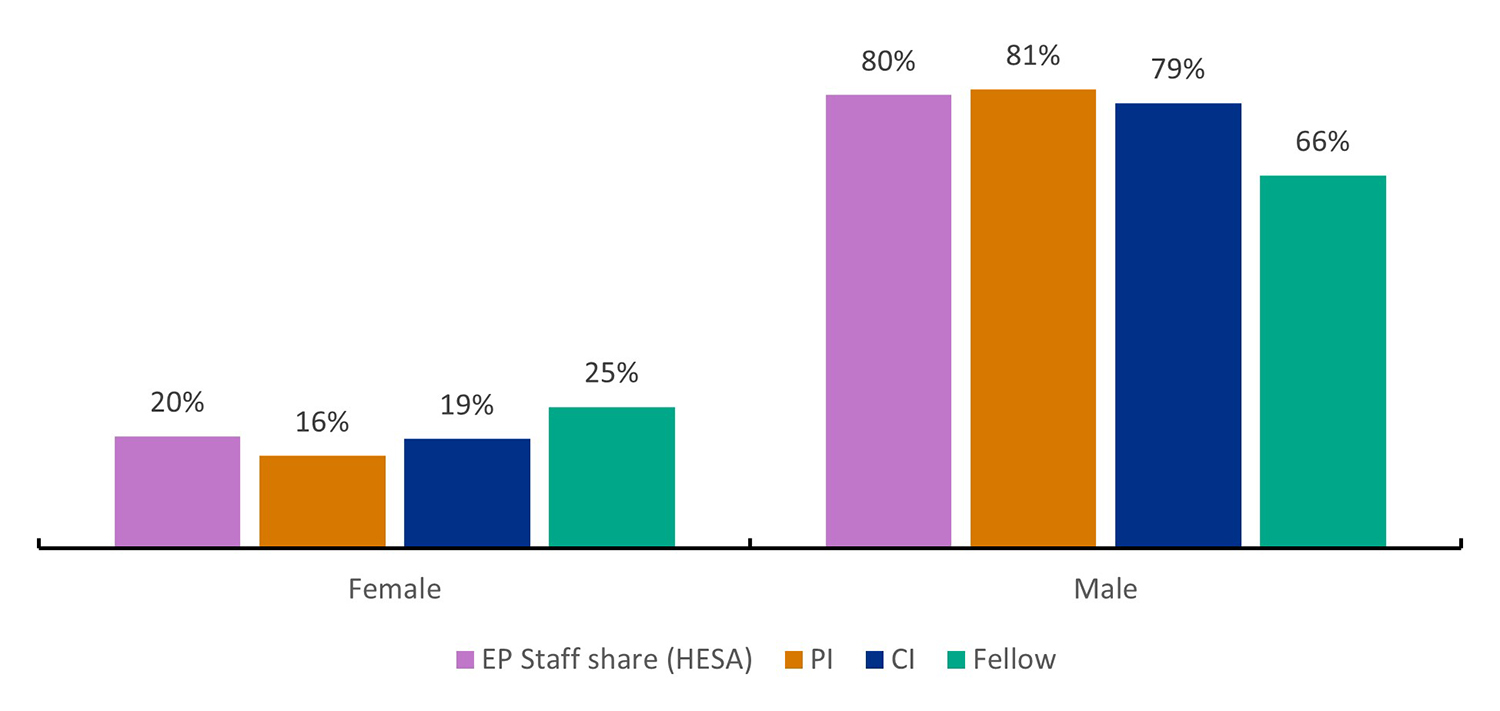
Figure note: share for the ‘unknown’ group comprising fewer than five individuals and zero are not reported.
Download the data for figure 2 (ODS, 3KB)
Figure 2, which compares the share of EPSRC awardees by gender in 2022 to 2023 for principal investigator, co-investigator and Fellows, alongside the HESA EPS academic population, respectively, shows the following trends.
Principal investigator awards continue to show an underrepresentation of women (16%) compared to the HESA benchmark, mirroring the applicant data.
Co-investigator awards show a similar proportion of female awardees (19%) to the HESA benchmark, with a slightly lower representation (79%) for male awardees.
Fellowship awards demonstrate a higher female representation (25%) than the HESA benchmark, with a much lower representation (66%) for male awardees.
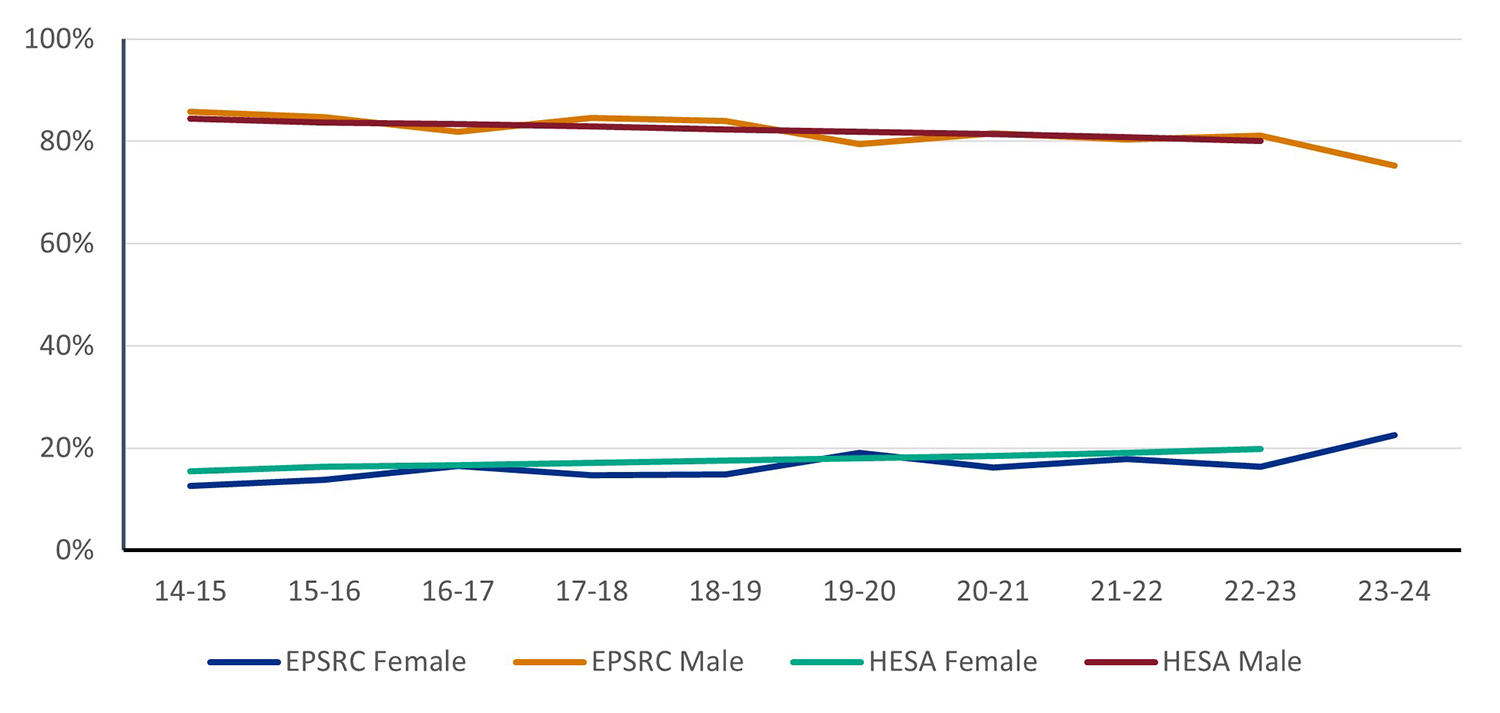
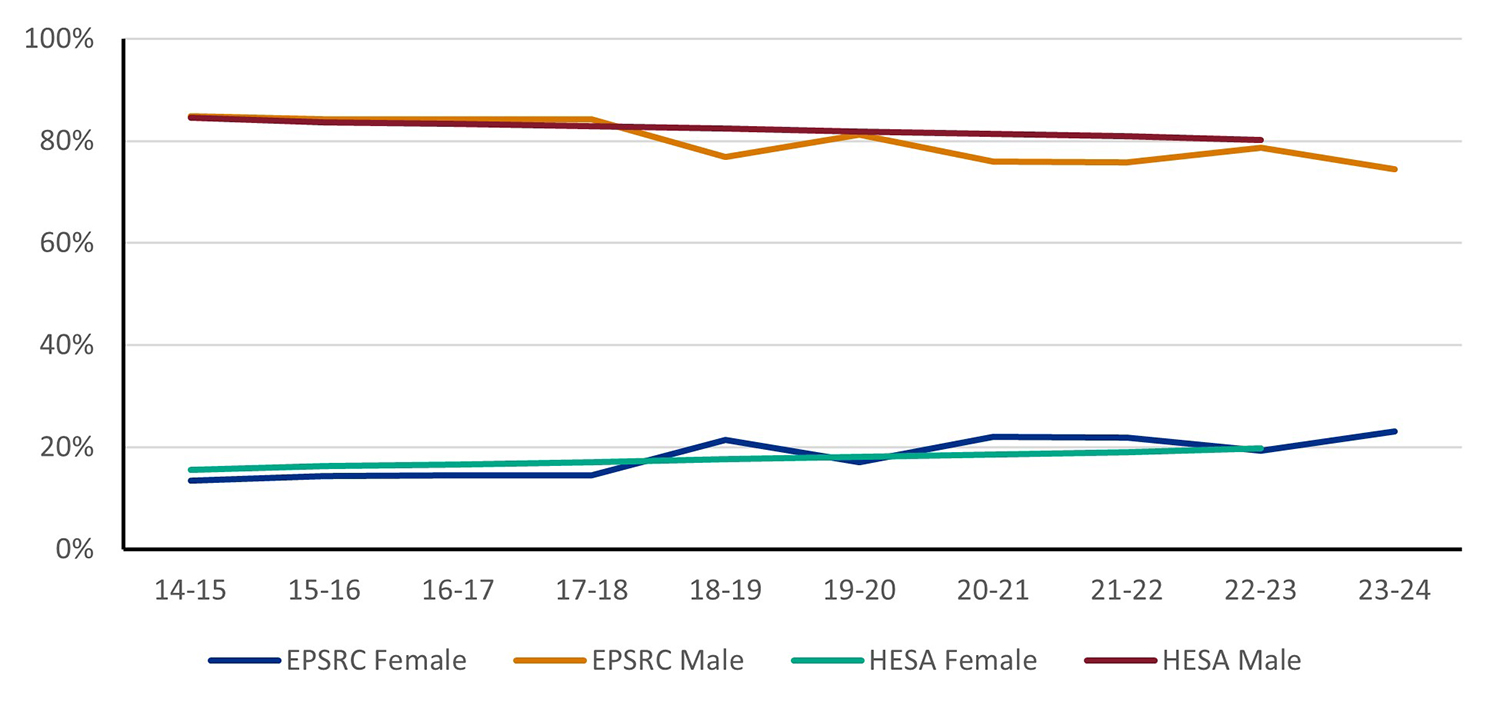
Comparative trend analysis for female and male awardees
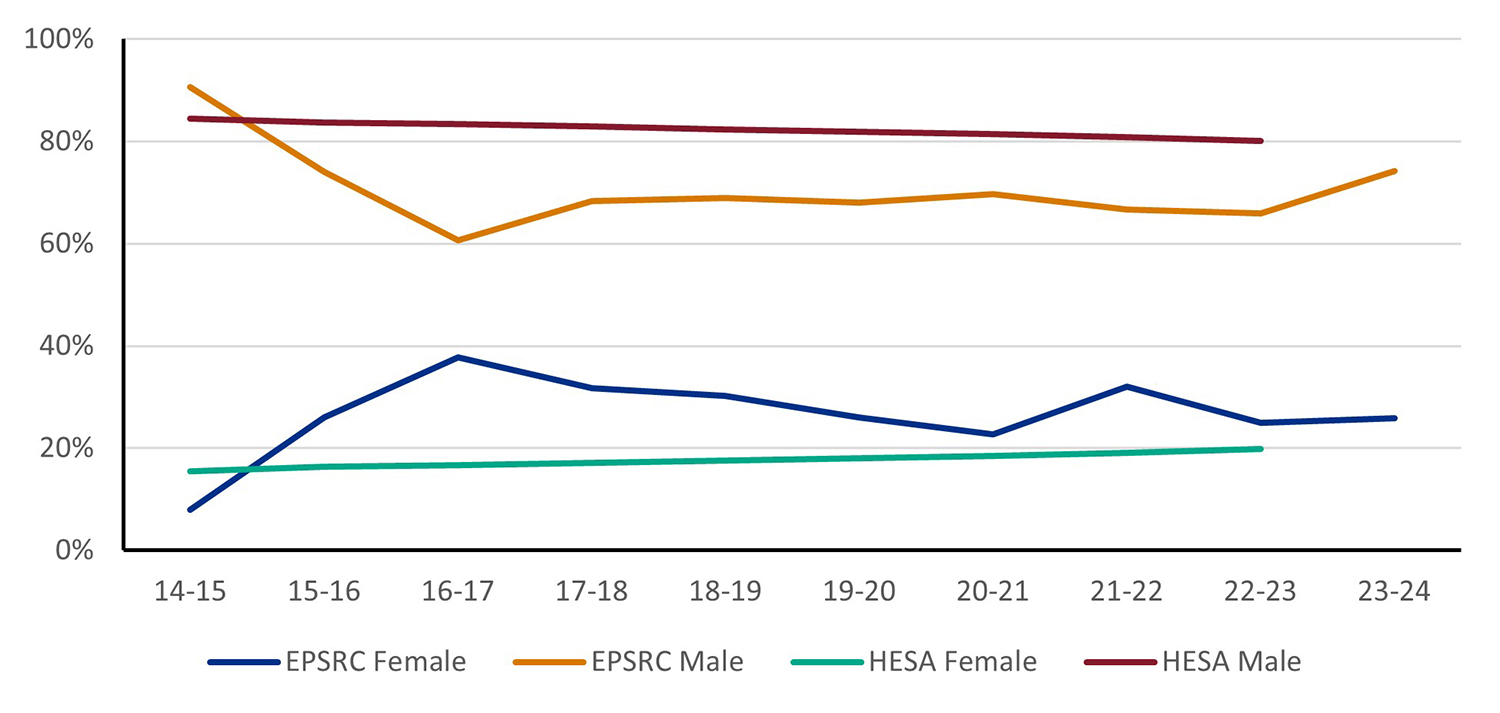
Figures 3, 4 and 5 illustrate the proportion of female and male awardees for the three roles (principal investigator, co-investigator and Fellowship) over time, compared to the HESA EPS academic population.
Across all role categories (principal investigator, co-investigator, Fellows), the proportion of male awardees consistently exceeds the proportion of female awardees, reflecting the established HESA gender population. Despite fluctuations, the overall trend indicates a gradual, albeit slow, increase in female awardees over the years.
The role category ‘principal investigator awardees’ generally shows the lowest female representation, with limited fluctuations and a consistent underrepresentation compared to the HESA EPS academic population.
Co-investigator awardees show more variability in female representation compared to principal investigator awardees. While the portfolio of co-investigators is still predominantly male, there are noticeable small fluctuations year to year.
Fellowship awardees demonstrate the most significant fluctuations in female representation with proportions higher than the HESA EPS population, and a lot of variation year to year.
Figure 3: Proportion of EPSRC female and male principal investigator awardees compared to HESA EPS population
Download the data for figure 3 (ODS, 4KB)
Figure 4: Proportion of EPSRC female and male co-investigator awardees compared to HESA EPS population
Download the data for figure 4 (ODS, 4KB)
Figure 5: Proportion of EPSRC female and male fellowship awardees compared to HESA EPS population
Download the data for figure 5 (ODS, 4KB)
EPSRC applicants and awards data
Gender composition
While the overall trend shows male predominance among EPSRC applicants and awardees, there appears to be a slight, gradual increase in female representation among both applicants and awardees across most categories over the years.
In 2022 to 2023 (figures 6 and 7), male applicants comprised 81% of principal investigators, 76% of co-investigators, and 78% of fellowship applicants. This compared to 17% female principal investigators, 21% female co-investigators, and 16% female fellowship applicants.
Similarly, male awardees accounted for 81% of principal investigators, 79% of co-investigators, and 66% of fellowship awardees. This compared to 16% female principal investigators, 19% female co-investigators, and 25% female fellowship awardees. The proportion of applicants and awardees choosing not to disclose their gender remained low across all roles, ranging from 1 to 7%.
Note: although the Funding Service has been used for some EPSRC activities, including prioritisation panels and submission of applications, this data has not been included in this report as it was not captured at the time of this analysis. As a result, the most recent data, particularly for 2023 to 2024, may not fully reflect the complete position of applications and awards. As such, 2022 to 2023 is mostly used for the comparison with HESA (2022 to 2023) data, except otherwise stated.
In 2022 to 2023, the share of female principal investigator applicants (17%) and awardees (16%) are underrepresented compared to the HESA EPS academic population (20%).
We observe that the share of female co-investigator applicants (22%) slightly exceeds the HESA EPS population (20%), though awardees (19%) are marginally below.
While female fellowship applicants are underrepresented (16%) compared to the HESA EPS academic population (20%), female awardees demonstrate higher representation (25%). Fellowship awardees exhibit the most volatility in female representation, but always at a higher proportion than applicants, consistent with the higher award rate.
Note: for all the bar charts in this report, groups with count between one and four are suppressed and not shown, therefore the added bars may not present to 100% proportions. Counts of zero are also not shown.
Figure 6a: Proportion and number of applicants by gender for principal investigator across the years
Download the data for figure 6a (ODS, 4KB)
Figure 6b: Proportion and number of applicants by gender for co-investigator across the years
Download the data for figure 6b (ODS, 4KB)
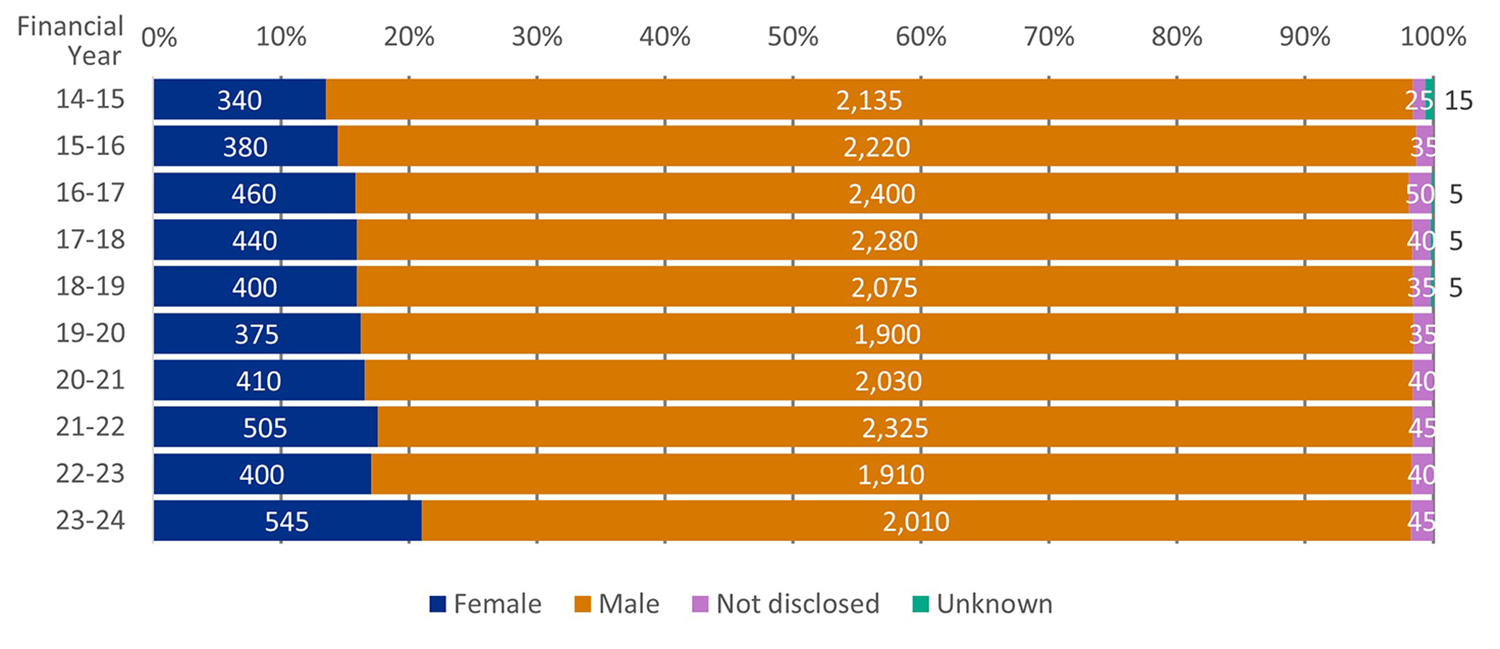
Figure 6c: Proportion and number of applicants by gender for fellowships across the years
Download the data for figure 6c (ODS, 4KB)
Figure 7a: Proportion and number of awardees by gender for principal investigator across the years
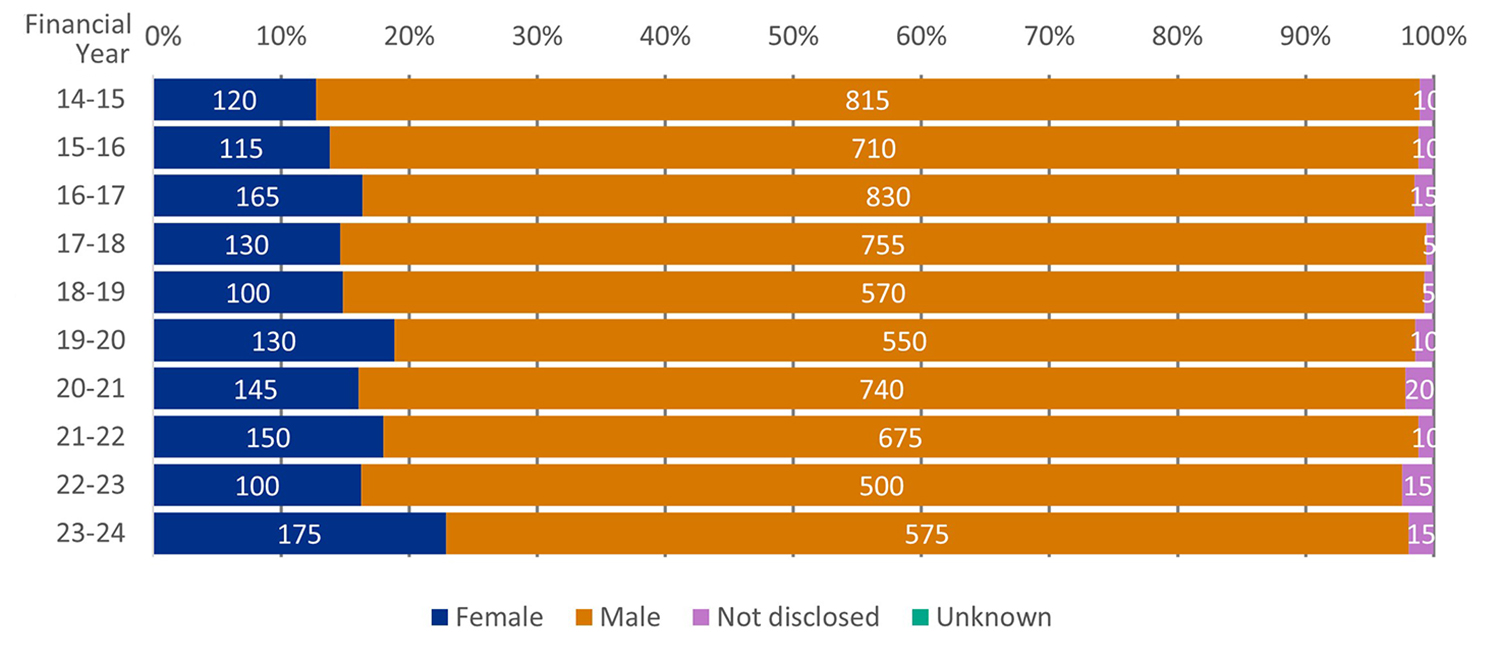
Download the data for figure 7a (ODS, 3KB)
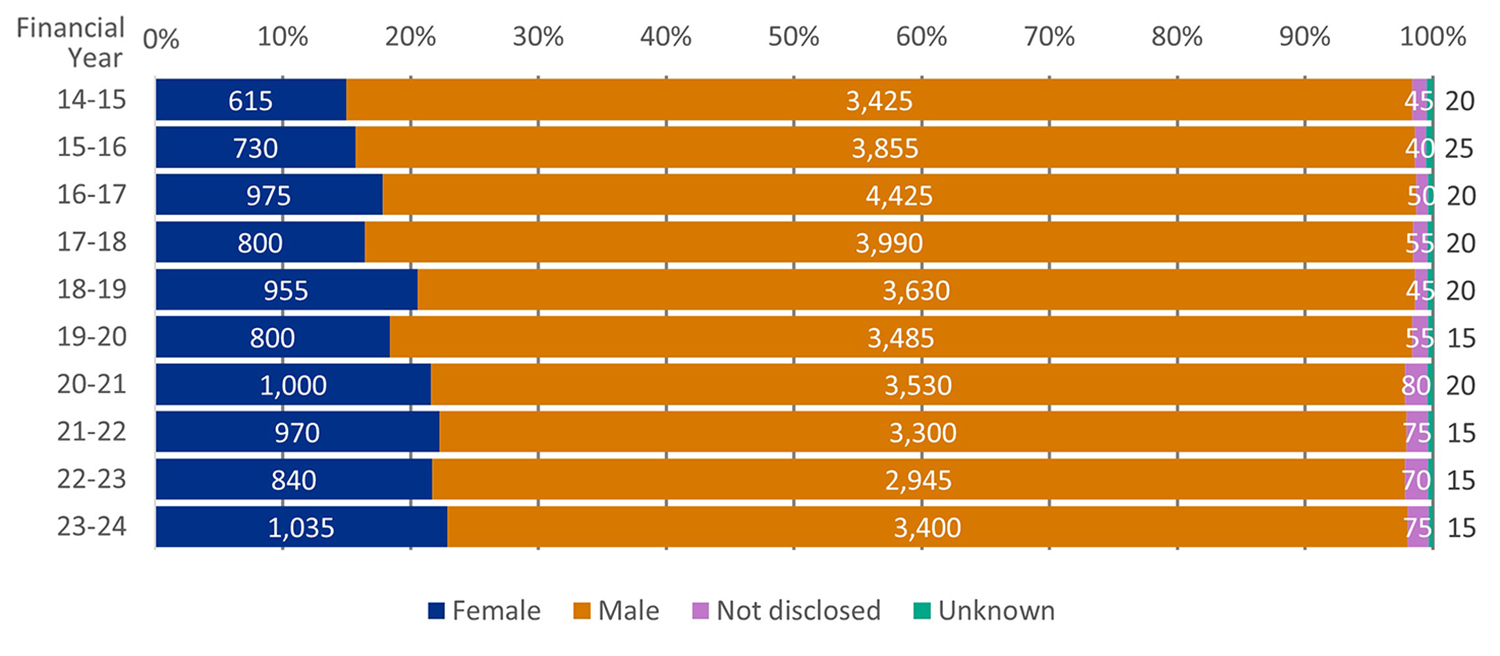
Figure 7b: Proportion and number of awardees by gender for co-investigator across the years
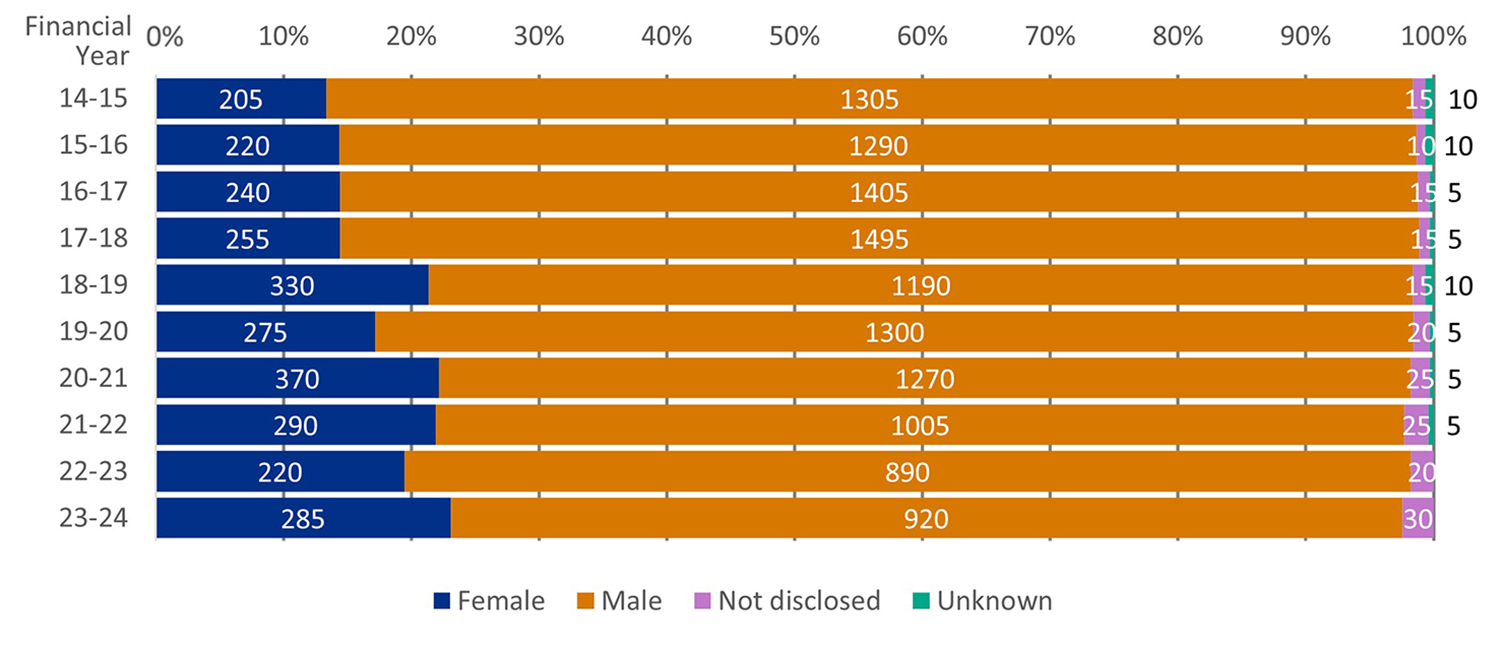
Download the data for figure 7b (ODS, 9KB)
Figure 7c: Proportion and number of awardees by gender for fellowships across the years
Download the data for figure 7c (ODS, 3KB)
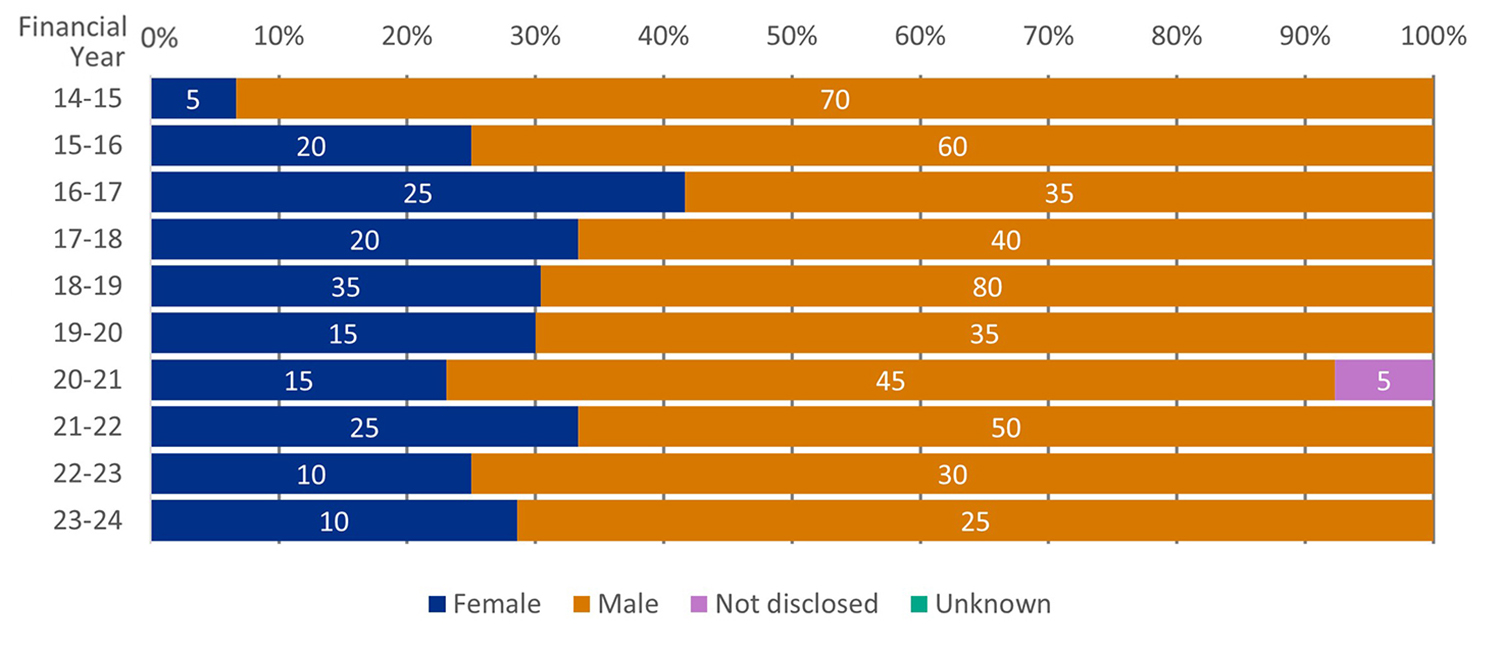
Award rates by gender categories, by role and year
Across all roles (principal investigator, co-investigator, Fellows), award rates by gender exhibit significant variability year-to-year (figures 8 to 10).
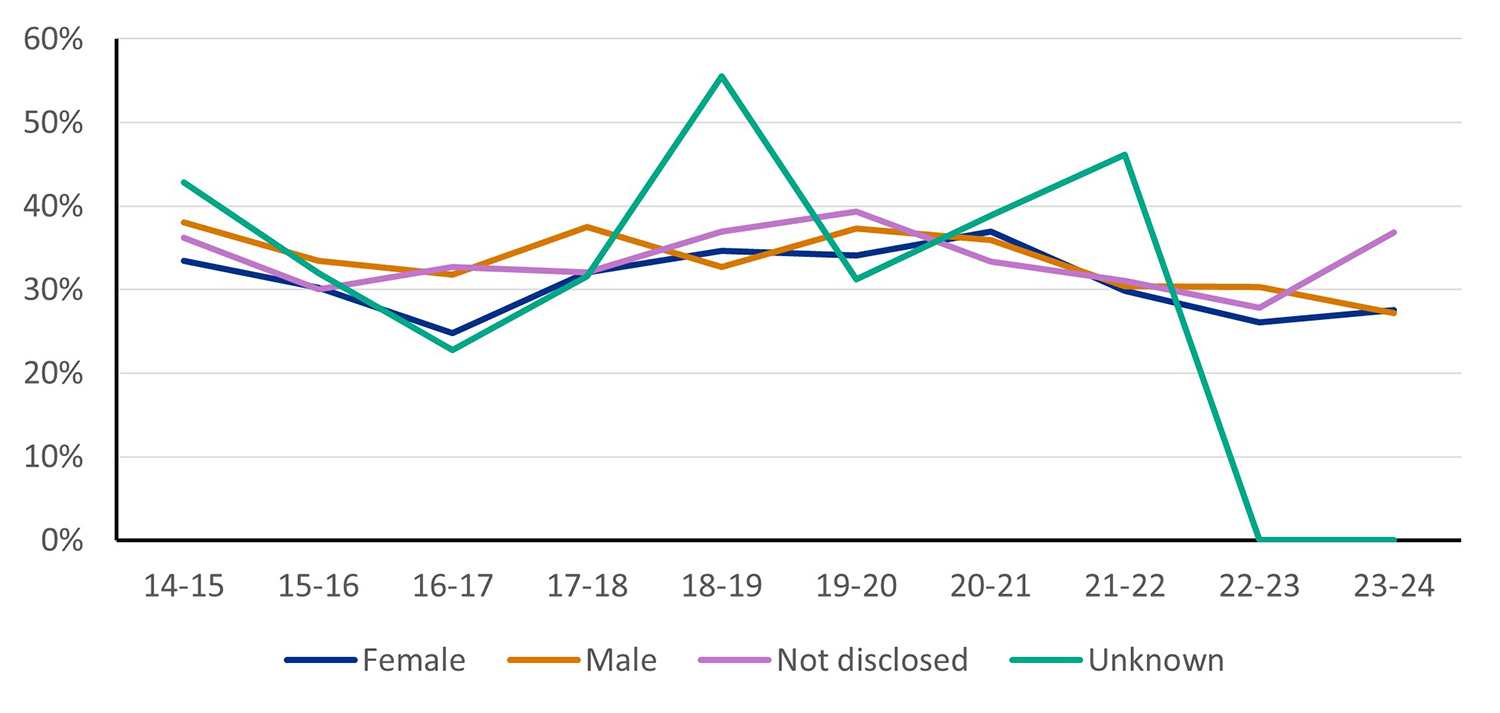
The female principal investigator award rates fluctuate (ranging from 25% to 36%), but generally remain within a few percentage points of the male award rates (ranging from 26% to 38%). There is a significant presence of the ‘not disclosed’ category (ranging from 13% to 50%).
Co-investigator award rates show a more balanced distribution between genders, with fluctuations across years. Female co-investigator award rates average approximately 31%, while male rates average 33%. The ‘not disclosed’ and ‘unknown’ categories are more prevalent in co-investigator awards, averaging around 35% and 38% respectively, due to their significantly lower applicant numbers compared to male and female categories.
Fellowship award rates display the most dramatic swings in gender representation, with female rates averaging approximately 30% and male rates averaging 20%. This swing is likely due to the lower number of fellowship applications received from females compared to males. Over the previous nine years, the female award rate exceeds the male award rate. The ‘not disclosed’ and ‘unknown’ categories are minimal in fellowship award rates.
Figure 8: Award rates for principal investigator by year
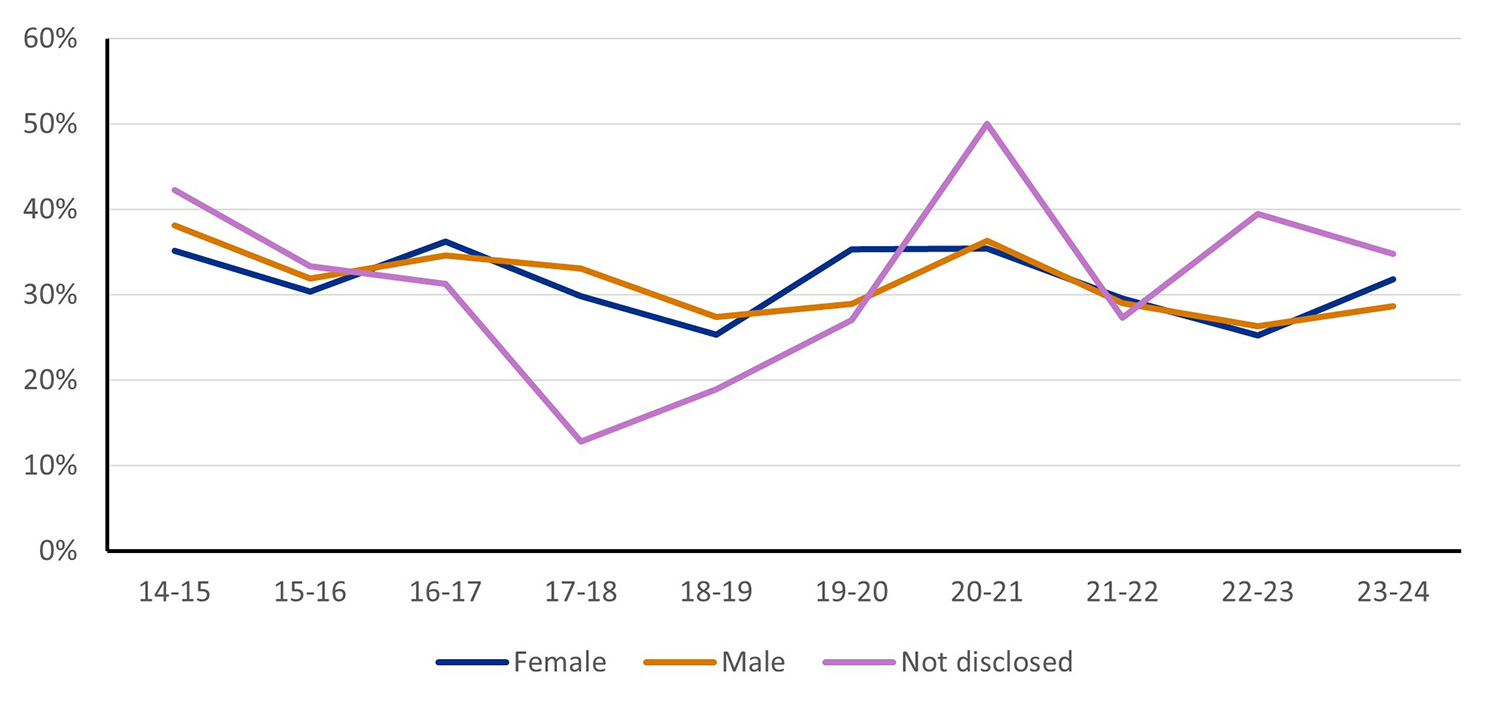
Figure note: award rates for the ‘unknown’ group comprising fewer than five individuals and zero are not reported.
Download the data for figure 8 (ODS, 4KB)
Figure 9: Award rates for co-investigator by year
Download the data for figure 9 (ODS, 4KB)
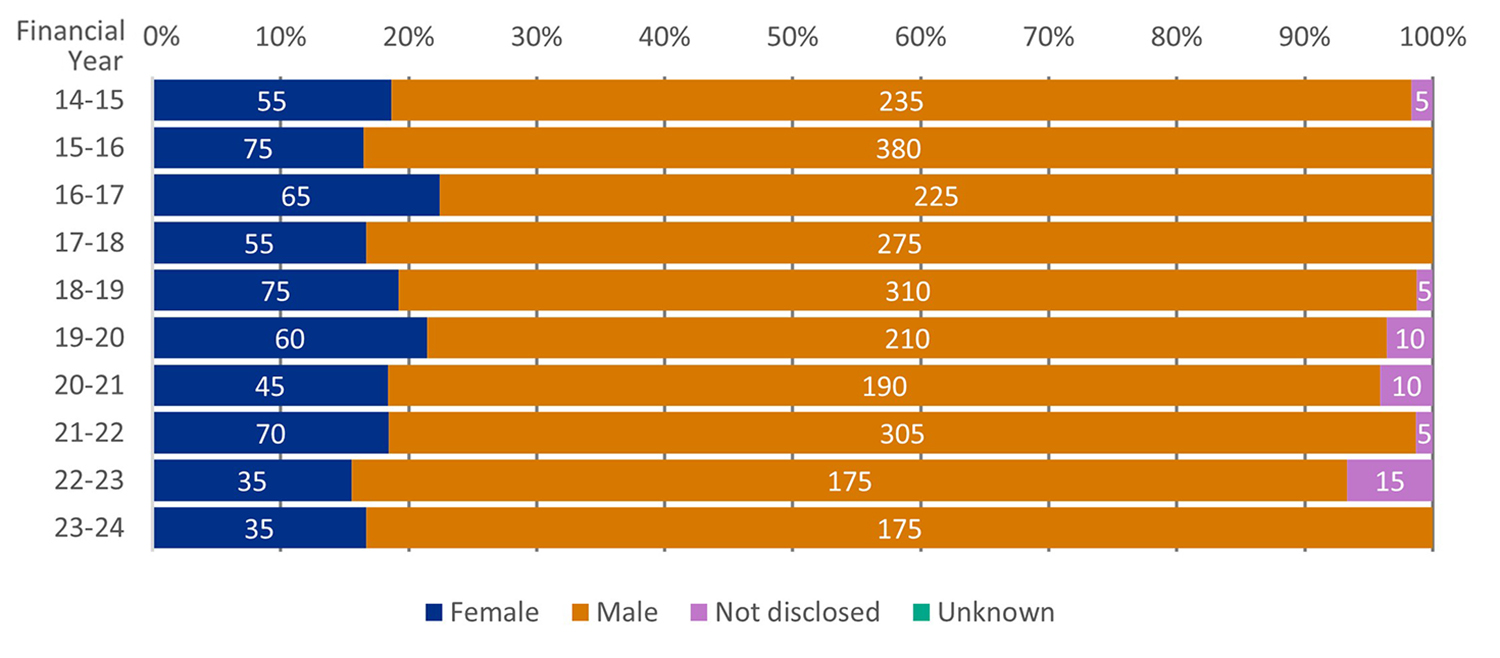
Figure 10: Award rates for fellowship by year
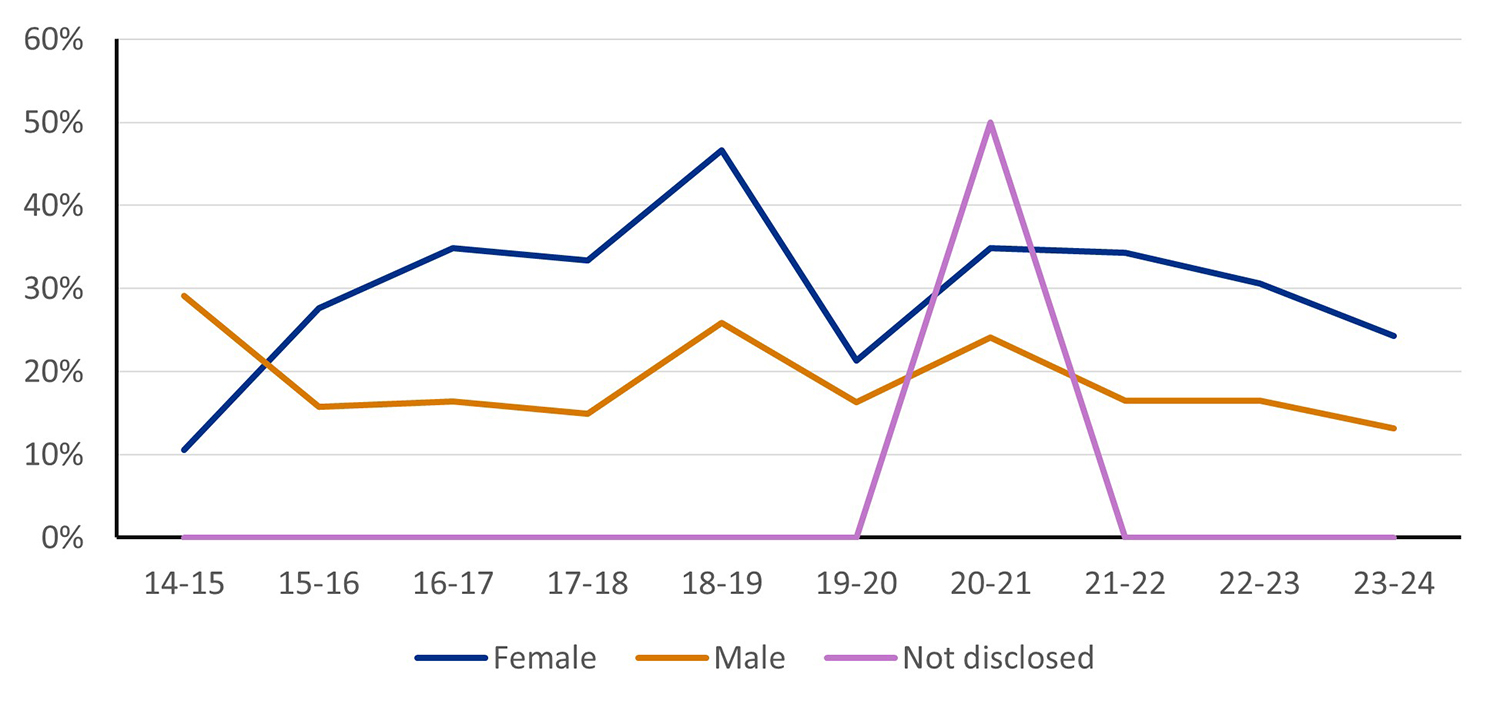
Figure note: award rates for the ‘unknown’ group comprising fewer than five individuals and zero are not reported.
Download the data for figure 10 (ODS, 4KB)
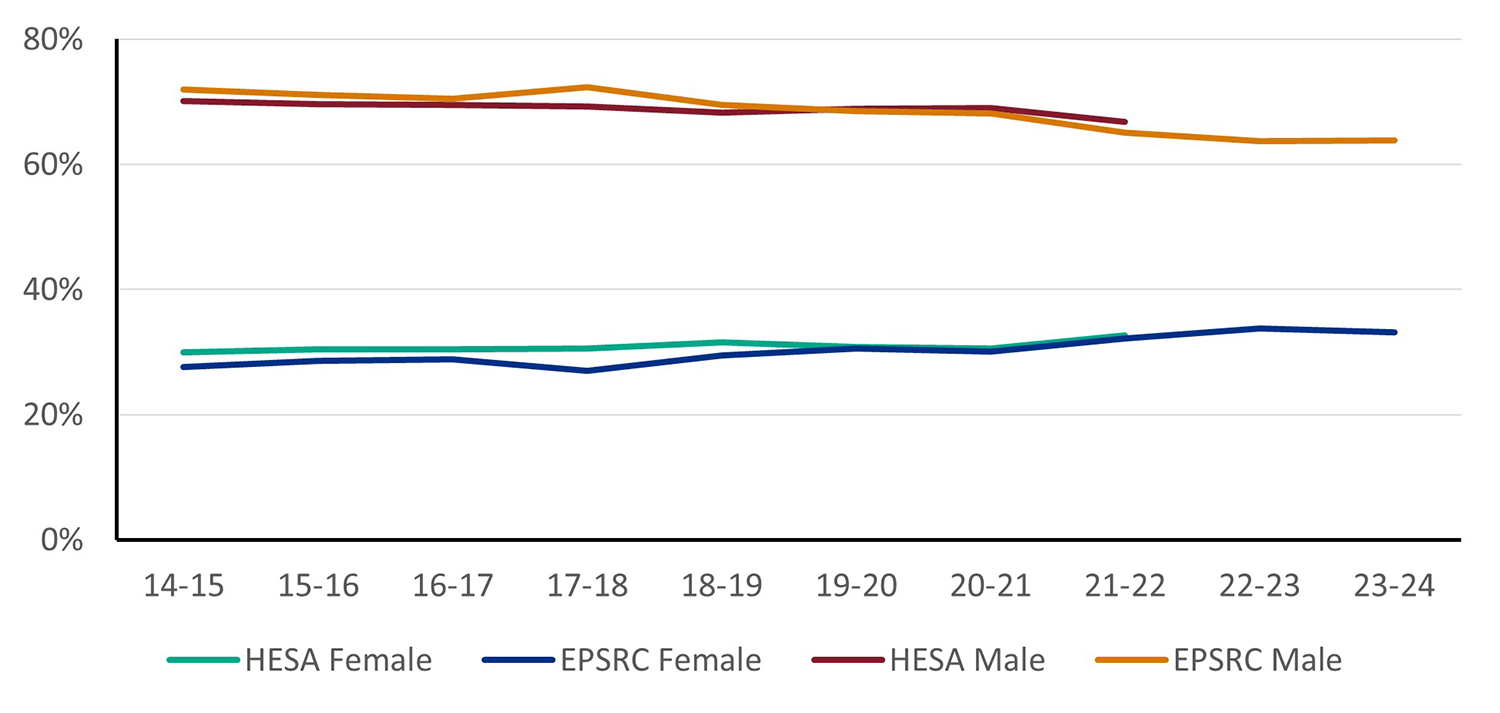
Comparisons of EPSRC doctoral studentship with HESA EPS postgraduate research population
The proportion of female postgraduate research (PGR) students within our portfolio, though consistently a little below the corresponding HESA EPS postgraduate research female student proportion, has mirrored the HESA EPS PGR female student trend over time. On average, female PGR proportion is approximately 30% compared to 31% of HESA PGR share.
Similarly, our male PGR student proportion reflects the significant male majority seen in the HESA EPS postgraduate research share, with an average representation of about 70% compared to 69% for HESA PGR male student proportion. Since 2020 to 2021 we have observed a modest increase in female student representation.
We observed a substantial male majority in both our studentship and HESA EPS postgraduate research share with average representation of approximately 70% in our studentship population compared to 69% of HESA.
While the data shows a gradual increase in female representation over time, this increase is still slightly below the HESA EPS postgraduate research female proportion. Starting at 28% in 2014 to 2015, EPSRC female proportion reaches 32% by 2021 to 2022 compared to HESA, which increases from 30% to 33% over the same period.
Figure 11: EPSRC studentships in comparison with the postgraduate research population, 2021 to 2022
Download the data for figure 11 (ODS, 4KB)
EPSRC studentship data
Postgraduate research students who identify as male consistently represent the largest share of EPSRC postgraduate research student new starts by gender over the reporting period (year 2014 to 2015, to year 2023 to 2024), as evidenced by both the absolute numbers and percentages (figures 12 and 13).
There is a noticeable and gradual increase in the female proportion over the reporting period, rising from 28% in 2014 to 2015, to 33 to 34% in recent years.
While the proportional representation indicates a trend towards increased female postgraduate research students, the absolute numbers of both male and female postgraduate research students fluctuate annually. This suggests that the proportional shift may be influenced by variations in total postgraduate research student population size.
Although the ‘not disclosed’ category shows a slight proportional increase over the years, it remains significantly small (1 to 3%), while the ‘unknown’ category is consistently below five across all reporting periods.
Figure 12: Numbers and proportion of EPSRC studentship new starts by year
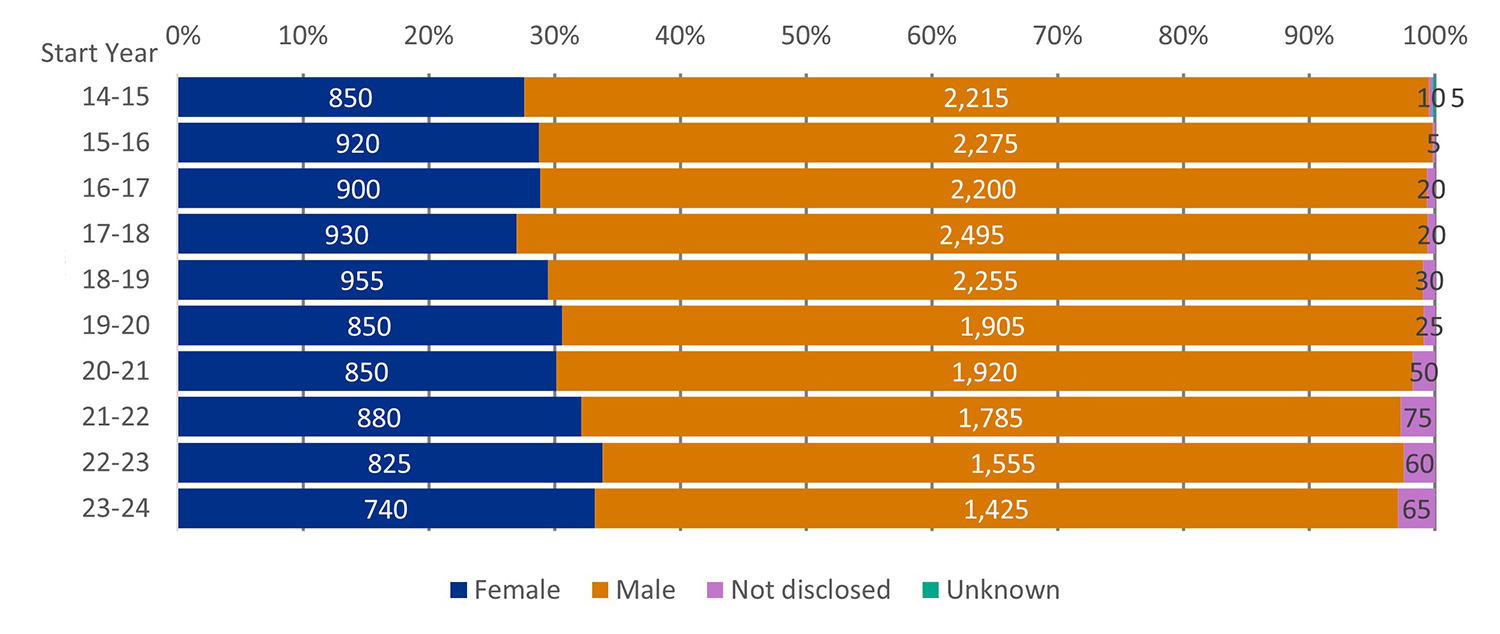
Download the data for figure 12 (ODS, 3KB)
| Start year | Female | Male | Not disclosed | Unknown |
|---|---|---|---|---|
| 2014-15 | 28% | 72% | 0% | [c] |
| 2015-16 | 29% | 71% | 0% | [c] |
| 2016-17 | 29% | 71% | 1% | [c] |
| 2017-18 | 27% | 72% | 1% | 0% |
| 2018-19 | 29% | 70% | 1% | 0% |
| 2019-20 | 31% | 69% | 1% | 0% |
| 2020-21 | 30% | 68% | 2% | 0% |
| 2021-22 | 32% | 65% | 3% | 0% |
| 2022-23 | 34% | 64% | 3% | 0% |
| 2023-24 | 33% | 64% | 3% | 0% |
EPSRC Peer Review College
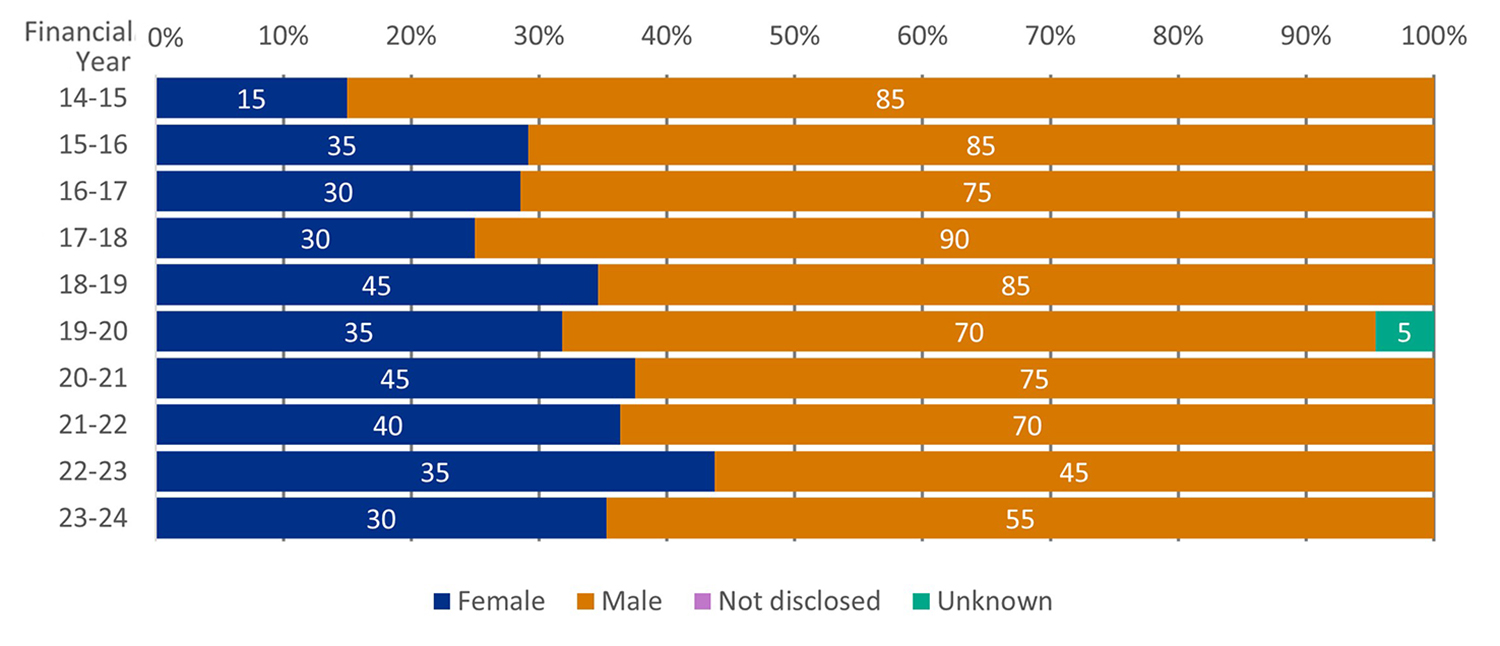
The overall trend demonstrates a steady, albeit slow, incremental increase in female representation within the Peer Review College over the past decade.
The proportion of female share in the Peer Review College began at 13% in 2014 to 2015, gradually increasing to 17% by 2021 to 2022, and remaining stable through 2024 to 2025. However, this remains below the HESA EPS academic proportion of 20% (Figure 14).
Figure 13: Female representation in the Peer Review College by year compared with the HESA EPS female academic proportion
Download the data for figure 13 (ODS, 4KB)
Table 2 and figure 14 show the following trends.
The data consistently demonstrates a significant number and proportion of male representation in our Peer Review College with proportion consistently exceeding 80% over the observed period (year 2014 to 2015 to year 2024 to 2025).
While there is a slight upward trend in female representation, it is incremental and slow. Starting at 13% in 2014 to 2015, it reaches 17% by 2021 to 2022 and remains stable thereafter. Although the percentage increase is modest, the actual number of female members has risen (from 560 to 1,170), indicating growth alongside the overall expansion of the college (from 4,410 to 6,795), which could influence the observed proportional changes.
From year 2021 to 2022 to year 2024 to 2025, the female and male representations remain constant at 17% and 81% for the four recent years. The data shows a very steady trend, with very little change year on year, apart from the small increase in the female percentage
The ‘Not disclosed’ and ‘Unknown’ categories consistently represent a very small number and proportion (1% each) over the reporting period.
| Financial year | Female | Male | Not disclosed | Unknown |
|---|---|---|---|---|
| 2014-15 | 13% | 86% | 1% | 1% |
| 2015-16 | 13% | 86% | 1% | 1% |
| 2016-17 | 14% | 84% | 1% | 1% |
| 2017-18 | 16% | 82% | 1% | 1% |
| 2018-19 | 16% | 82% | 1% | 1% |
| 2019-20 | 16% | 82% | 1% | 1% |
| 2020-21 | 16% | 82% | 1% | 1% |
| 2021-22 | 17% | 81% | 1% | 1% |
| 2022-23 | 17% | 81% | 1% | 1% |
| 2023-24 | 17% | 81% | 1% | 1% |
| 2024-25 | 17% | 81% | 1% | 1% |
Figure 14: Peer Review College numbers and proportions by gender and year
Download the data for figure 14 (ODS, 3KB)
Reviewer population
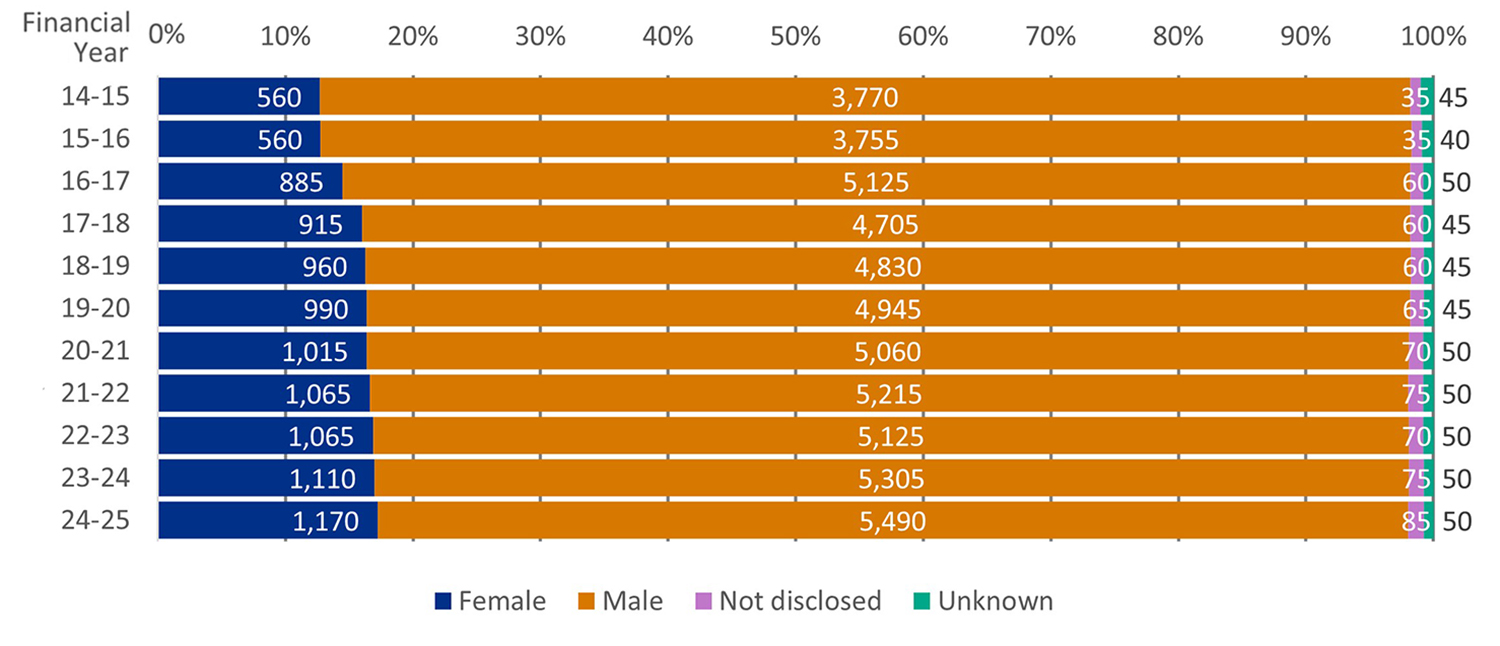
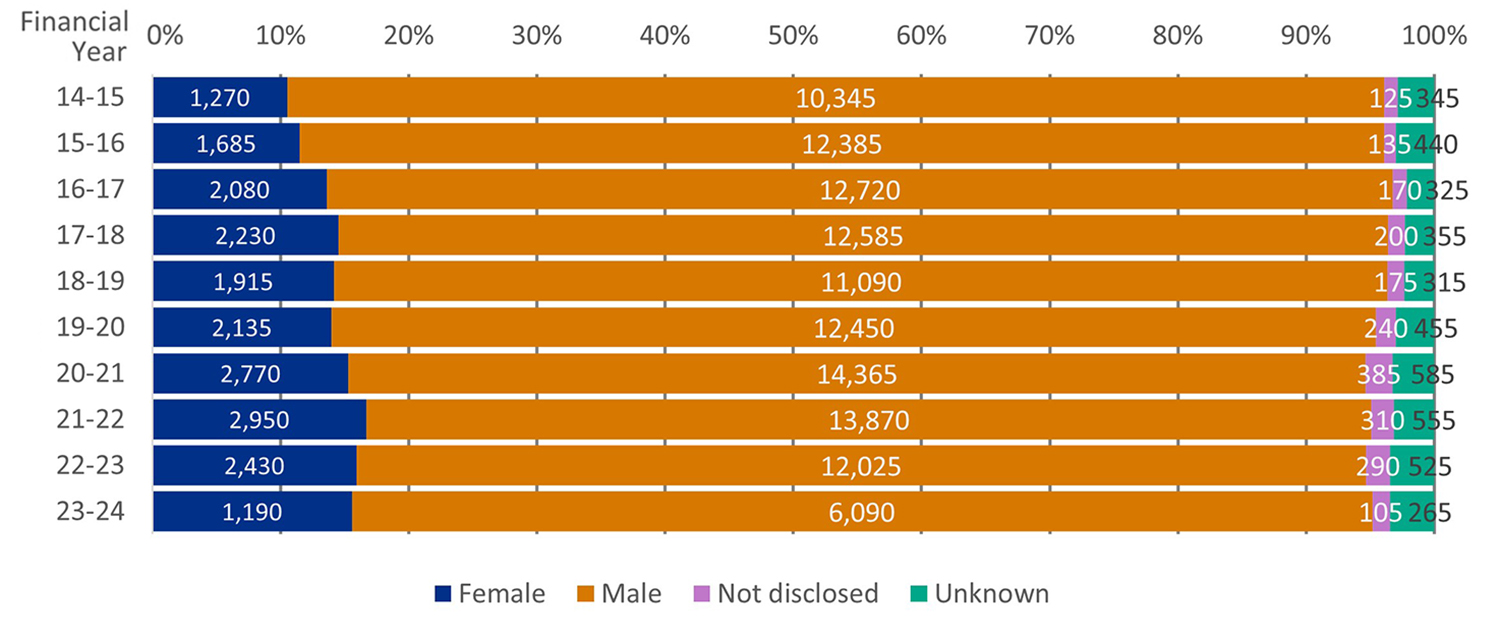
Tables 3 and 4, and figures 15 and 16, which depict the proportions and numbers of requested and usable reviews, highlight the following trends.
Over the period from year 2014 to 2015 to year 2023 to 2024, male review requests consistently represented a substantial majority, exceeding 78% in proportion and averaging approximately 12,000 requests, compared to an average of 2,000 female requests. This closely matches the HESA EPS academic proportions for males and females. A similar trend was observed for usable reviews, with male reviews exceeding 82% (averaging 5,500) and female reviews averaging 900 (14%).
While a slight upward trend in the proportion of female review requests was observed, it was incremental and slow, closely matching the proportion of females within our Peer Review College. Starting at 11% in 2014 to 2015, it peaked at 17% in 2021to 2022, then slightly decreased to 16% in the last two years.
The same pattern was evident for usable reviews, beginning at 10% in 2014 to 2015, peaking at 17% in 2021 to 2022, and then slightly decreasing to 14% in the last two years. This decline in recent years is mostly due to the lack of diversity data captured by the Funding Service, particularly in 2023 to 2024.
The ‘not disclosed’ and ‘unknown’ categories, while consistently representing a small proportion, showed variability in absolute numbers. The ‘unknown’ category consistently averaged higher (approximately 400) than the ‘not disclosed’ category (approximately 200).
Compared to ‘requested reviews’, ‘usable reviews’ exhibited a similar pattern of male substantial representation and limited increase in female participation. However, the absolute numbers of usable reviews were consistently lower than those of requested reviews.
Notably, the usable return rates for both genders in 2023 to 2024 (32% for female and 36% for male) were lower compared to 2022 to 2023 (36% for female and 41% for male). This is partly due to the non-capture and inclusion of diversity data from the funding service.
Furthermore, the 2023 to 2024 return rates are notably lower than the average return rates observed from year 2019 to 2020 to year 2021 to 2022 (females: 39%, males: 43%), indicating a more recent drop.
| Financial year | Female | Male | Not disclosed | Unknown |
|---|---|---|---|---|
| 2014-15 | 11% | 86% | 1% | 3% |
| 2015-16 | 12% | 85% | 1% | 3% |
| 2016-17 | 14% | 83% | 1% | 2% |
| 2017-18 | 15% | 82% | 1% | 2% |
| 2018-19 | 14% | 82% | 1% | 2% |
| 2019-20 | 14% | 81% | 2% | 3% |
| 2020-21 | 15% | 79% | 2% | 3% |
| 2021-22 | 17% | 78% | 2% | 3% |
| 2022-23 | 16% | 79% | 2% | 3% |
| 2023-24 | 16% | 80% | 1% | 3% |
Figure 15: Numbers and proportions of ‘requested reviews’ by gender and year
Download the data for figure 15 (ODS, 4KB)
| Financial year | Female | Male | Not disclosed | Unknown |
|---|---|---|---|---|
| 2014-15 | 10% | 88% | 1% | 0% |
| 2015-16 | 12% | 87% | 1% | 0% |
| 2016-17 | 14% | 85% | 1% | 0% |
| 2017-18 | 14% | 84% | 1% | 0% |
| 2018-19 | 14% | 85% | 1% | 0% |
| 2019-20 | 13% | 85% | 2% | 0% |
| 2020-21 | 14% | 84% | 2% | 0% |
| 2021-22 | 17% | 82% | 2% | 0% |
| 2022-23 | 15% | 84% | 2% | 0% |
| 2023-24 | 14% | 84% | 2% | 0% |
Figure 16: Number and proportions of ‘usable reviews’ by gender and year
Download the data for figure 16 (ODS, 3KB)
EPSRC panel members and panel chairs
The following summary highlights key observations from tables 5 and 6, and figures 17 to 19.
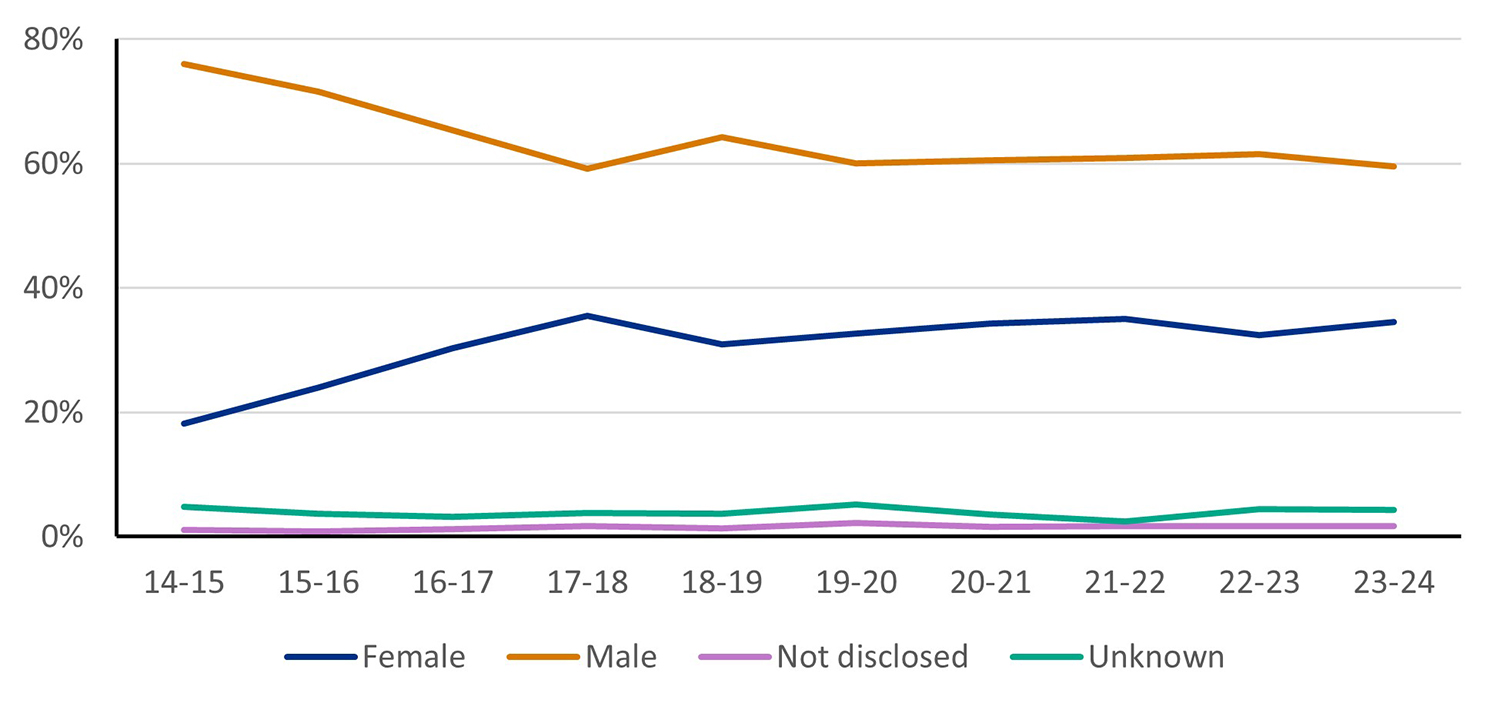
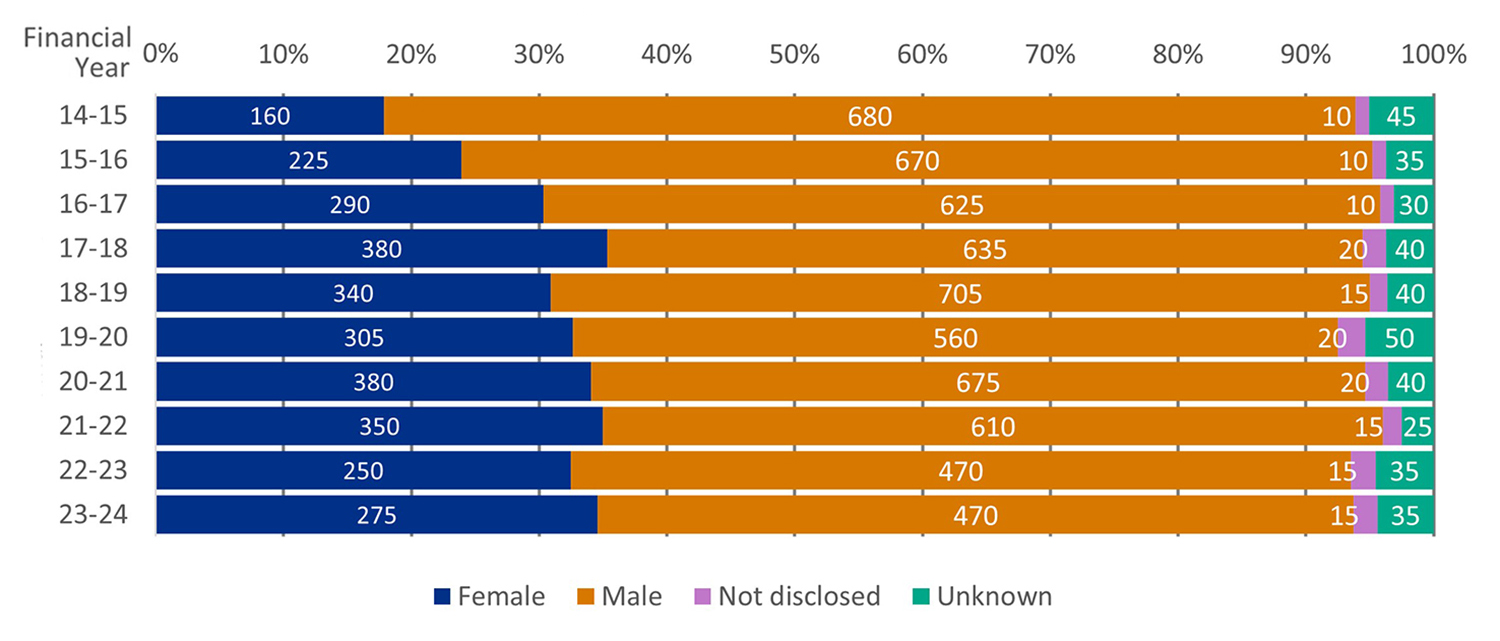
The data shows a clear consistent increase in the proportion of female panel members over the decade (year 2014 to 2015 to year 2023 to 2024), with an average representation of 34%. Starting at 18%, it rises to 35% by 2017 to 2018 and remains stable around that level in subsequent years.
This shows a significantly higher female proportion in panel membership compared to the HESA EPS female proportion of 20% for the year 2022 to 2023. The higher female proportion can be attributed to the EPSRC’s mixed-gender panel policy, which requires a 30% target representation for the underrepresented gender on panels.
Note: we acknowledge that 30% is higher than the HESA EPS academic population for women. However, EPSRC’s remit is broad, we invest in research areas and critical technologies which have wide research remits, with researchers from disciplines contributing to these research challenges from outside the core EPS subjects. These include research areas that traditionally have a higher proportion of females, such as the social sciences and clinical settings.
In contrast to panel members, female representation in panel chairs exhibits substantial year-to-year fluctuations, averaging 35% over the period. While there is an overall increase, with a peak of 41% in 2022 to 2023, the data shows considerable variability due to small numbers.
Despite the increase in female representation, male panel members and chairs consistently represent a majority, averaging 63% and 59%, respectively. This is particularly evident in the absolute numbers, which show a higher number of male participants compared to females.
The ‘Not disclosed’ and ‘Unknown’ categories for panel members, while generally small in proportion, show variability in absolute numbers, with averages of 2% and 3%, respectively. For panel chairs, the ‘Not disclosed’ and ‘Unknown’ categories are consistently less than five.
Figure 17: Proportion of panel membership and chair by gender in 2022 to 2023, compared to HESA EPS academic proportion
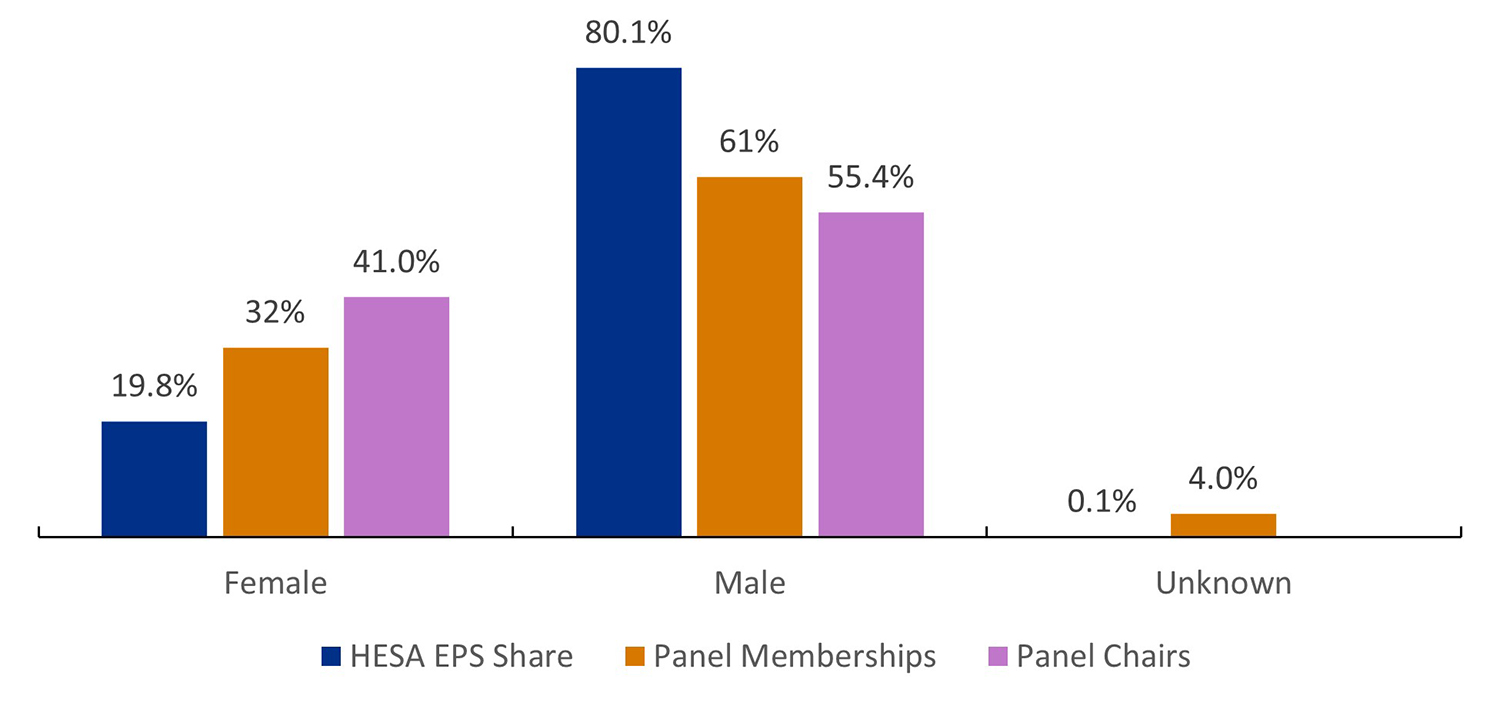
Figure note: Proportion of groups comprising fewer than five individuals are not reported.
Download the data for figure 17 (ODS, 3KB)
Figure 18: Proportions of panel members, by gender and year
Download the data for figure 18 (ODS, 4KB)
Figure 19: Numbers and proportions of panel members, by gender and year
Download the data for figure 18 (ODS, 3KB)
Figure 20: Proportions of panel chairs, by gender and year
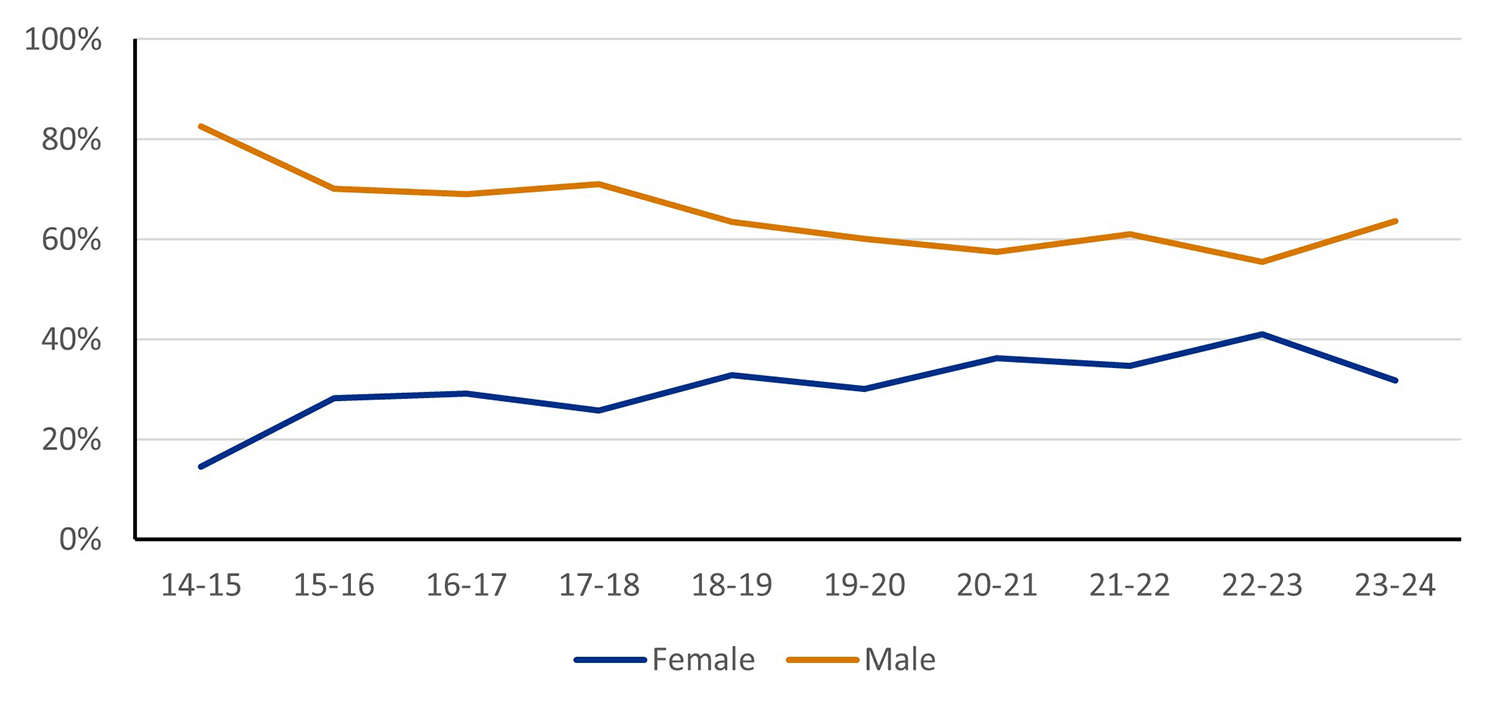
Figure note: Proportion of groups comprising fewer than five individuals are not reported.
Download the data for figure 20 (ODS, 4KB)
Figure 21: Numbers and proportions of panel chairs, by gender and year
Download the data for figure 19 (ODS, 3KB)
Conclusions
Across all roles analysed (principal investigators, co-investigators, Fellows, Studentships, Review College, Requested and Usable Reviews), male representation consistently surpasses the female category. This pattern generally mirrors the gender distribution observed in the HESA EPS academic population and HESA EPS postgraduate research student population, where males are also more prevalent.
Analysed roles include:
- principal investigators
- co-investigators
- fellows
- studentships
- EPSRC Peer Review College
- reviewers
- panel members
- panel chairs
While underrepresentation is evident for female principal investigator applicants and awardees within our portfolio, we have observed incremental improvements in representation across various roles. For example, though the proportion of female fellowship applicants are underrepresented compared to the HESA EPS academic proportion, awardees demonstrate higher proportion in comparison to the HESA EPS academic population.
While there has been a slow, incremental increase in female representation in the Peer Review College, this is still below the HESA EPS female academic proportion.
Compared to ‘Requested Reviews’, ‘Usable Reviews’ exhibited a similar pattern of considerable male representation and limited increase in female participation, with participation similar to the EPS academic population proportions for these two groups.
However, the absolute numbers of usable reviews were consistently lower than those of requested reviews. Notably, usable return rates for both genders were lower in 2023 to 2024 (32% for females and 36% for males), compared to 2022 to 2023 (36% for females and 41% for males).
This decline is partly attributed to the lack of capture and inclusion of diversity data from the Funding Service. Furthermore, the 2023 to 2024 return rates are notably lower than the average usable return rates observed from year 2019 to 2020 to year 2021 to 2022 (females: 39%, males: 43%), indicating a more recent drop.
A clear and consistent increase in the proportion of female panel members is evident over the decade (year 2014 to 2015 to year 2023 to 2024), with an average representation of 34%. Female representation in panel chairs also shows an overall increase, though with substantial year-to-year fluctuations, averaging 35% over the period. The female proportions in both panel membership and chairs are significantly higher than the HESA EPS female proportion.
While the proportion of female postgraduate research students shows an increasingly consistent trend in representation, the absolute numbers of male and female postgraduate research students fluctuate across the years. This suggests that the proportional shift may be attributed to variations in total postgraduate research student population size.