
Summary
UK Research and Innovation (UKRI) publishes annual diversity data on the personal characteristics of its grants applicants and awardees to aid transparency in our funding and enable high-level monitoring of trends.
Sharing our data and insights supports our strategic objective of ‘being a creative, evidence-based and evidence-informed organisation’, as set out in our equality, diversity and inclusion (EDI) strategy, published in March 2023.
This report provides data for the 2023 to 2024 financial year, and adds to our previous diversity data publications. We did not publish a specific report for 2022 to 2023, but we include the data for 2022 to 2023 within the time series analysis and supplementary information.
We have chosen to report on 2023 to 2024 within this publication to align our cycle more closely with other UKRI publications (such as the UKRI Annual Report), improving the timeliness and relevance of the Equalities Monitoring publication.
The report presents a high-level overview of our diversity data up to and including 2023 to 2024 across seven of UKRI’s councils and cross-UKRI funds. We also include exploratory analysis on the high-level diversity composition of grant panel members for the last five financial years.
Because of differences in the way Research England and Innovate UK track their funding, they are excluded from this report. UKRI has enhanced its diversity reporting with the publication of:
- Innovate UK’s applicant diversity data for 2022 to 2023
- UKRI’s workforce equalities monitoring 2023 to 2024
Each year, across our seven research councils, we administer thousands of applications to hundreds of funding opportunities. Our accompanying funding data dashboard on Tableau provides access to this dataset.
For help to interpret or navigate the funding data dashboard, email equality@ukri.org
A comprehensive explanation of the data, methodology and rationale can be found in the methodology annex.
In the following text we refer to ‘principal investigator’ and ‘co-investigator’. These roles have been replaced in UKRI Funding Service applications with the new ‘project lead’ and ‘co-lead’ roles, but the changes do not apply to funding opportunities included in this report, which use the Joint Electronic Submission (Je-S) system.
Key findings for 2023 to 2024
Where the terms ‘significant’ and ‘significantly’ are used, this refers to statistical significance with a p-value below 0.05.
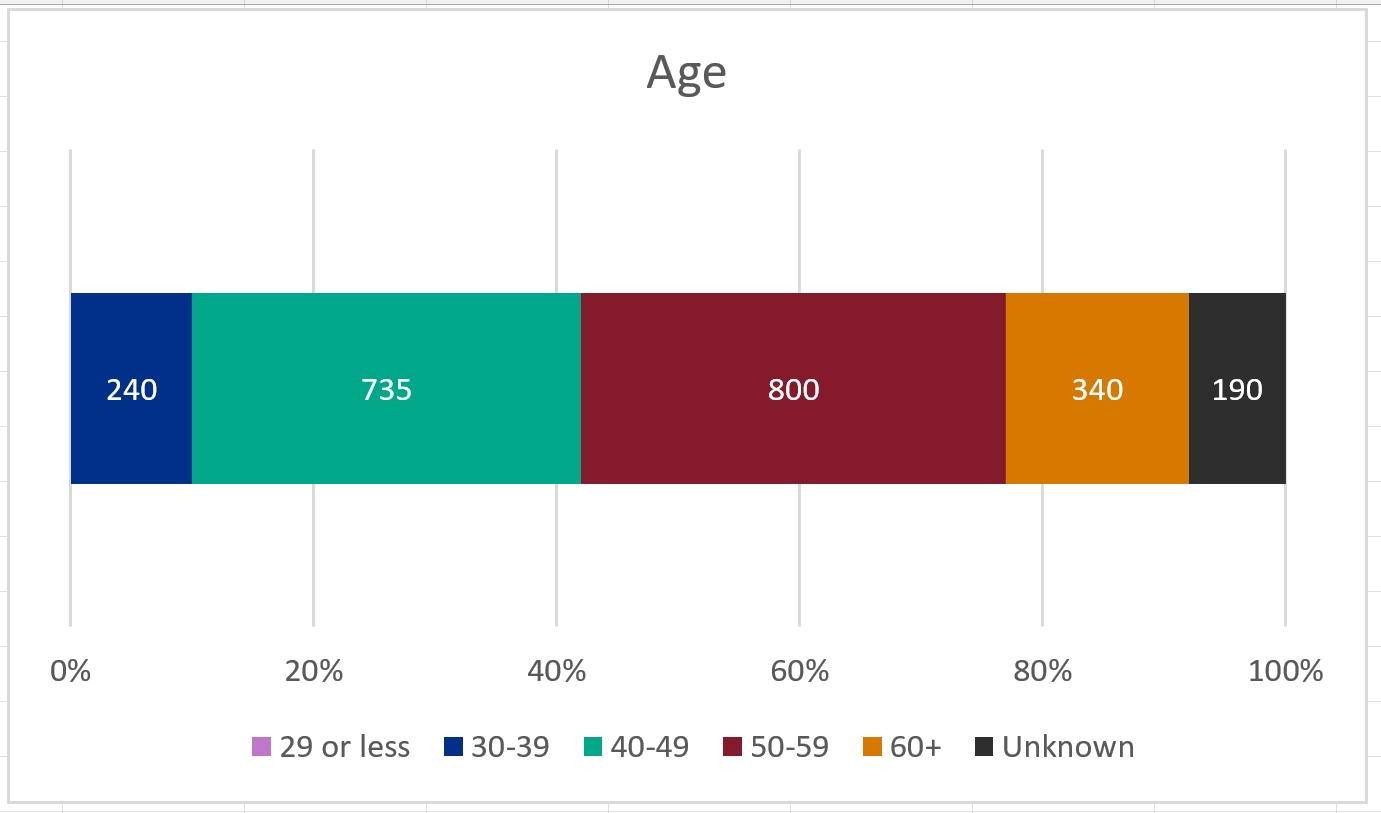
Age
Applications for principal investigators and co-investigators show the highest representation from individuals aged 40 to 49, accounting for 40% and 38% of applicants respectively. By contrast, researcher co-investigators and fellows tend to be younger, with the majority aged 30 to 39 (58% and 55%, respectively).
The 29-or-less age group had the highest award rate for principal investigators, at 43%, but had fewer than 50 applicants. The 30 to 39 and 40 to 49 age group had award rates of 32%, the 50 to 59 and 60 plus age groups 33%. The interaction between age groups was not significant.
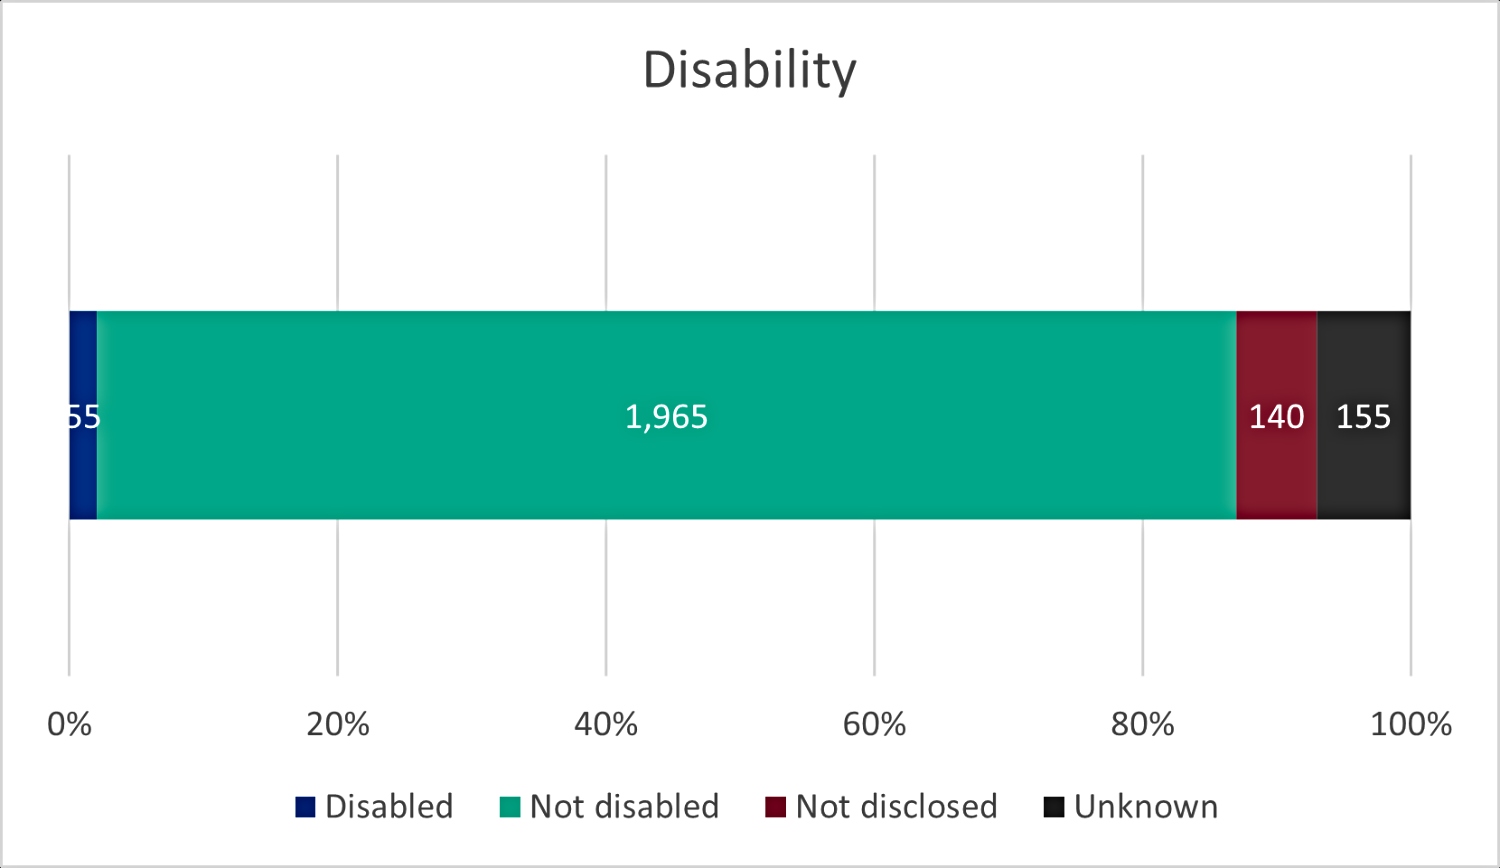
Disability
While 27% of principal investigator applicants with disclosed disabilities were awarded funding, compared to 32% of those with no disability, this difference was not statistically significant. The lack of statistical significance was observed across other roles, suggesting no substantial disparity in award rates for applicants disclosing a disability.
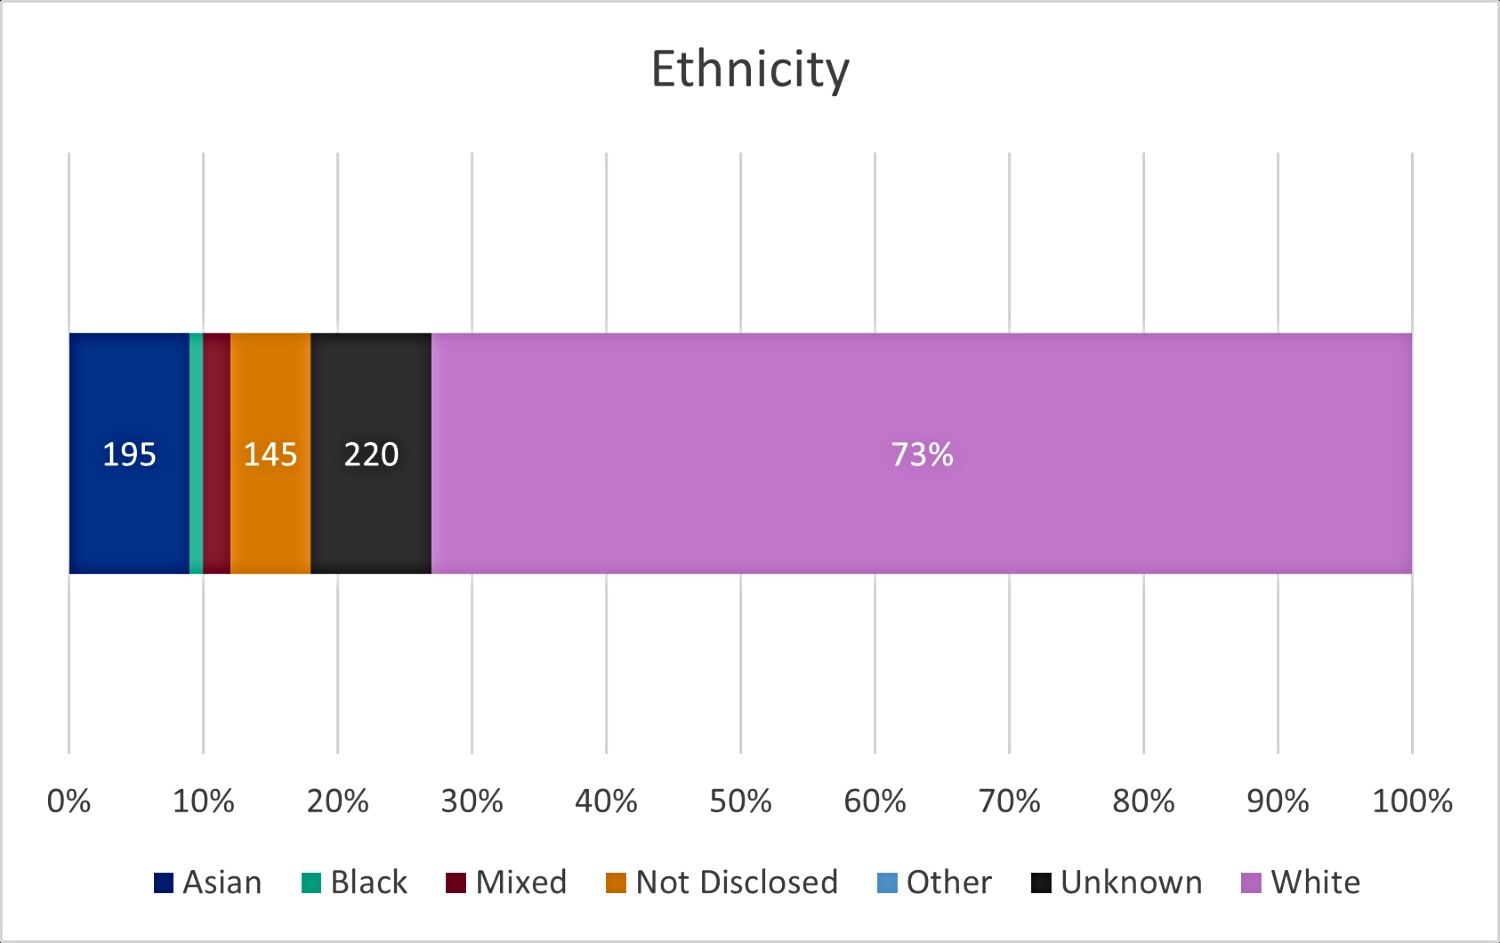
Ethnicity
Award rates for principal investigators varied by ethnicity. Applicants from the White ethnic group had a significantly higher award rate (34%) compared to those from Asian (25%) and Black (13%) ethnic groups. Similarly, principal investigators who did not disclose their ethnicity had a significantly higher award rate (36%) than Asian and Black ethnic groups. This interaction has also been seen in all financial years since 2021 to 2022.
For co-investigators, White applicants (32%) and those who did not disclose their ethnicity (34%) had significantly higher award rates than Asian applicants (26%).
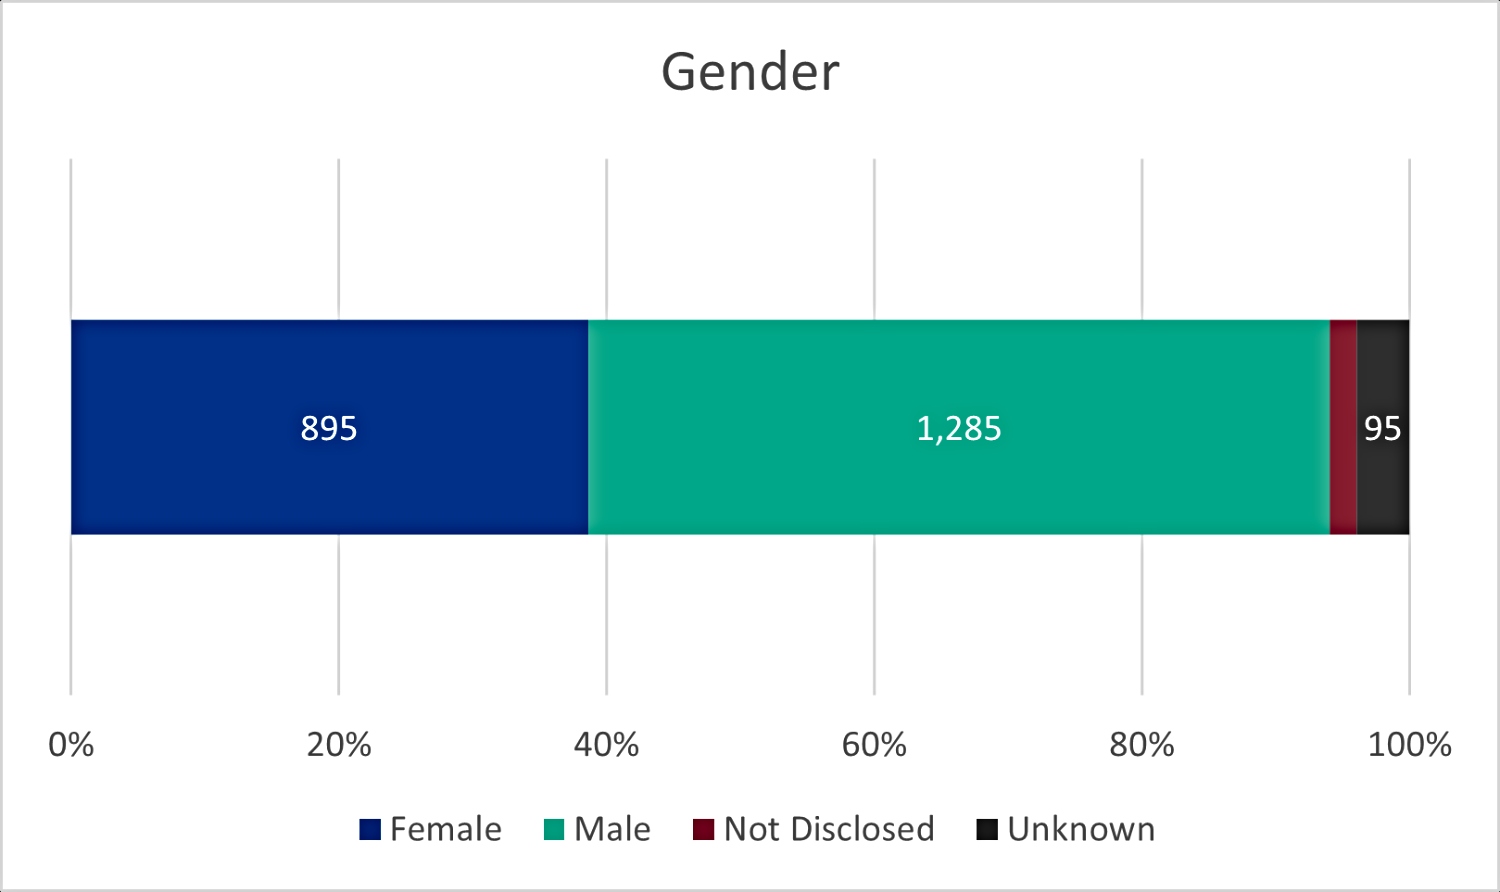
Gender
Across all roles, male applicants made up the majority, with 66% of principal investigator applications and 63% of co-investigator applications. For researcher co-investigators and fellowships, representation is closer to parity, with male applicants at 54%.
Female applicants for fellowships achieved a significantly higher award rate compared to males, with an 8 percentage point difference. While gender disparities in application numbers persist, award rates for female applicants for certain role types are also persistently statistically higher.
Intersectionality
Intersectional analysis revealed that over half (52%) of awards for principal investigators went to White male applicants, highlighting the concentration of funding outcomes within this demographic group. Addressing these disparities requires a nuanced approach, recognising the complex interplay of multiple characteristics.
Panel composition
Panels making funding decisions were predominantly White (73%), male (56%), not disabled (85%), and aged 50 to 59 (35%). These demographics emphasise the importance of continued efforts to diversify panel membership, as decision-making processes play a critical role in shaping funding outcomes.
Key themes and next steps
While there are some signs of equity in award rates for applicants disclosing disabilities and female fellowship applicants, significant gaps remain in award rates by ethnicity and intersectional representation. There are likely several contributing factors to these disparities, occurring at various points in the application and award processes.
Moving forward, UKRI aims to better understand and address these causes though experimenting and innovating in peer review (including working with the UK Metascience Unit), improving transparency in decision-making, and creating the conditions for greater diversity among applicants and panels alike.
It is important to note that panels making funding decisions do not have access to applicants’ demographic data, such as ethnicity, disability or gender. As such, any differences in award rates reflect systemic patterns rather than biases within the decision-making process itself.
Introduction
We publish diversity data on applicants, awards, and panel members against four diversity characteristics (age, disability, ethnicity and gender).
The Joint Electronic Submission (Je-S) system asks applicants and panel members to provide information on gender with male, female or ‘not disclosed’ as response options. For this reason, we use the terminology male and female to describe gender categories throughout this document. We realise these are not in alignment with data reporting categories for equality monitoring data, and reflect this through data collection in our new grant application system (the UKRI Funding Service) by collecting sex and gender reassignment information.
As we develop the Funding Service, we are expanding data collection across all users. Applications administered through the Funding Service are excluded while we enhance this data collection capability. We therefore exclude 1,967 applications for 2023 to 2024 (7% of total applications).
Our mission is for a thriving and inclusive research and innovation (R&I) system. One of our strategic objectives, as published in the UKRI strategy, is to support diversity of people and ideas. We are committed to developing initiatives and innovating our processes to increase the diversity of people able to apply for, participate in, and benefit from investments in research and innovation. We collect and analyse the application and award data to monitor, inform, and understand how our policies are working and to be transparent.
What is included
The data on applicants and awardees is broken down by role type:
- principal investigators
- co-investigators
- researcher co-investigators
- fellows
- studentship starts
The data on panel members includes chairs and panel members listed as having attended or contributed to grants panel meetings.
In May 2023, UKRI announced the streamlining of 35 grant roles, previously used across the organisation for its funded projects, into a set of 12 harmonised roles. In many cases, harmonisation has involved consolidating various functionally identical roles which had different names across our nine councils.
A new role called ‘project lead’ replacing the principal investigator title is among the changes. Role changes apply only to applications made using the Funding Service. The funding opportunities included in this report, which use the Joint Electronic Submission (Je-S) system, were not affected.
See our guidance on the new roles, including how they map to the previous roles in Je-S.
The changes to grant roles will be reflected in the data in due course when we include applications from the Funding Service.
Data is available on the accompanying dashboard on Tableau from financial years 2014 to 2015, to 2023 to 2024.
Discussion within this report is principally focused on award rate data, defined as the number of awardees as a percentage of the number of applicants, for the latest financial year (2023 to 2024). However, for sections on research council-level breakdowns or intersectionality, award rate data is displayed cumulatively over a five-year period (from 2019 to 2020, to 2023 to 2024) due to the small number of awardees within some groups. This is consistent with our previous publications.
This report is based on competitive UKRI funding to named individuals run through the seven UKRI research councils and cross-UKRI funds. Competitive funding opportunities typically involve an open opportunity for proposals or applications where only the highest-ranked proposals, based on an evaluation process, are funded.
Horizon Europe Guarantee funding is excluded, as the competitive assessment is conducted externally by the European Commission rather than through UKRI’s own processes. The number and value of Horizon awards can be found in the UKRI investment and outputs data 2023 to 2024.
The category ‘cross-UKRI’ includes applications to funding opportunities which are hosted by UKRI. The seven UKRI research councils are:
- Arts and Humanities Research Council (AHRC)
- Biotechnology and Biological Sciences Research Council (BBSRC)
- Engineering and Physical Sciences Research Council (EPSRC)
- Economic and Social Research Council (ESRC)
- Medical Research Council (MRC)
- Natural Environment Research Council (NERC)
- Science and Technology Facilities Council (STFC)
The report includes:
- the proportion of applicants and awardees sharing a characteristic by role type
- award rates (number of awardees as a percentage of the number of applicants) for principal investigators and fellows
- statistical testing to assess whether there is sufficient statistical evidence to reject the notion that the reported differences in award rates across characteristics are occurring by chance (see the technical annex for details)
- median award values for successful principal investigators and fellows, and ‘award rate by value’, which is the value of the total amount awarded as a percentage of the total amount applied for, for principal investigators and fellows
- intersectionality analysis, which is limited to the interaction between gender and other diversity characteristics due to small numbers within these groups
- the proportion of doctoral studentship starts sharing a characteristic
- the proportion of panel members sharing a characteristic
This report comprises an introductory section covering the distribution of applicants and awardees for each role type, by research council. Then follows sections for each of the four characteristics: age, disability, ethnicity and gender. For each of the characteristics, there are subsections which discuss the composition of applicants, award rate overall, council-level award rate, the amount awarded and the intersection with gender.
Throughout this report, STFC frequently has higher award rates for principal investigators than the other research councils. STFC’s main competitive funding mechanisms are often more targeted, which results in fewer applications and higher award rates for principal investigators. Some of these mechanisms include expressions of interest and consolidated grants (where a department or group submit a single integrated proposal).
Similarly, the allocation of funding for ESRC fellows differs from other fellowship opportunities awarded by UKRI. ESRC supports several fellowship opportunities, but the mechanism through which funding is allocated varies. As the allocation of funding for ESRC’s Postdoctoral Fellowship Scheme is devolved to Doctoral Training Partnerships, ESRC only awards grants to successful candidates and does not hold data on the total applicant pool. This results in nearly a 100% award rate in that scheme.
This affects aggregated UKRI-level data by lowering average award amounts, increasing award rates, and increasing award rates by value. The comparison of fellowship award rates between ESRC and the other councils is therefore less meaningful. Furthermore, it illustrates some of the complexity in interpretating the data, because different demographic groups are differently represented in different disciplines and different career stages.
This illustrates some of the complexity in interpreting our aggregated data. For example, there are variations across councils in award rates, award values, and demographic representation among applicants. These differences introduce layers of nuance that can obscure the picture.
For example, the unequal representation of demographic groups among applicants to each council means that differences in award rates and awards values between demographic groups reported at aggregated UKRI level could be at least in part due to differences in award rates and award values between councils. These challenges highlight the importance of contextual understanding and careful analysis when interpreting aggregated UKRI data.
Methodology
We introduced inferential statistics in the sections on UKRI award rate for the first time in our 2021 to 2022 publication and continue to use these in this report. We have used permutation tests to compare groups and determine if there are statistically significant differences between them.
While summary statistics (such as means) provide a descriptive summary of data, inferential statistics (such as permutation tests) go a step further by helping us make statistical inferences about characteristics. They are useful tools for policymakers to gain deeper insights. While statistical significance is a valuable metric in research, it is crucial to recognise the limitations and avoid overinterpreting these analyses.
Given the level of granularity at which we are presenting the findings, there may be instances where award rates are based on a small number of applications. In instances where the text makes an explicit reference to an award rate, we will include the application count where the number of applicants is fewer than 50. In these situations, we use ‘N=’ to indicate number of applications. We encourage users to explore the funding data dashboard on Tableau for further breakdowns of data.
We also continue not to include comparisons to the Higher Education Statistical Agency (HESA) and the Office for National Statistics (ONS) Labour Force Survey. Some UKRI funding opportunities allow for internationally domiciled applicants or researchers outside of UK higher education institutions, and therefore, the two do not compare like-for-like.
While HESA comparisons were kept in the studentship section of our 2021 to 2022 report, the discrepancies in reporting windows mean that HESA data for 2023 to 2024 was not available when this report was written, so we cannot provide benchmarks for the studentship section in this report.
For information on award rate for all role types and proportion of awardees by protected characteristic please see our diversity data dashboard on Tableau.
We include the diversity composition of UKRI’s panel members for the first time.
For more detail on the methodology, see the technical annex.
Applicants and awardees
Distribution in 2023 to 2024
The count of applications and awardees by council for 2023 to 2024 is shown in table 1, excluding applications made through the UKRI Funding Service. Within this distribution of applications there are differences in diversity characteristics and application patterns across the research councils and UKRI overall.
Table 1a: EPSRC has the highest number of applications compared to the other councils and STFC the lowest
| Council | Principal investigator | Co-investigator | Researcher co-investigator | Fellow |
|---|---|---|---|---|
| AHRC | 705 | 1,605 | 0 | 150 |
| BBSRC | 1,300 | 2,785 | 265 | 0 |
| EPSRC | 2,345 | 4,535 | 260 | 210 |
| ESRC | 710 | 2,130 | 0 | 265 |
| MRC | 1,140 | 4,600 | 230 | 890 |
| NERC | 485 | 855 | 65 | 35 |
| STFC | 580 | 490 | 50 | 15 |
| UKRI overall | 7,330 | 17,350 | 875 | 1,570 |
Table 1b: number of awards for each council
| Council | Principal investigator | Co-investigator | Researcher co-investigator | Fellow |
|---|---|---|---|---|
| AHRC | 160 | 415 | 0 | 50 |
| BBSRC | 385 | 990 | 95 | 0 |
| EPSRC | 695 | 1,235 | 70 | 30 |
| ESRC | 190 | 575 | 0 | 145 |
| MRC | 290 | 1,185 | 65 | 205 |
| NERC | 185 | 315 | 25 | 15 |
| STFC | 415 | 370 | 45 | 10 |
| UKRI overall | 2,370 | 5,405 | 310 | 455 |
Notes:
- the number of applications and awards for principal investigators, co-investigators, researcher co-investigator and fellows (2023 to 2024), excluding applications through the Funding Service
- as some schemes moved to the Funding Service in 2023 to 2024, the number of applications in table 1a will not be representative of total applications
Age
Applicant composition
Figure 1 shows the composition of UKRI applicants by age group for the four role types: principal investigators, co-investigators, researcher co-investigators and fellows in 2023 to 2024. For principal investigators and co-investigators at UKRI level, the highest number of applicants are aged 40-49, while for fellows and researcher co-investigators most applicants are aged 30-39.
Researcher co-investigators are typically in the early to mid-stages of their careers, reflected in the younger age distribution. Most of our fellowship schemes specifically target early career researchers, which is also reflected in the data.
Figure 1: UKRI applicant age composition by role, 2023 to 2024
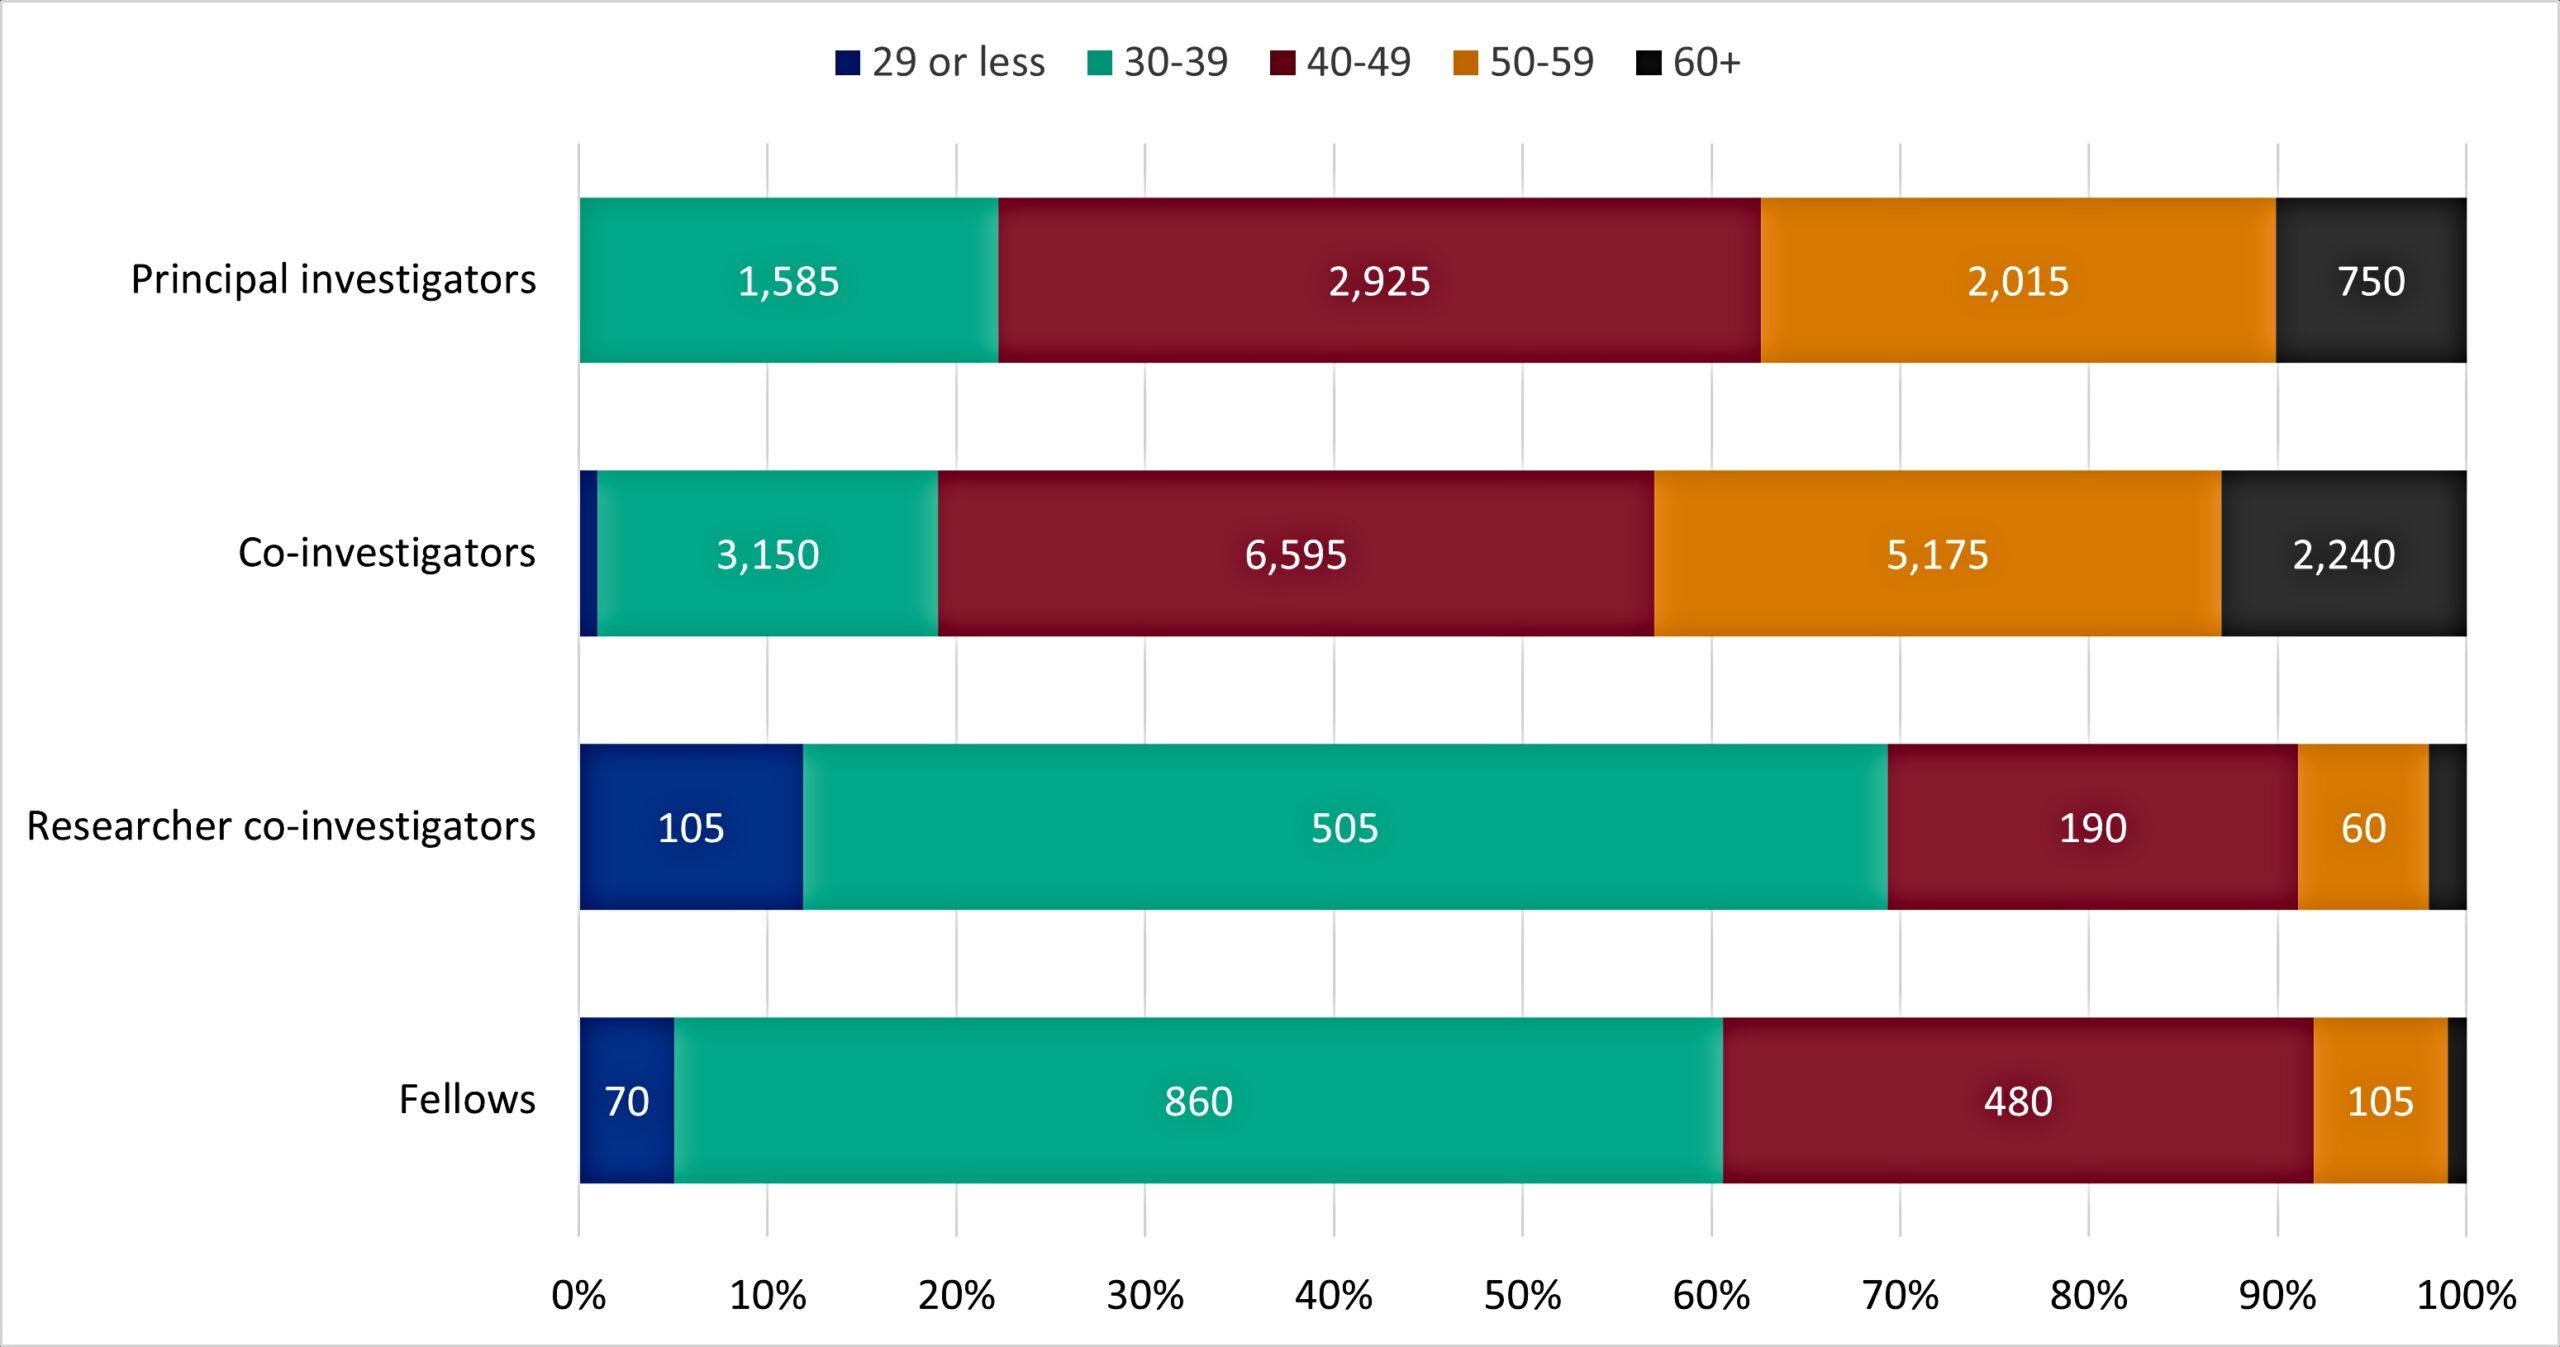
Description of figure 1: This stacked bar chart shows that principal investigators and co-investigators have an older applicant age distribution than researcher co-investigators and fellows.
Source: UKRI diversity data.
Download the data for figure 1 (ODS, 4KB)
Notes:
- labels represent the number of applicants
- counts in groups with less than 2% of the annual role total are not labelled
UKRI award rate
In 2023 to 2024, the 29-or-less age group had the highest award rate, at 43%, but had fewer than 50 applicants for principal investigators in 2023 to 2024 (n=35, figure 2). The interaction was not significant, likely due to the small number of applicants.
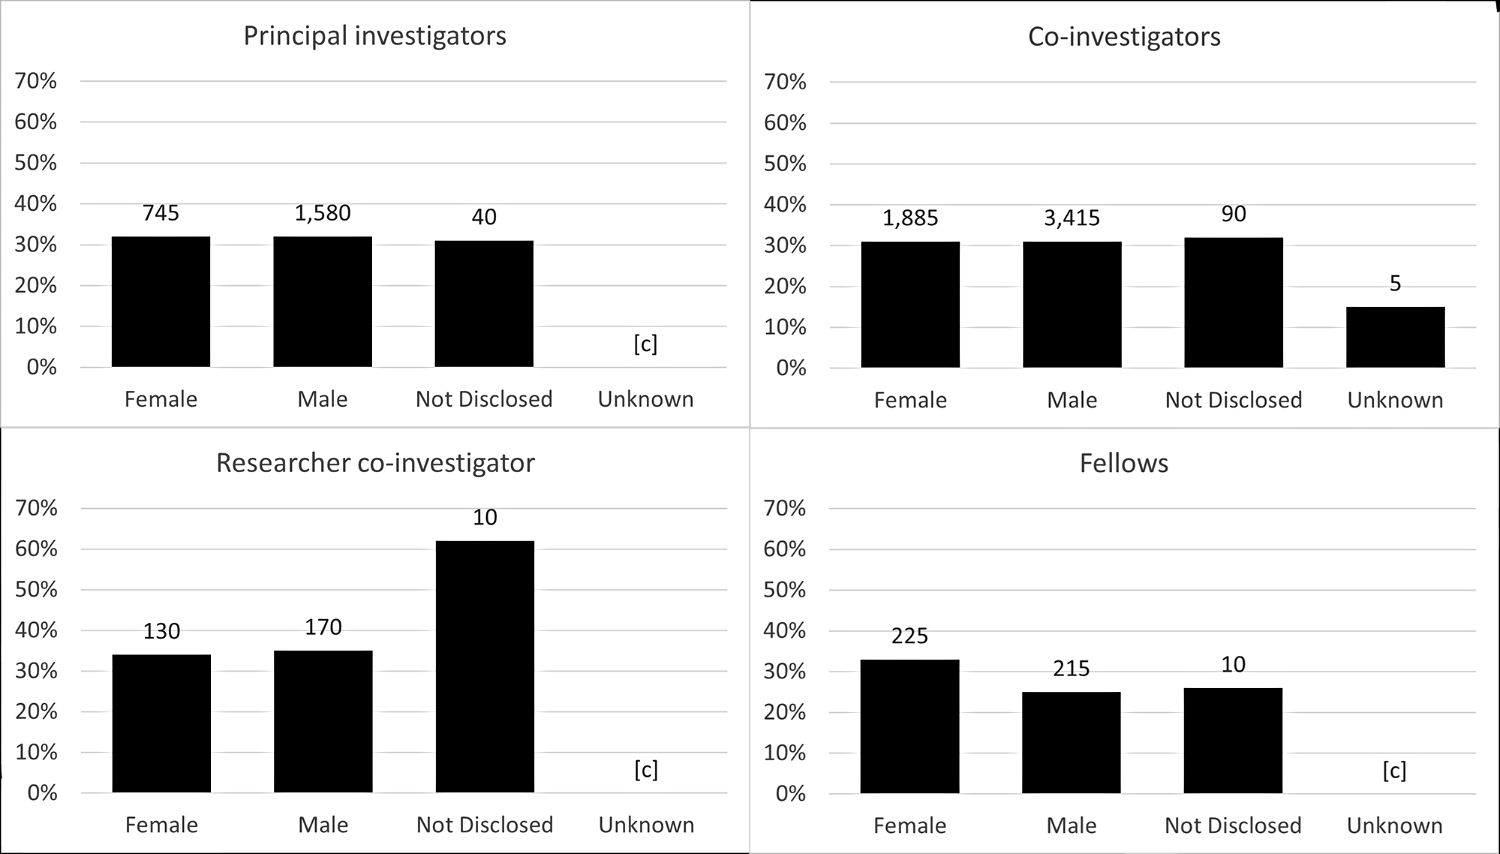
Figure 2: UKRI award rate by age and role type, 2023 to 2024
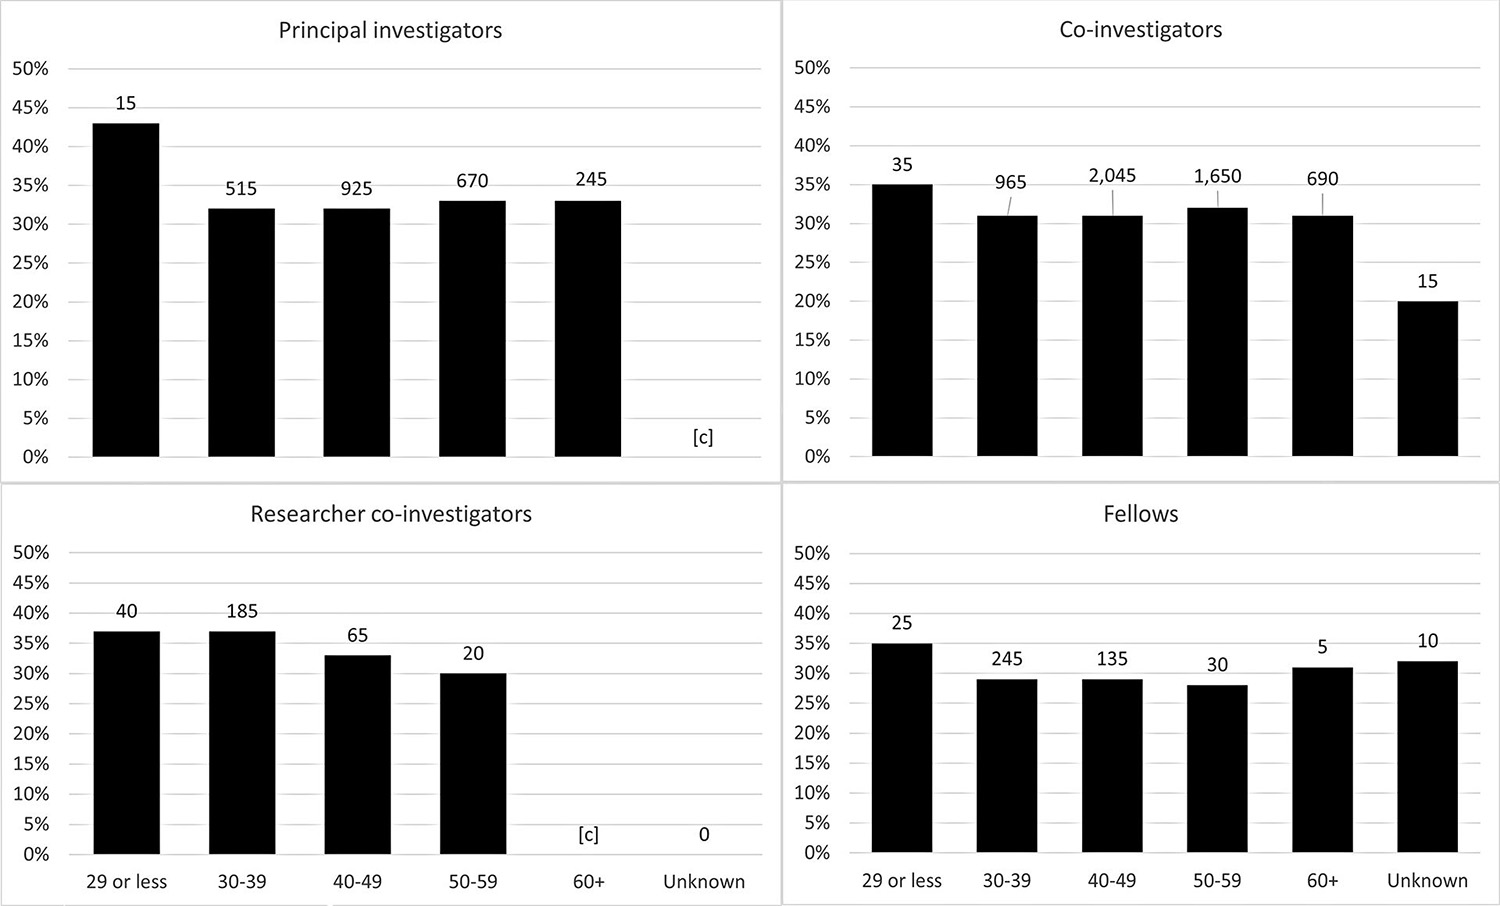
Description of figure 2: Four bar charts showing UKRI award rate by age for principal investigators, co-investigators, researcher co-investigators, and fellows for 2023 to 2024. The charts show that while principal investigators in the 29-or-less age category in 2023 to 2024 had the highest award rate, the low number of applicants and awards mean this is not statistically significant. Source: UKRI diversity data.
Download the data for figure 2 (ODS, 4KB)
Notes:
- rates for groups comprising fewer than five individuals are not reported
- numbers above the bars represent the number of awardees
Council award rate
To compare award rates by age at research council level we use aggregated data over a five-year period. Table 2 and table 3 present the five-year cumulative award rates for principal investigators and fellows. Across councils and age groups, the range of award rates is much wider than for UKRI overall.
Award rates for principal investigators were highest for the 60 and over and 50 to 59 age group at STFC (78%, table 2).
As explained in the ‘What is included’ section of the introduction, STFC and ESRC frequently have higher award rates for principal investigators and fellows than the other research councils. ESRC’s method of allocating fellowships results in higher award rates and a broader age range (table 3).
Table 2: Award rates for principal investigators vary across age group and councils, there is no age group with the highest award rate for all councils
| Council | 29 or less | 30 to 39 | 40 to 49 | 50 to 59 | 60 and over | Unknown |
|---|---|---|---|---|---|---|
| AHRC | 29% | 31% | 27% | 27% | 23% | [c] |
| BBSRC | [c] | 27% | 26% | 30% | 32% | 16% |
| EPSRC | 44% | 32% | 29% | 31% | 29% | 27% |
| ESRC | 19% | 21% | 22% | 28% | 28% | [c] |
| MRC | [c] | 21% | 23% | 25% | 25% | [c] |
| NERC | 36% | 25% | 27% | 30% | 33% | [c] |
| STFC | 55% | 55% | 69% | 78% | 78% | [c] |
| Cross-UKRI | [c] | 26% | 32% | 29% | 35% | [c] |
| UKRI overall | 29% | 28% | 28% | 31% | 32% | 20% |
Notes:
- award rate by age for principal investigators by council, cross-UKRI, and UKRI overall (five-year cumulative, 2019 to 2020 to 2023 to 2024)
- the symbol ‘[c]’ means the value has been suppressed
Table 3: ESRC’s award rates for fellowships are higher than the other councils, particularly for the 29-or-less age group, due to their method of allocation.
| Council | 29 or less | 30 to 39 | 40 to 49 | 50 to 59 | 60 and over | Unknown |
|---|---|---|---|---|---|---|
| AHRC | [c] | 32% | 34% | 29% | 18% | [c] |
| BBSRC | 12% | 15% | [c] | [w] | [c] | [c] |
| EPSRC | 16% | 20% | 20% | 30% | [c] | 15% |
| ESRC | 88% | 68% | 52% | 47% | 46% | 90% |
| MRC | 26% | 24% | 24% | 18% | [w] | 20% |
| NERC | [c] | 12% | 10% | [c] | [w] | [c] |
| STFC | [w] | 8% | 8% | [c] | [w] | [c] |
| Cross-UKRI | 14% | 18% | 14% | [c] | [w] | 15% |
| UKRI overall | 28% | 23% | 24% | 27% | 21% | 24% |
Notes:
- award rate by age for fellows by council, cross-UKRI, and UKRI overall (five-year cumulative, 2019 to 2020 to 2023 to 2024)
- the symbol ‘[c]’ means the value has been suppressed
- the symbol ‘[w]’ is used during suppression to show values for groups where there were no awardees
Median award amount
For UKRI overall, the median award amount for principal investigators in 2023 to 2024 increased with age (table 4). This is consistent with previous years. The highest median award amount for 2023 to 2024 was for the 60+ age group (£554,000; table 4). For fellows, in 2023 to 2024, the 40-49 age group had the highest median award amount (£588,000; table 5).
Table 4: The median award amount for principal investigators in 2023 to 2024 increased with age
| Year | 29 or less | 30 to 39 | 40 to 49 | 50 to 59 | 60 and over | Unknown |
|---|---|---|---|---|---|---|
| 2019-2020 | £243,000 | £248,000 | £365,000 | £404,000 | £488,000 | £313,000 |
| 2020-2021 | £217,000 | £269,000 | £397,000 | £438,000 | £511,000 | £136,000 |
| 2021-2022 | £164,000 | £261,000 | £381,000 | £421,000 | £485,000 | £177,000 |
| 2022-2023 | £79,000 | £284,000 | £377,000 | £473,000 | £473,000 | £463,000 |
| 2023-2024 | £117,000 | £292,000 | £449,000 | £491,000 | £554,000 | [c] |
Notes:
- median award amount for principal investigators by age. UKRI overall, yearly, from 2019 to 2020, to 2023 to 2024
- the symbol ‘[c]’ means the value has been suppressed
- values are rounded to the nearest £1,000
Table 5: For fellows in 2023 to 2024, the 40-49 age group had the highest median award amount.
| Year | 29 or less | 30 to 39 | 40 to 49 | 50 to 59 | 60 and over | Unknown |
|---|---|---|---|---|---|---|
| 2019-2020 | £107,000 | £399,000 | £489,000 | £487,000 | [c] | £159,000 |
| 2020-2021 | £105,000 | £812,000 | £975,000 | £105,000 | £109,000 | £108,000 |
| 2021-2022 | £108,000 | £406,000 | £397,000 | £165,000 | [c] | £119,000 |
| 2022-2023 | £111,000 | £408,000 | £412,000 | £235,000 | [c] | £405,000 |
| 2023-2024 | £128,000 | £350,000 | £588,000 | £239,000 | £244,000 | £357,000 |
Notes:
- median award amount for fellows by age. UKRI overall, yearly, from 2019 to 2020, to 2023 to 2024
- the symbol ‘[c]’ means the value has been suppressed
- values are rounded to the nearest £1,000
Disability
Applicant composition
In 2023 to 2024, the percentage of applicants reporting they had a disability was 3% for principal investigators and co-investigators, 4% for researcher co-investigators (N=35), and 5% for fellows (figure 3).
The percentage of applicants choosing not to share their disability information is higher than the percentage of applicants declaring a disability for principal investigators (7%), co-investigators (7%) and fellows (6%).
Figure 3: UKRI applicant disability composition by role, 2023 to 2024
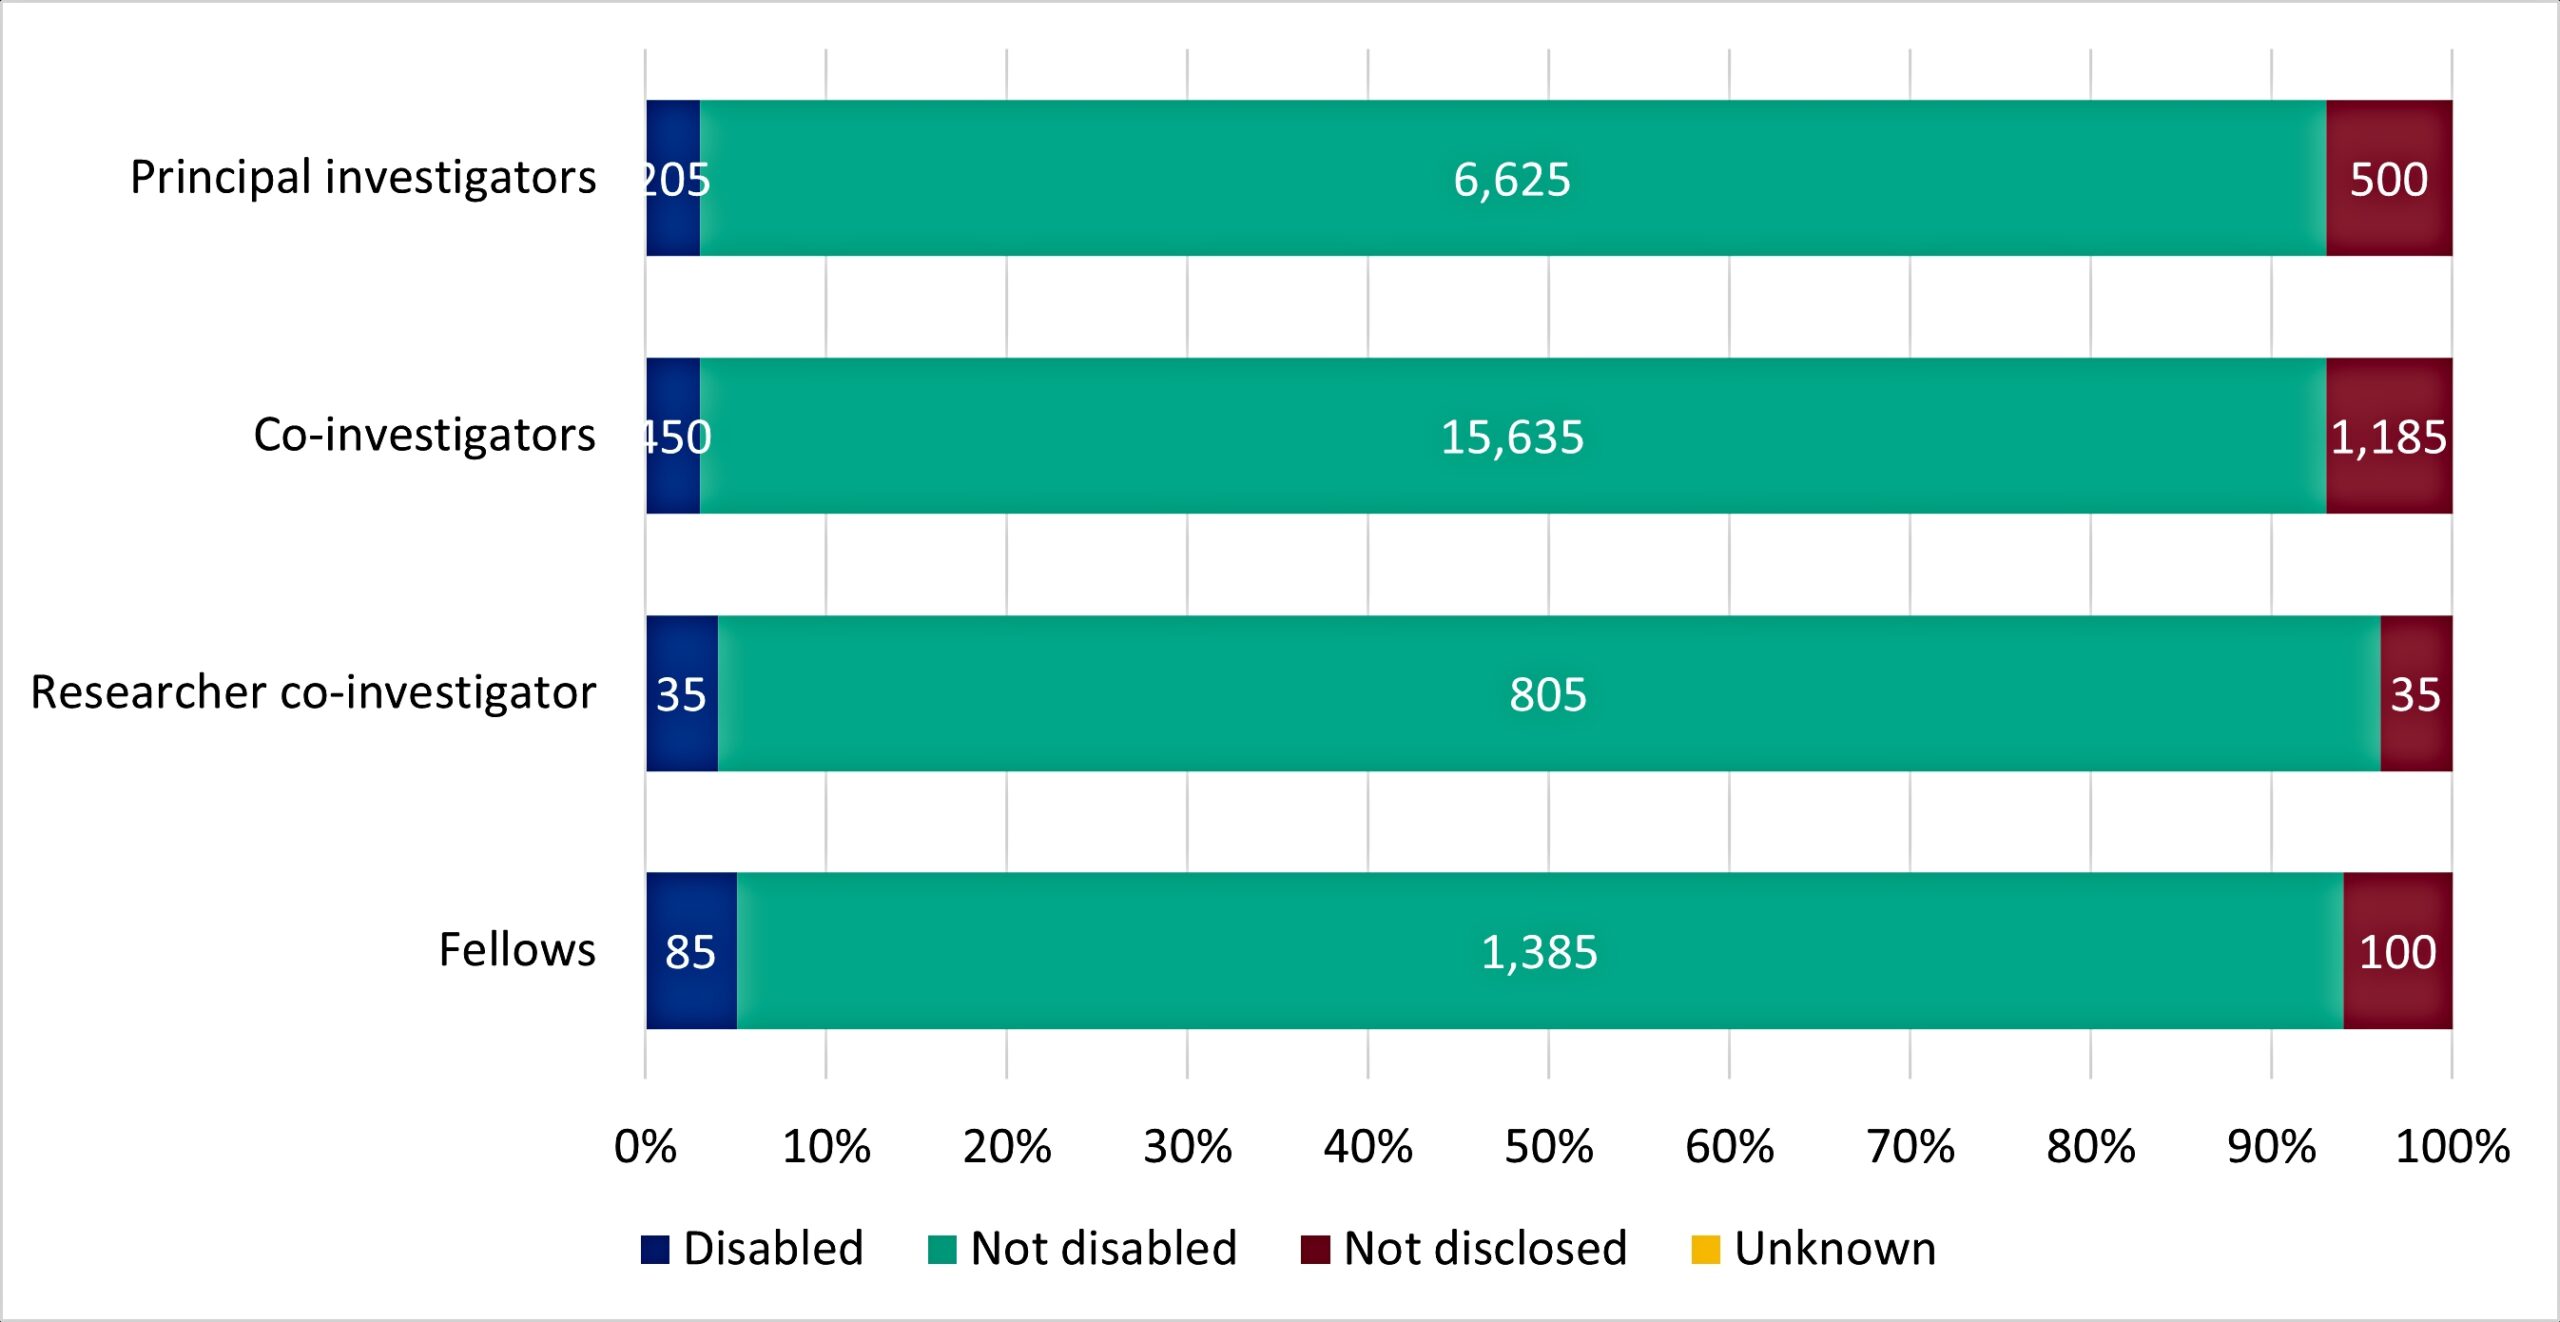
Description of figure 3: This stacked bar chart of role types (principal investigator, co-investigator, researcher co-investigator and fellow) shows that most UKRI applicants identify as not disabled for all role types. Source: UKRI diversity data.
Download the data for figure 3 (ODS, 4KB)
Notes:
- labels represent the number of applicants
- counts in groups with less than 2% of the annual role total are not labelled
UKRI award rate
Although there are small differences in award rates for those with a disability and those who did not declare a disability (figure 4), analysis of 2022 to 2023 and 2023 to 2024 data indicates that these differences are not statistically significant for any role type.
This means the differences are within the range of outcomes we would expect to see if award rate and disability were not associated.
Figure 4: UKRI award rate by role, 2023 to 2024
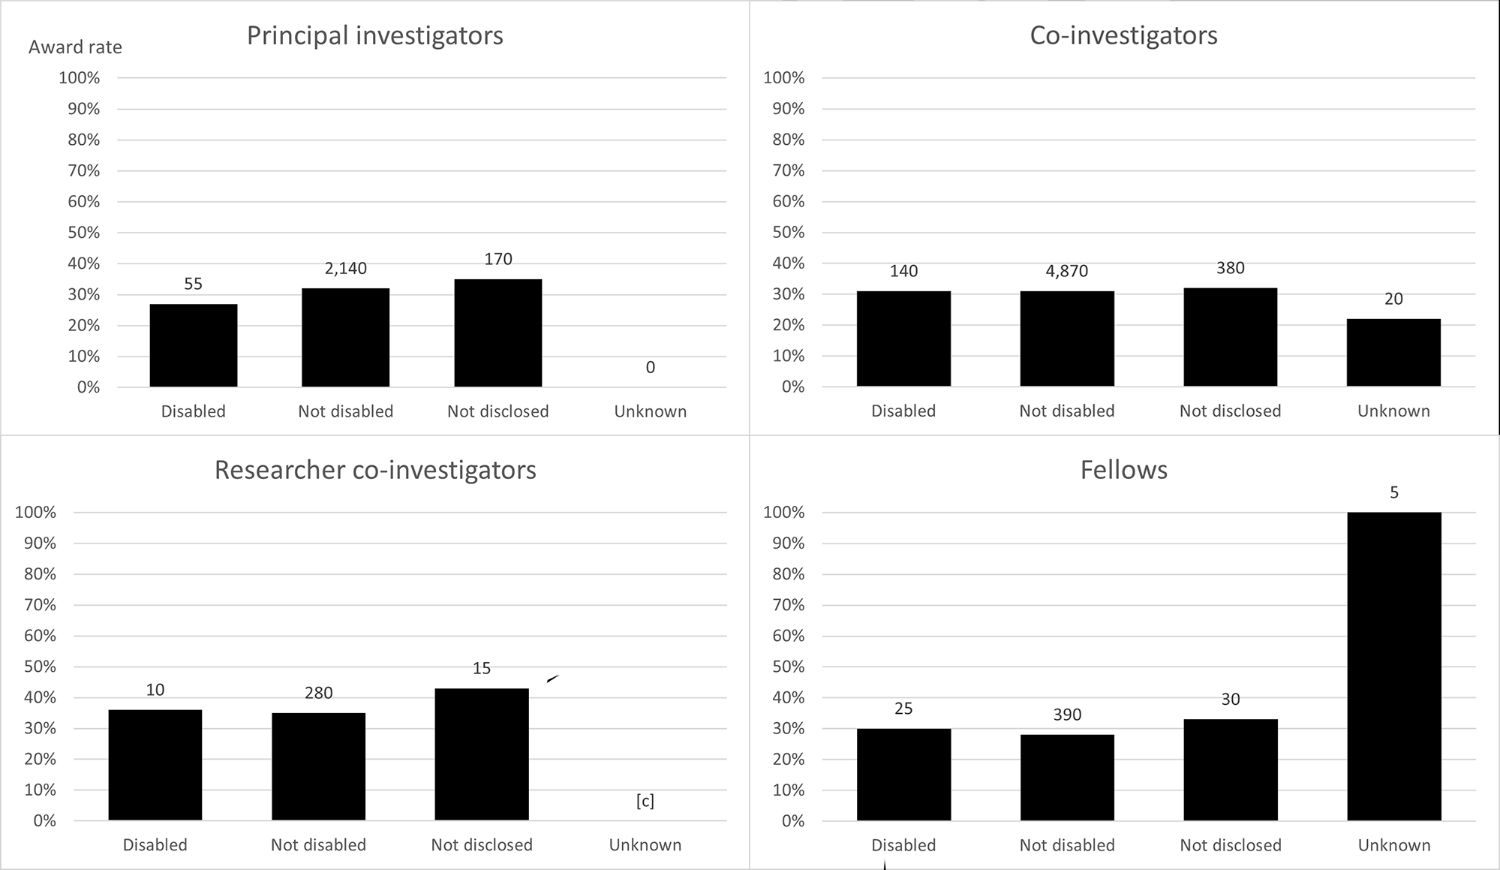
Description of figure 4: These four bar charts show that award rates were broadly similar for those who declared a disability and those who did not, for all role types. Source: UKRI diversity data.
Download the data for figure 4 (ODS, 4KB)
Notes: Rates for groups comprising fewer than five individuals are not reported. Numbers above the bars represent the number of awardees.
Council award rate
For principal investigators, award rates were higher for applicants reporting a disability at NERC (30%), AHRC (30%) and BBSRC (29%; table 6) than those not reporting a disability in the same council.
For fellows, award rates were higher for applicants reporting a disability at ESRC (76%), MRC (24%), cross-UKRI (22%) and UKRI overall (30%; table 7) than those not reporting a disability in the same council.
See ‘What is included’ in the introduction section for a note on high ESRC and STFC award rates.
For more information on council breakdowns, see the funding data dashboard on Tableau.
Table 6: Principal investigators with reported disabilities had higher award rates at AHRC, BBSRC and NERC compared to those without disabilities in the same councils
| Council | Disabled | Not disabled | Not disclosed | Unknown |
|---|---|---|---|---|
| AHRC | 30% | 27% | 33% | [c] |
| BBSRC | 29% | 28% | 27% | [w] |
| EPSRC | 30% | 30% | 33% | [w] |
| ESRC | 23% | 23% | 24% | [c] |
| MRC | 21% | 24% | 25% | [c] |
| NERC | 30% | 28% | 26% | [w] |
| STFC | 60% | 70% | 69% | 0% |
| Cross-UKRI | 23% | 31% | 26% | 0% |
| UKRI overall | 29% | 30% | 30% | 30% |
Notes:
- award rate by disability status for principal investigators by council, cross-UKRI, and UKRI overall (five-year cumulative, 2019 to 2020 to 2023 to 2024)
- the symbol ‘[c]’ means the value has been suppressed
- the symbol ‘[w]’ is used during suppression to show values for groups where there were no awardees
- where award rate is 0, there were no applicants or awardees
Table 7: Fellows with reported disabilities had higher award rates at ESRC, MRC, cross-UKRI and UKRI overall compared to those without disabilities in the same councils
| Council | Disabled | Not disabled | Not disclosed | Unknown |
|---|---|---|---|---|
| AHRC | 21% | 32% | 27% | 0% |
| BBSRC | [c] | 14% | [c] | [w] |
| EPSRC | 17% | 20% | 26% | [c] |
| ESRC | 76% | 65% | 66% | 100% |
| MRC | 24% | 23% | 31% | [c] |
| NERC | [c] | 11% | 14% | [c] |
| STFC | [c] | 8% | [c] | [c] |
| Cross-UKRI | 22% | 16% | 18% | [c] |
| UKRI overall | 30% | 23% | 26% | 42% |
Notes:
- award rate by disability status for fellows by council, cross-UKRI, and UKRI overall (five-year cumulative, 2019 to 2020 to 2023 to 2024)
- the symbol ‘[c]’ means the value has been suppressed
- the symbol ‘[w]’ is used during suppression to show values for groups where there were no awardees
- where award rate is 0, there were no applicants or awardees
Median award amount
For UKRI overall, the median award amount for principal investigators and fellows with a disability is lower than those with no known disability for all financial years since 2019 to 2020 (tables 8 and 9).
There are often a low number of disabled fellows, only 25 awardees in total in 2023 to 2024. The award value for different fellowship types across councils varies considerably.
See the accompanying dashboard on Tableau for council breakdowns.
Table 8: Since 2017 to 2018, principal investigators with disabilities consistently received lower median award amounts compared to those without disabilities
| Year | Disabled | Not disabled | Not disclosed | Unknown |
|---|---|---|---|---|
| 2019-2020 | £202,000 | £365,000 | £363,000 | [c] |
| 2020-2021 | £273,000 | £390,000 | £337,000 | [w] |
| 2021-2022 | £241,000 | £ 376,000 | £284,000 | [c] |
| 2022-2023 | £ 288,000 | £390,000 | £ 356,000 | [c] |
| 2023-2024 | £ 414,000 | £433,000 | £425,000 | [w] |
Notes:
- median award amount for principal investigators by disability status. UKRI overall, yearly, from 2019 to 2020 to 2023 to 2024
- the symbol ‘[c]’ means the value has been suppressed
- the symbol ‘[w]’ is used during suppression to show values for groups where there were no awardees
Table 9: The median award amount for fellows with and without disabilities is volatile and varies considerably across year
| Year | Disabled | Not disabled | Not disclosed | Unknown |
|---|---|---|---|---|
| 2019-2020 | £203,000 | £347,000 | £522,000 | [c] |
| 2020-2021 | £191,000 | £675,000 | £ 832,000 | [c] |
| 2021-2022 | £102,000 | £357,000 | £385,000 | £106,000 |
| 2022-2023 | £ 262,000 | £376,000 | £506,000 | [c] |
| 2023-2024 | £140,000 | £341,000 | £260,000 | £602,000 |
Notes:
- median award amount for fellows by disability status. UKRI overall, yearly, from 2019 to 2020 to 2023 to 2024
- the symbol ‘[c]’ means the value has been suppressed
Ethnicity
Applicant composition
Figure 5 shows the overall applicant composition of UKRI applicants by ethnic group and role type, 2023 to 2024. Most applicants for all role types were White. Excluding White, the largest proportion of applicants for all role types were from the combined Asian ethnic group.
Figure 5: UKRI applicant ethnicity composition by role, 2023 to 2024
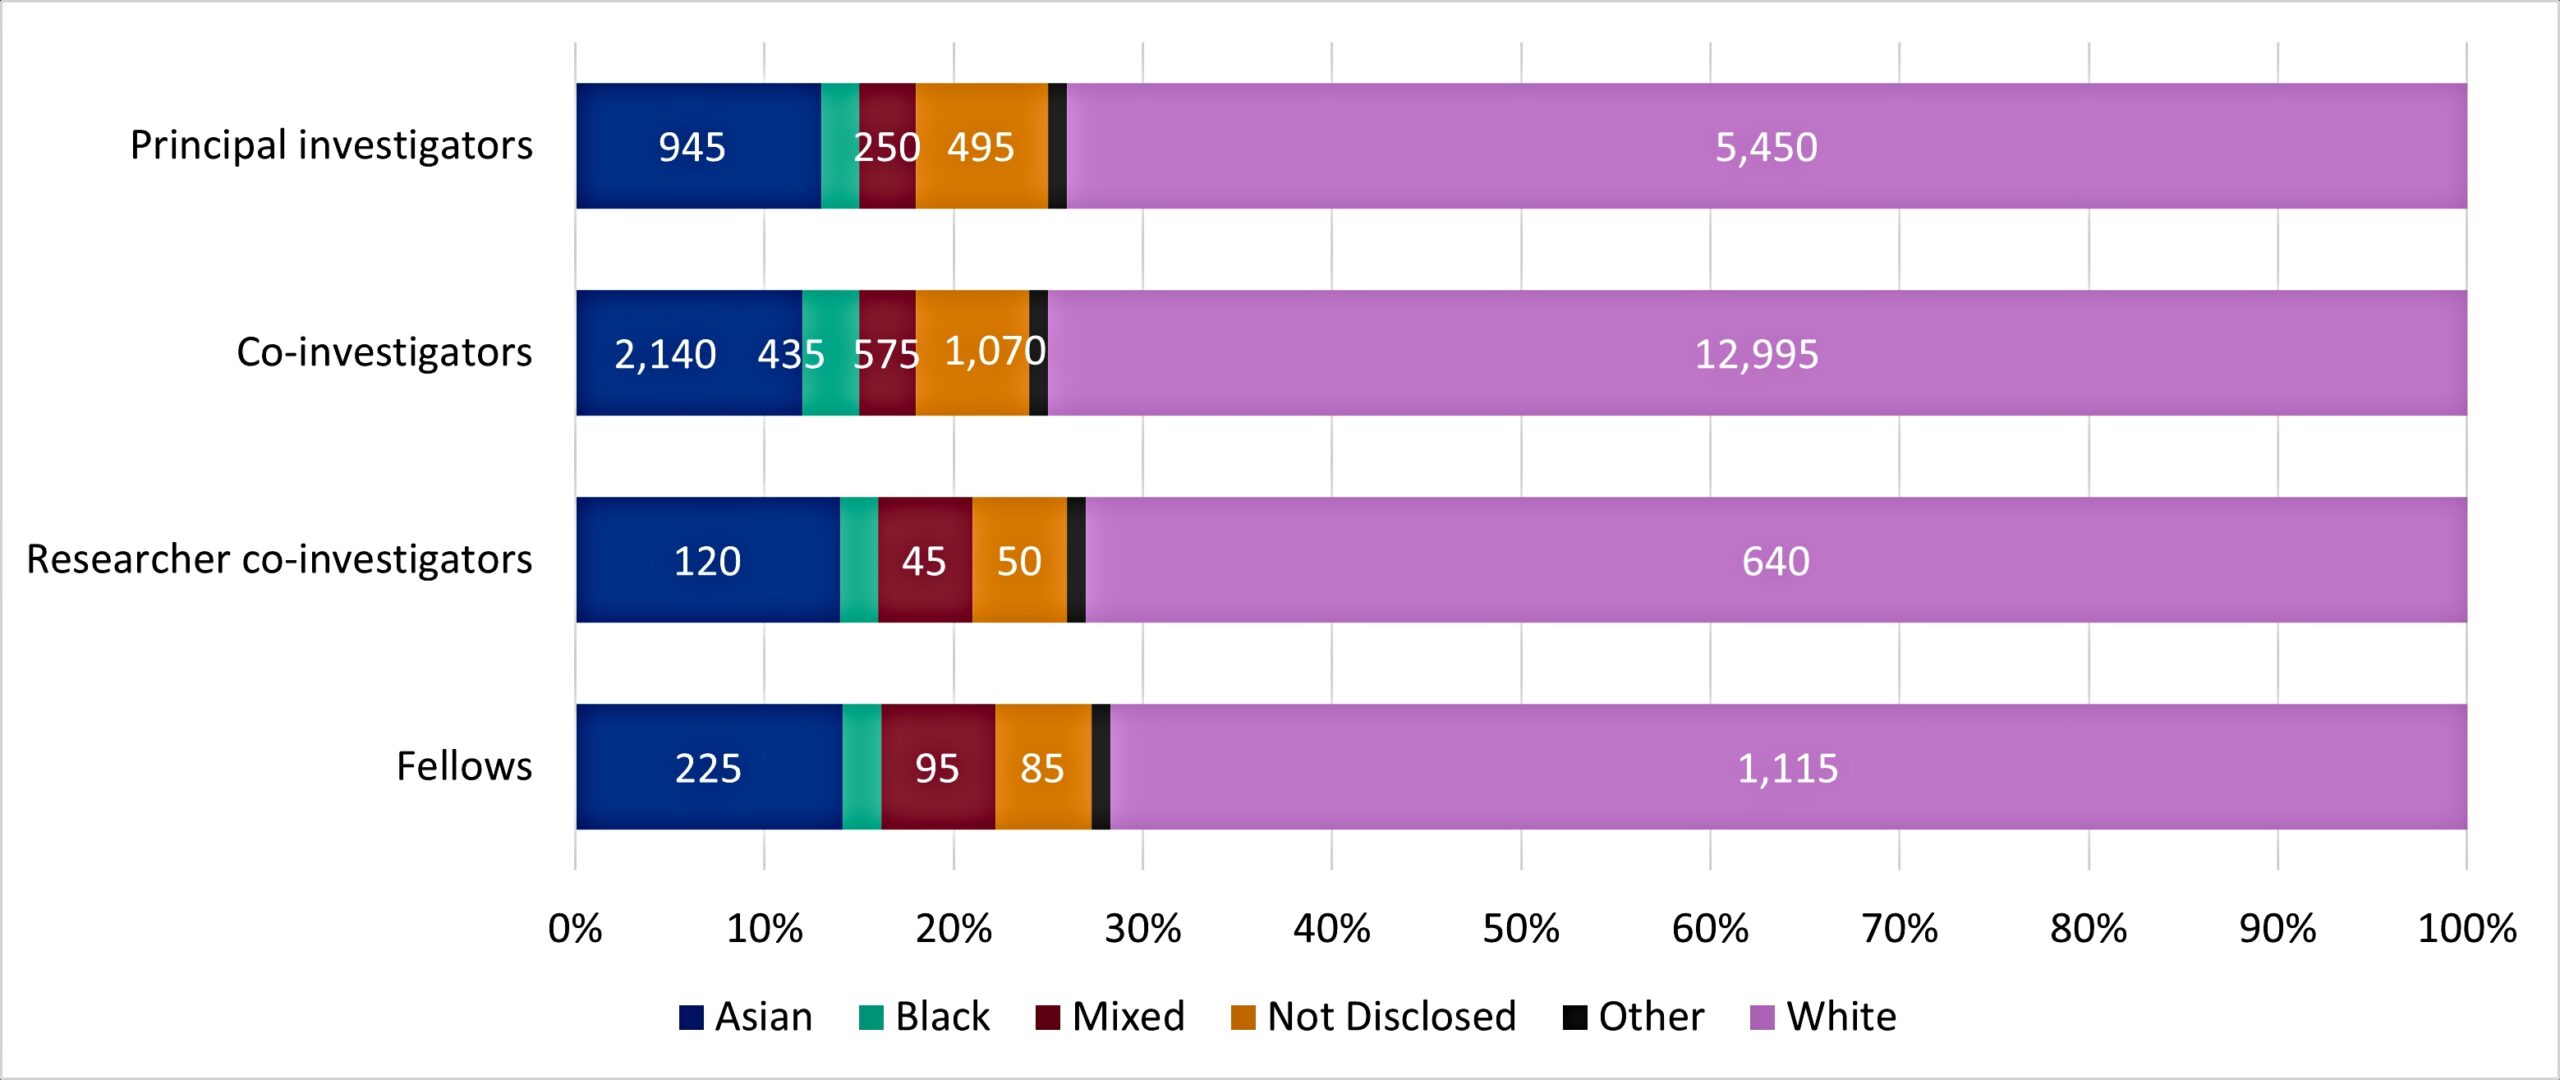
Description of figure 5: This stacked bar chart shows that most applicants are White for all role types. The proportion of White applicants is very similar for principal investigators, co-investigators and researcher co-investigators, but slightly lower for fellows. Source: UKRI diversity data.
Download the data for figure 5 (ODS, 4KB)
UKRI award rate
For principal investigators applying to UKRI in 2022 to 2023 and 2023 to 2024, White applicants and applicants who did not disclose their ethnicity had a significantly higher award rate than both Asian and Black applicants. White co-investigator applicants and co-investigator applicants who did not disclose their ethnicity also had a significantly higher award rate than Asian co-investigator applicants.
Figure 6 shows the award rate by ethnic group. Where the difference in award rates between two specific ethnicities is significant in 2023 to 2024, according to the statistical test, this is presented in table 10. See the annex for results for 2022 to 2023.
Detail on all significant interactions for the four role types and seven ethnicity categories are available in the technical annex.
Figure 6: UKRI award rate by ethnic group and role type, 2023 to 2024
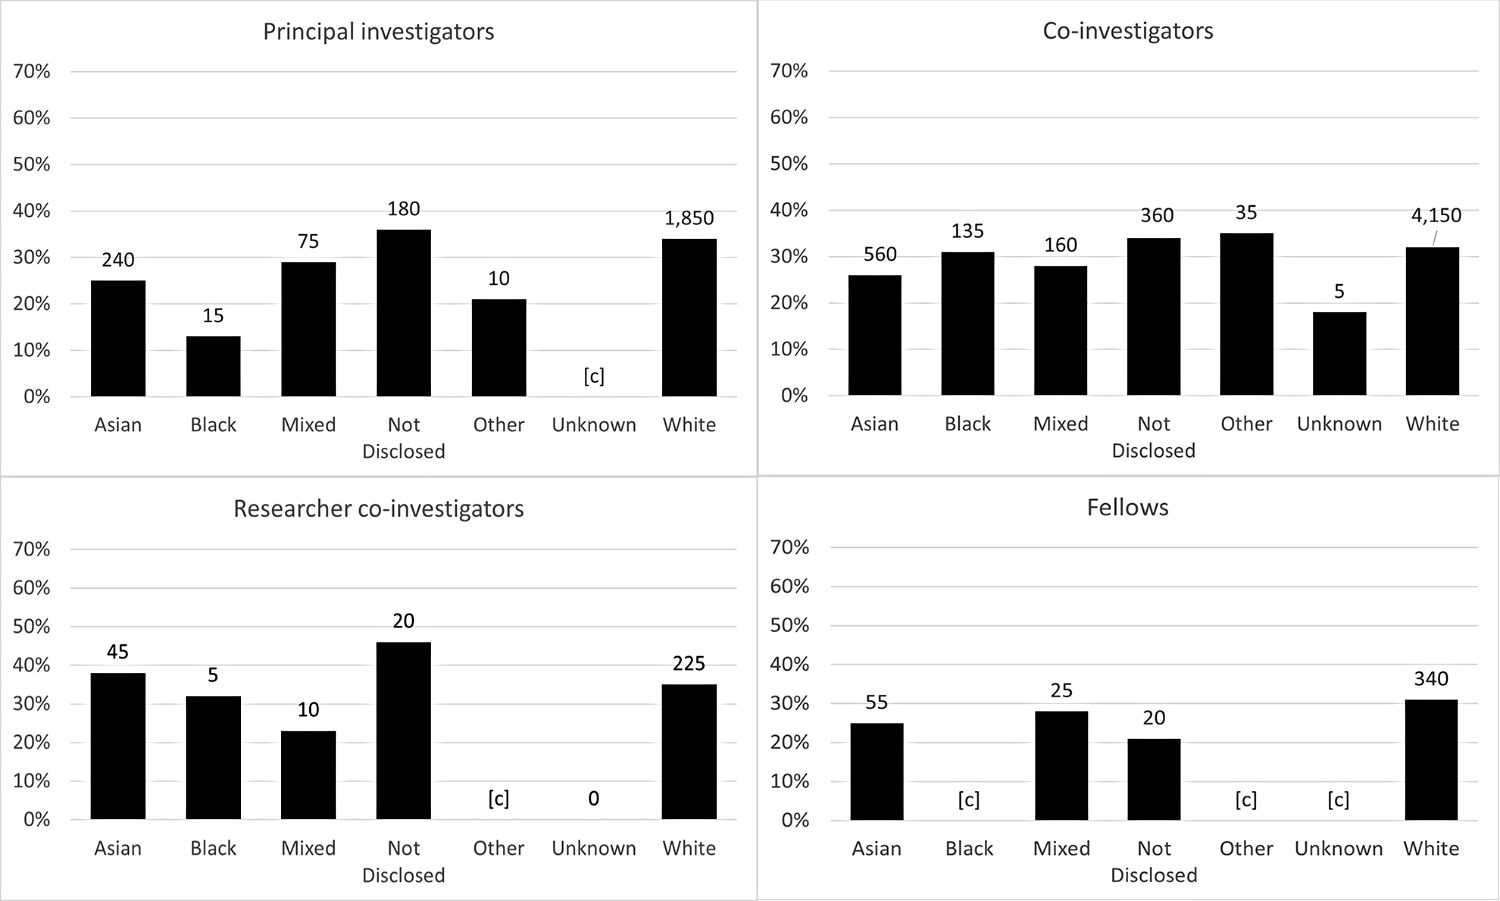
Description of figure 6: These four bar charts show that the award rate for White principal investigators and co-investigators was higher than the award rate for Black and Asian principal investigators and co-investigators. Source: UKRI diversity data.
Download the data for figure 6 (ODS, 4KB)
Notes:
- rates for groups comprising fewer than five individuals are not reported
- numbers above the bars represent the number of awardees
Table 10: For principal investigators applying to UKRI in 2023 to 2024, White applicants and applicants who did not disclose their ethnicity had a significantly higher award rate than both Asian and Black applicants
| Role | Ethnicity 1 | Ethnicity 2 | Recorded award rate difference | Adjusted significance |
|---|---|---|---|---|
| Co-investigator | Not disclosed | Asian | 7% | <0.01 |
| Co-investigator | White | Asian | 6% | <0.01 |
| Principal investigator | Black | Asian | -12% | 0.01 |
| Principal investigator | Mixed | Black | 16% | <0.01 |
| Principal investigator | Not disclosed | Asian | 11% | <0.01 |
| Principal investigator | Not disclosed | Black | 23% | <0.01 |
| Principal investigator | White | Asian | 9% | <0.01 |
| Principal investigator | White | Black | 21% | <0.01 |
Notes:
- significant relationships between ethnicity award rates, based on permutation tests with a 95% range, 2023 to 2024
- the award rate difference equals category 1 minus category 2
- all values are adjusted for multiple testing (see ‘Methodology’ for more information)
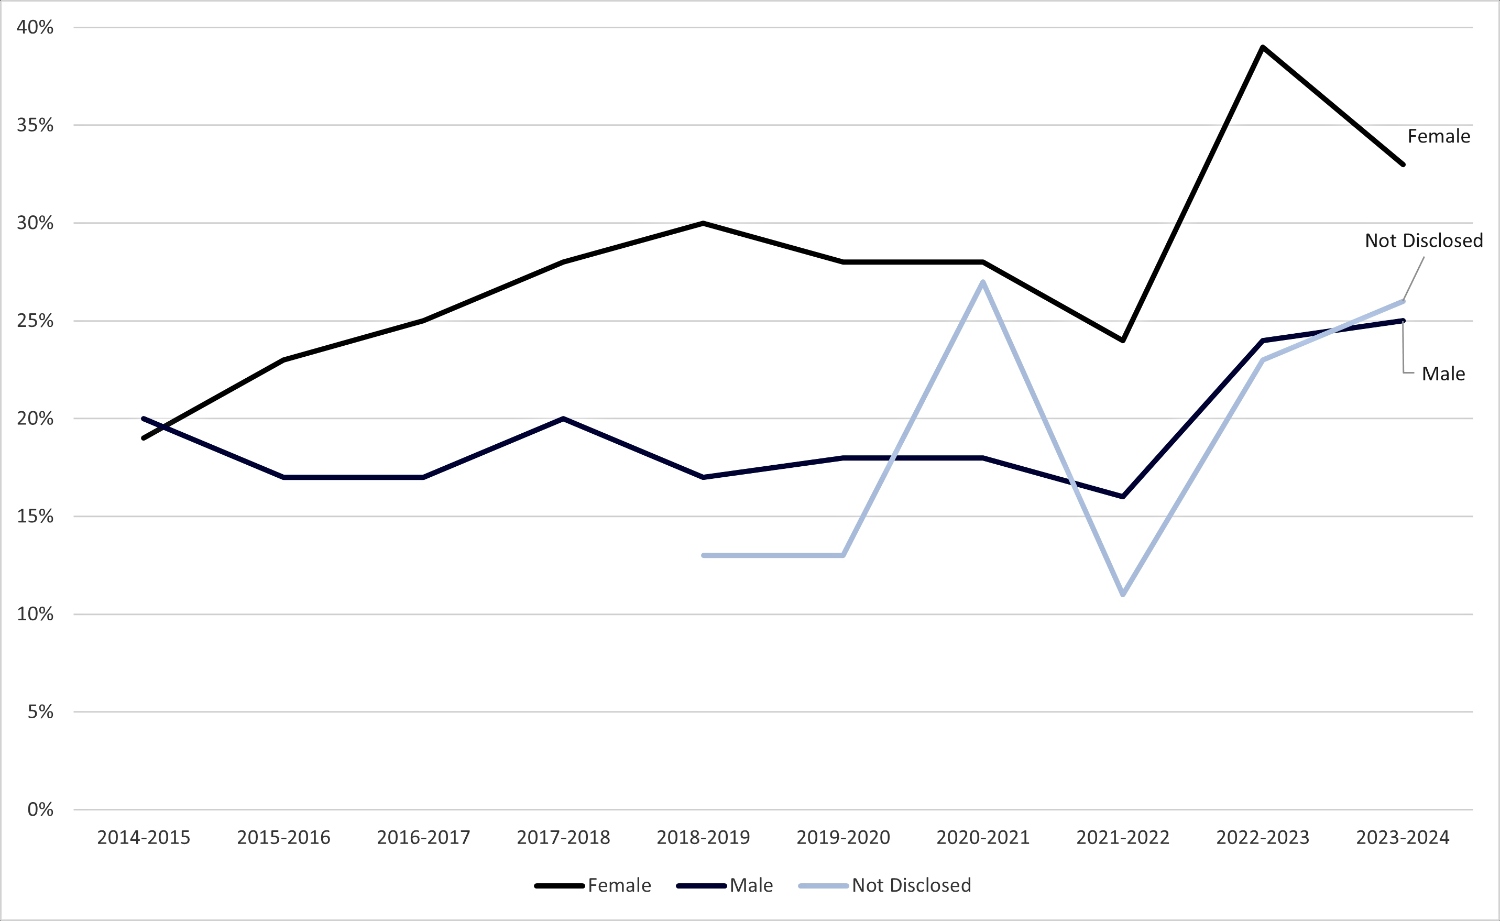
Our statistical analyses on comparing award rates between groups began in our 2021 to 2022 reporting. It has been repeated on all financial years since. Not disclosed and White ethnicities have had significantly higher award rates than Asian and Black ethnicities for all financial years since 2021 to 2022 (figure 7). Note that we cannot say whether the interactions were significant or not prior to 2021 to 2022.
Statistical significance and relationships between ethnic groups and award rates should not necessarily be interpreted as an indicator of direct bias. There are factors that are not accounted for in the statistical testing. For more details related to the statistical approach, see the technical annex.
Figure 7: UKRI award rate by ethnicity for principal investigators (Not Disclosed, White, Asian and Black only), 2014 to 2015 to 2023 to 2024
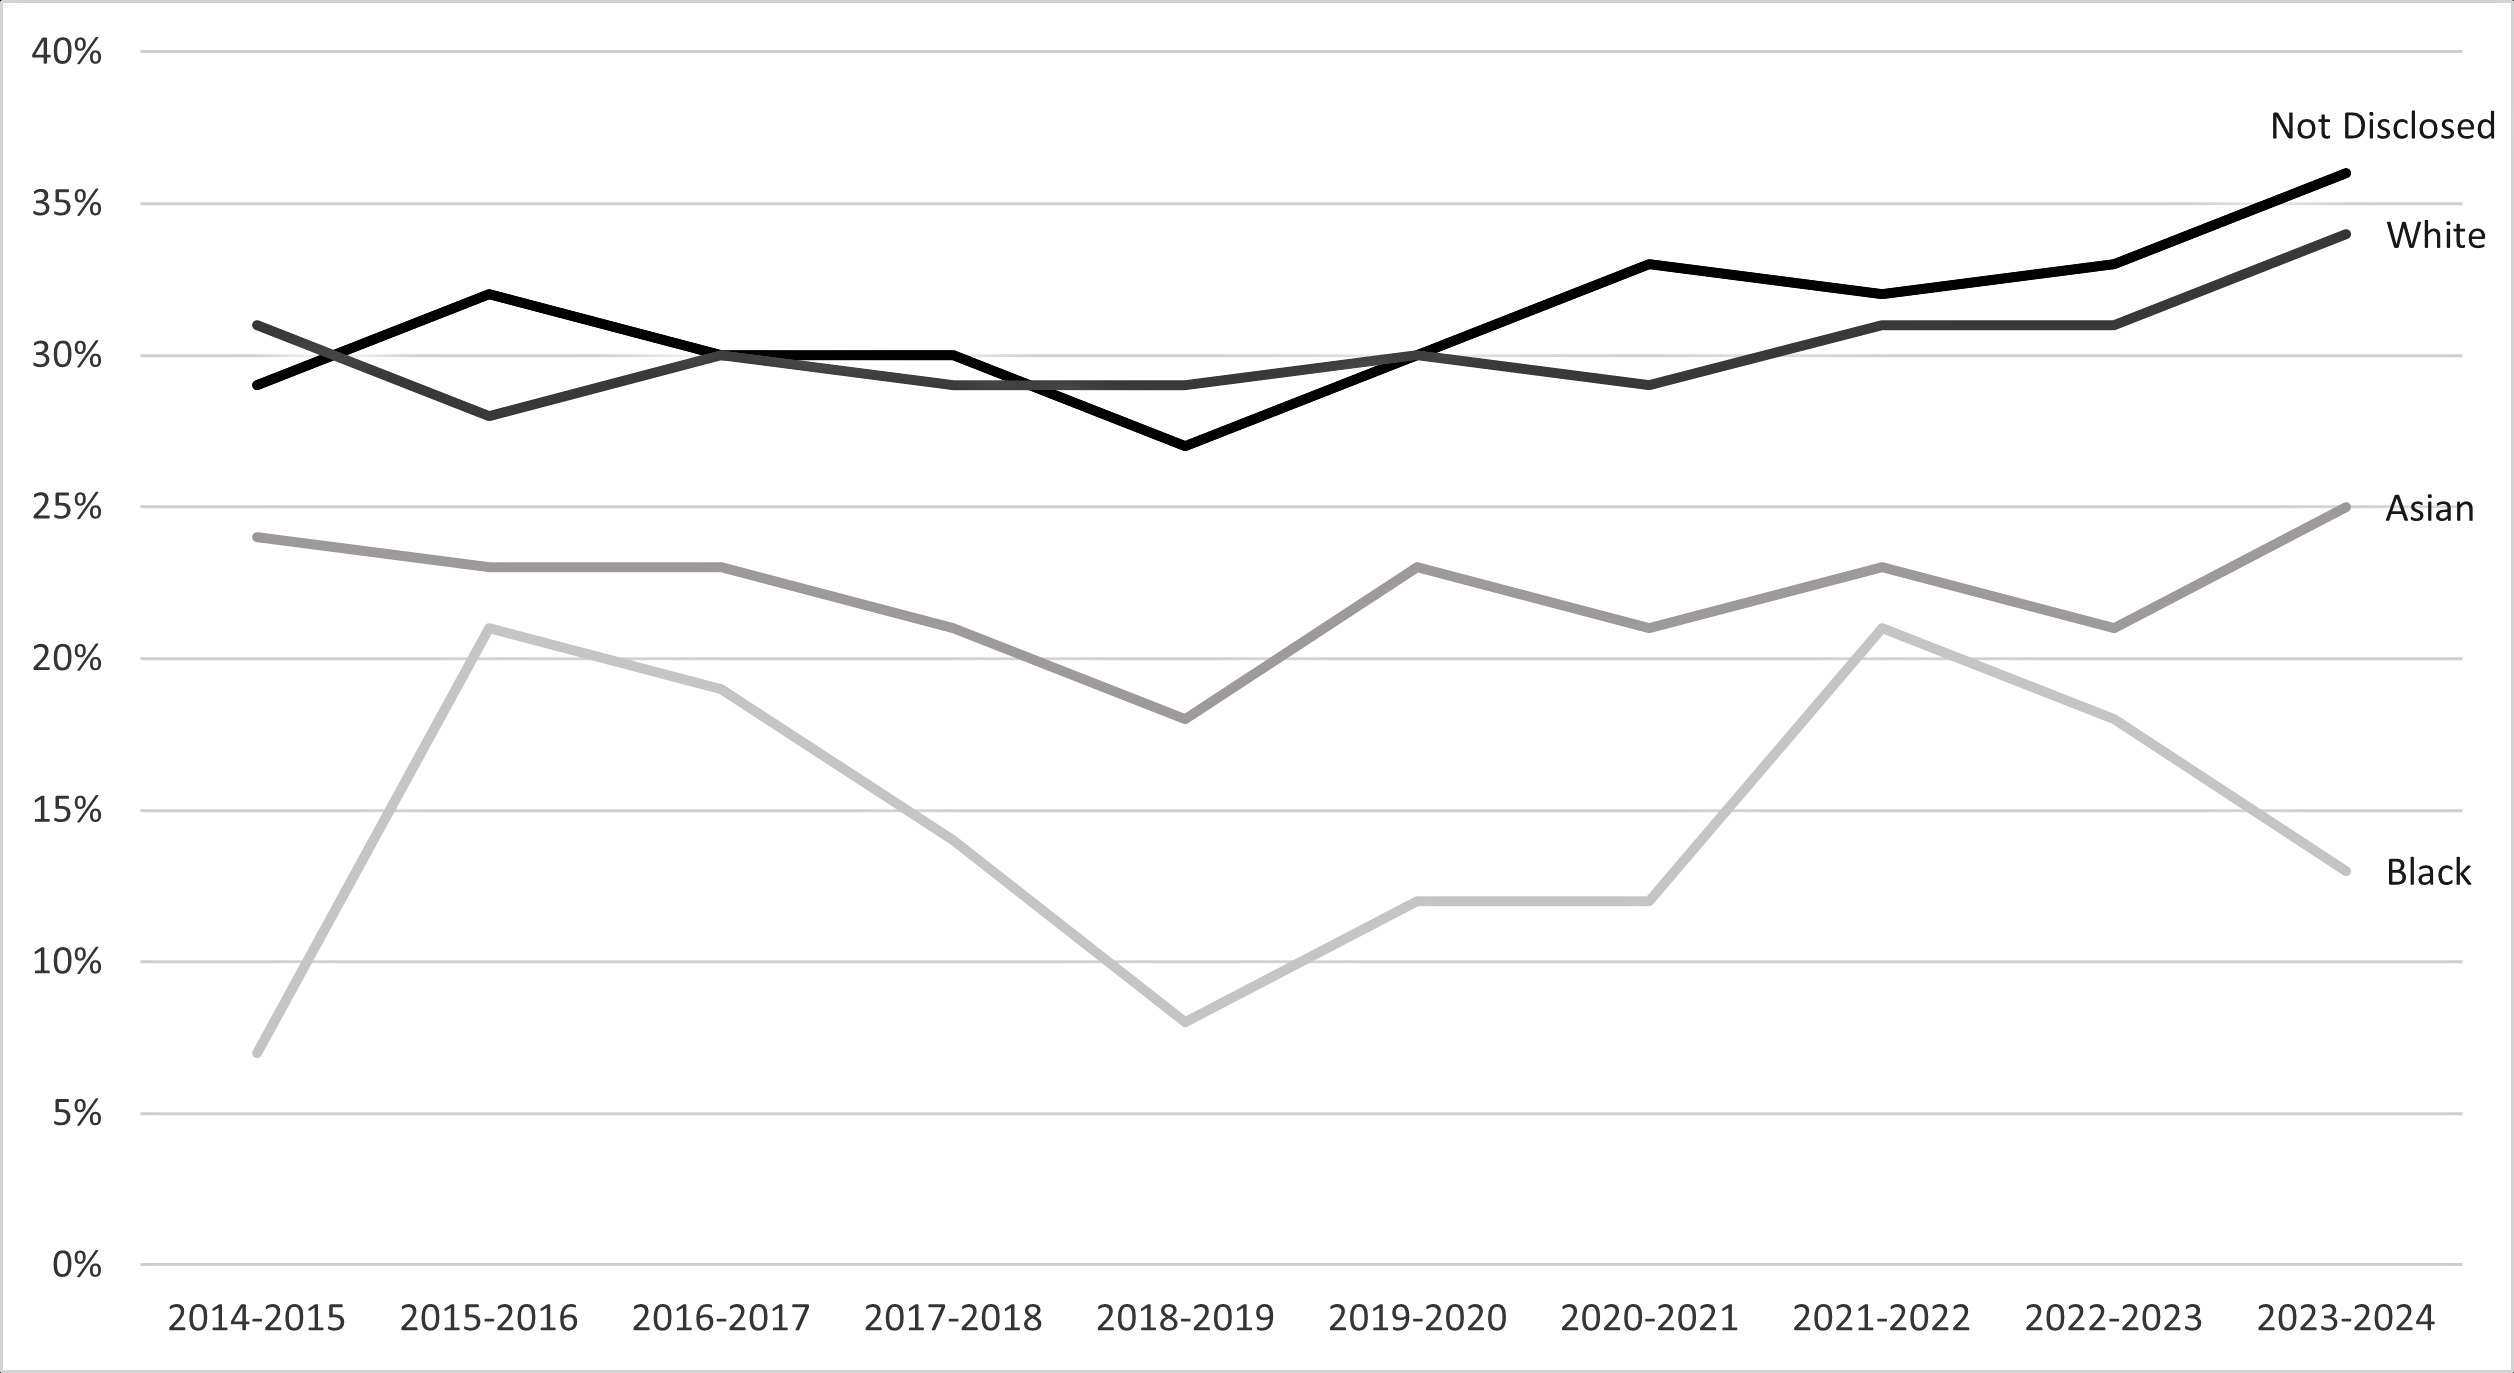
Description of figure 7: A line chart which shows the award rate for Not Disclosed and White ethnicities is higher than Asian and Black ethnicities since 2014 to 2015. Source: UKRI diversity data.
Download the data for figure 7 (ODS, 4KB)
Council award rate
For principal investigators there is high variation in award rates across different councils within each ethnic group (table 11).
For all councils, most of the principal investigator awardees were White (table 12). There were more principal investigator awardees who did not disclose their ethnicity than Black or Mixed principal investigators for all research councils.
Table 11: There is high variation in award rates across different councils within each ethnic group
| Council | Asian | Black | Mixed | Not disclosed | Other | Unknown | White |
|---|---|---|---|---|---|---|---|
| AHRC | 23% | 15% | 28% | 30% | 19% | [w] | 28% |
| BBSRC | 23% | 21% | 26% | 31% | 18% | [c] | 29% |
| EPSRC | 24% | 12% | 28% | 32% | 26% | [w] | 32% |
| ESRC | 14% | 15% | 18% | 23% | 20% | [c] | 25% |
| MRC | 21% | 11% | 24% | 20% | 15% | [c] | 25% |
| NERC | 11% | [c] | 22% | 34% | [c] | [c] | 29% |
| STFC | 61% | [c] | 60% | 74% | [c] | [w] | 70% |
| Cross-UKRI | 24% | 21% | 33% | 24% | [c] | [c] | 32% |
| UKRI overall | 22% | 14% | 27% | 33% | 21% | 20% | 31% |
Notes:
- award rate by ethnicity for principal investigators by council, cross-UKRI, and UKRI overall (five-year cumulative, 2019 to 2020 to 2023 to 2024)
- the symbol ‘[c]’ means the value has been suppressed
- the symbol ‘[w]’ is used during suppression to show values for groups where there were no awardees
Table 12: Most principal investigator awardees were White for all councils
| Council | Asian | Black | Mixed | Not disclosed | Other | Unknown | White |
|---|---|---|---|---|---|---|---|
| AHRC | 55 | 10 | 55 | 120 | 5 | 0 | 985 |
| BBSRC | 135 | 5 | 40 | 125 | 5 | [c] | 1,880 |
| EPSRC | 505 | 10 | 90 | 260 | 25 | 0 | 2,605 |
| ESRC | 70 | 15 | 35 | 70 | 10 | [c] | 940 |
| MRC | 185 | 30 | 50 | 80 | 5 | [c] | 1,330 |
| NERC | 35 | [c] | 25 | 105 | [c] | [c] | 1,175 |
| STFC | 70 | [c] | 25 | 180 | [c] | 0 | 1,210 |
| Cross-UKRI | 40 | 15 | 20 | 25 | [c] | [c] | 350 |
| UKRI overall | 1,095 | 90 | 335 | 970 | 60 | 10 | 10,510 |
Notes:
- number of awardees by ethnicity for principal investigators by council, cross-UKRI, and UKRI overall (five-year cumulative, 2019 to 2020 to 2023 to 2024)
- the symbol ‘[c]’ means the value has been suppressed
Median award amount
For UKRI overall, the median award amount varies across the ethnic groups. White principal investigators had the highest median award amount in all years except 2022 to 2023 (table 13).
Values by council are suppressed due to small numbers. It is therefore difficult to assess any contribution to these differences from the distribution of applicant ethnicity between research councils, which have very different award rates (see table 11).
Table 13: White principal investigators had the highest median award amount in all years except 2022 to 2023
| Year | Asian | Black | Mixed | Not disclosed | Other | Unknown | White |
|---|---|---|---|---|---|---|---|
| 2019-2020 | £344,000 | £161,000 | £275,000 | £338,000 | £282,000 | [c] | £367,000 |
| 2020-2021 | £381,000 | £152,000 | £300,000 | £367,000 | £283,000 | [c] | £394,000 |
| 2021-2022 | £363,000 | £189,000 | £241,000 | £344,000 | £282,000 | [c] | £381,000 |
| 2022-2023 | £397,000 | £289,000 | £240,000 | £352,000 | £350,000 | [c] | £395,000 |
| 2023-2024 | £334,000 | £439,000 | £346,000 | £364,000 | £414,000 | [c] | £448,000 |
Notes:
- median award amount for principal investigators by ethnicity. UKRI overall, yearly, from 2019 to 2020 to 2023 to 2024
- the symbol ‘[c]’ means the value has been suppressed
Gender
Applicant composition
Most applicants to UKRI funding were male in 2023 to 2024 (figure 8). 66% of principal investigators, 63% of co-investigators, 54% of researcher co-investigators and 54% of fellows were male in 2023 to 2024.
The number of applicants choosing not to disclose their gender is lower than the other characteristics, at only 1-2% across roles.
Figure 8: UKRI applicant gender by role, 2023 to 2024
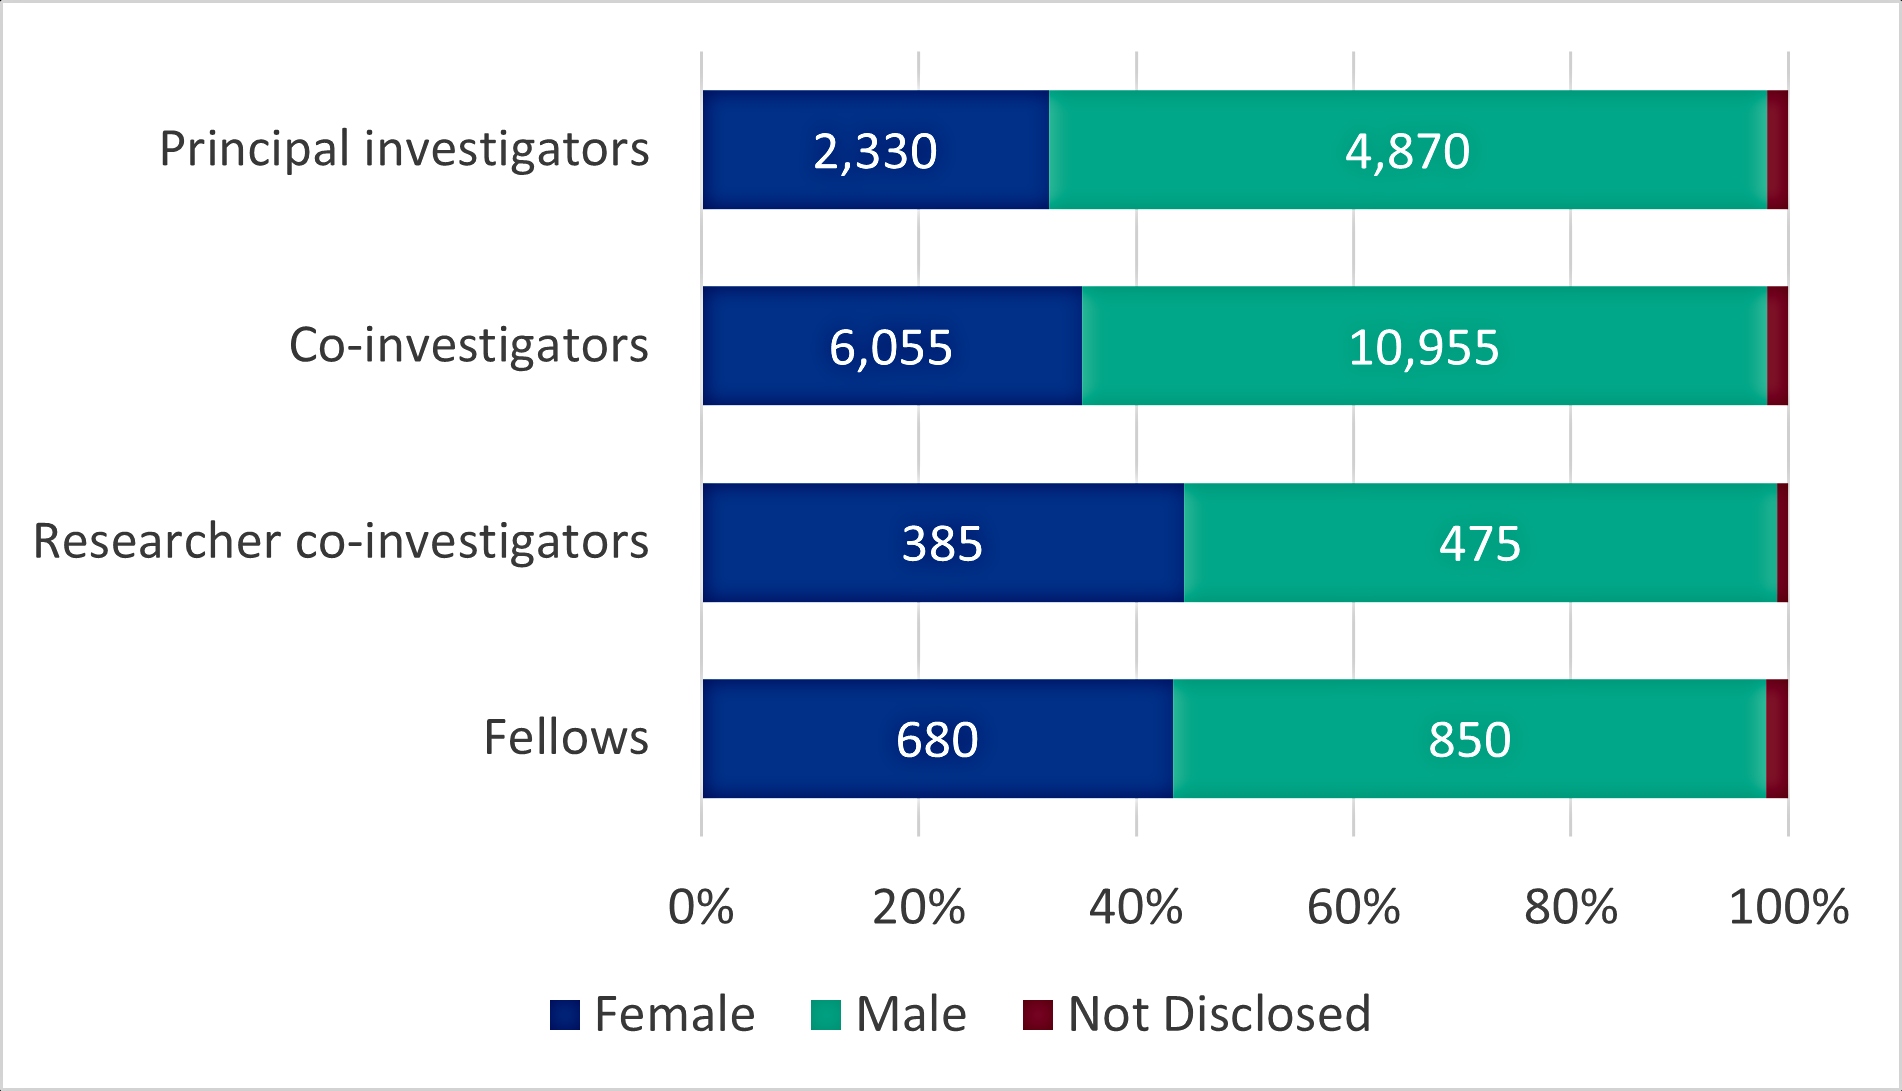
Description of figure 8: This stacked bar chart shows that there were more male applicants than female applicants in all role types (principal investigators, co-investigators, researcher co-investigators, fellows). Source: UKRI diversity data.
Download the data for figure 8 (ODS, 4KB)
Notes: Labels represent the number of applicants. Counts in groups with less than 2% of the annual role total are not labelled.
UKRI award rate
For fellows applying to UKRI in 2023 to 2024, female applicants had a significantly higher award rate than their male counterparts. Figure 9 shows the award rate by gender.
Where the difference in award rates between gender is significant according to the statistical test, this is presented in table 14. The relationship between the award rates of female and male fellows is highly significant (table 14).
Female fellows had a higher award rate than their male counterparts in all financial years since 2015 to 2016 (figure 10). Most ESRC fellow applicants are female, so their high award rates will affect this interaction, however, this is a fair representation of the application process. Female fellows had higher award rates in every council, not just ESRC. See the technical annex (in the ‘Results’ section) for interactions between other role types.
Figure 9: UKRI award rate by gender and role type, 2023 to 2024
Description of figure 9: These four bar charts show that for fellows, the award rate is higher for female awardees than male awardees. Source: UKRI diversity data.
Download the data for figure 9 (ODS, 4KB)
Notes:
- rates for groups comprising fewer than five individuals are not reported
- numbers above the bars represent the number of awardees
Table 14: For fellows applying to UKRI in 2022 to 2023 and 2023 to 2024, female applicants had a significantly higher award rate than their male counterparts
| Year | Gender 1 | Gender 2 | Recorded award rate difference | Adjusted significance |
|---|---|---|---|---|
| 2022-2023 | Male | Female | -15% | <0.01 |
| 2023-2024 | Male | Female | -18% | <0.01 |
Notes:
- significant relationships between gender award rates, based on permutation tests with a 95% range. Fellows only, 2022 to 2023 and 2023 to 2024
- the award rate difference equals category 1 minus category 2
- all values are adjusted for multiple testing (see the ‘Methodology’ section for more information)
Figure 10: UKRI award rate by gender for fellows, 2014 to 2015 to 2023 to 2024
Description of figure 10: This line chart shows that female fellows have had a higher award rate than male fellows in all financial years since 2015 to 2016. Source: UKRI diversity data.
Download the data for figure 10 (ODS, 3KB)
Notes:
- rates for groups comprising fewer than five individuals are not reported
- other rates are rounded to the nearest 1%
- rates for ‘unknown’ are suppressed
Council award rate
Looking at award rate for principal investigators by council cumulatively, female applicants had a higher chance of success than their male counterparts in AHRC (29%), EPSRC (33%), ESRC (24%) and cross-UKRI (31%; table 15).
Female fellows had a higher award rate than males in every council as well as UKRI overall (28%; table 16).
Table 15: Female principal investigator applicants had higher award rates than their male counterparts in AHRC, EPSRC, ESRC and cross-UKRI
| Council | Female | Male | Not Disclosed | Unknown |
|---|---|---|---|---|
| AHRC | 29% | 26% | 27% | [w] |
| BBSRC | 26% | 29% | 23% | [c] |
| EPSRC | 33% | 30% | 36% | [c] |
| ESRC | 24% | 23% | 32% | [c] |
| MRC | 24% | 24% | 31% | [c] |
| NERC | 27% | 28% | 26% | [c] |
| STFC | 70% | 70% | 66% | [w] |
| Cross-UKRI | 31% | 30% | 33% | [c] |
| UKRI overall | 28% | 30% | 32% | 21% |
Notes:
- award rate by gender for principal investigators by council, cross-UKRI, and UKRI overall (five-year cumulative, 2019 to 2020 to 2023 to 2024)
- the symbol ‘[c]’ means the value has been suppressed
- the symbol ‘[w]’ is used during suppression to show values for groups where there were no awardees
Table 16: Female fellows had a higher award rate than males in every council as well as UKRI overall
| Council | Female | Male | Not Disclosed | Unknown |
|---|---|---|---|---|
| AHRC | 34% | 29% | [c] | 0% |
| BBSRC | 15% | 11% | [c] | 0% |
| EPSRC | 29% | 17% | 27% | [c] |
| ESRC | 70% | 58% | 50% | 100% |
| MRC | 25% | 23% | 17% | [c] |
| NERC | 12% | 10% | [c] | [c] |
| STFC | 11% | 7% | [w] | [c] |
| Cross-UKRI | 18% | 15% | 15% | [w] |
| UKRI overall | 30% | 19% | 19% | 50% |
Notes:
- award rate by gender for fellows by council, cross-UKRI, and UKRI overall (five-year cumulative, 2019 to 2020 to 2023 to 2024)
- the symbol ‘[c]’ means the value has been suppressed
- the symbol ‘[w]’ is used during suppression to show values for groups where there were no awardees
- where award rate is 0, there were no applicants or awardees
Median award amount
For principal investigators, the median award amount and award rate by value for male applicants was higher than female applicants for all years since 2019 to 2020 (table 17).
The median award amount for male fellows was over three times more than female fellows in 2020 to 2021 and over twice more in 2021 to 2022 (table 18).
Table 17: The median award amount for male applicants was higher than female applicants for all years
| Year | Female | Male | Not disclosed | Unknown |
|---|---|---|---|---|
| 2019-2020 | £265,000 | £391,000 | £306,000 | [c] |
| 2020-2021 | £310,000 | £405,000 | £266,000 | [c] |
| 2021-2022 | £290,000 | £400,000 | £227,000 | [c] |
| 2022-2023 | £319,000 | £404,000 | £336,000 | [c] |
| 2023-2024 | £426,000 | £439,000 | £270,000 | [c] |
Notes:
- median award amount for principal investigators by gender. UKRI overall, yearly, from 2019 to 2020 to 2023 to 2024
- the symbol ‘[c]’ means the value has been suppressed
- the symbol ‘[w]’ is used during suppression to show values for groups where there were no awardees
Table 18: The median award amount for male fellows was higher than for female fellows for all years
| Year | Female | Male | Not disclosed | Unknown |
|---|---|---|---|---|
| 2019-2020 | £294,000 | £473,000 | £483,000 | [c] |
| 2020-2021 | £225,000 | £877,000 | £737,000 | [w] |
| 2021-2022 | £251,000 | £520,000 | £657,000 | [c] |
| 2022-2023 | £242,000 | £470,000 | £554,000 | [c] |
| 2023-2024 | £206,000 | £592,000 | £279,000 | [c] |
Notes:
- median award amount for fellows by gender. UKRI overall, yearly, from 2019 to 2020 to 2023 to 2024
- the symbol ‘[c]’ means the value has been suppressed
- the symbol ‘[w]’ is used during suppression to show values for groups where there were no awardees
Intersectionality
The four characteristics we cover in this report, along with other factors such as socioeconomic background and the protected characteristics that we do not currently report on, can intersect.
In instances where intersectionality per financial year produces very small numbers, we present intersectionality as a five-year cumulative to avoid suppression.
Even so, in some instances, intersectionality of some characteristics as a five-year cumulative, like female fellows with a disability, or fellows over the age of 60, can create very small numbers. In these instances, very small fluctuations in numbers result in large fluctuations in percentages.
Unknown and non-disclosed genders are not displayed on intersectionality figures, for easier comprehension.
See the data tables or Tableau dashboard for unknown and non-disclosed figures.
Intersectionality of age with gender
Cumulatively, over the five years from 2019 to 2020 to 2023 to 2024, female fellows under the age of 29 have a higher award rate than the other age groups, although most awardees were male in the 30-39 age group (figure 11).
The ESRC postdoctoral fellowships are likely to impact the award rate, as over 70% of total female awardees under the age of 29 are from ESRC, with a cumulative award rate of 91%.
Figure 11: award rate by age group and gender (excluding unknown and non-disclosed genders and ages) for fellows (five-year cumulative)
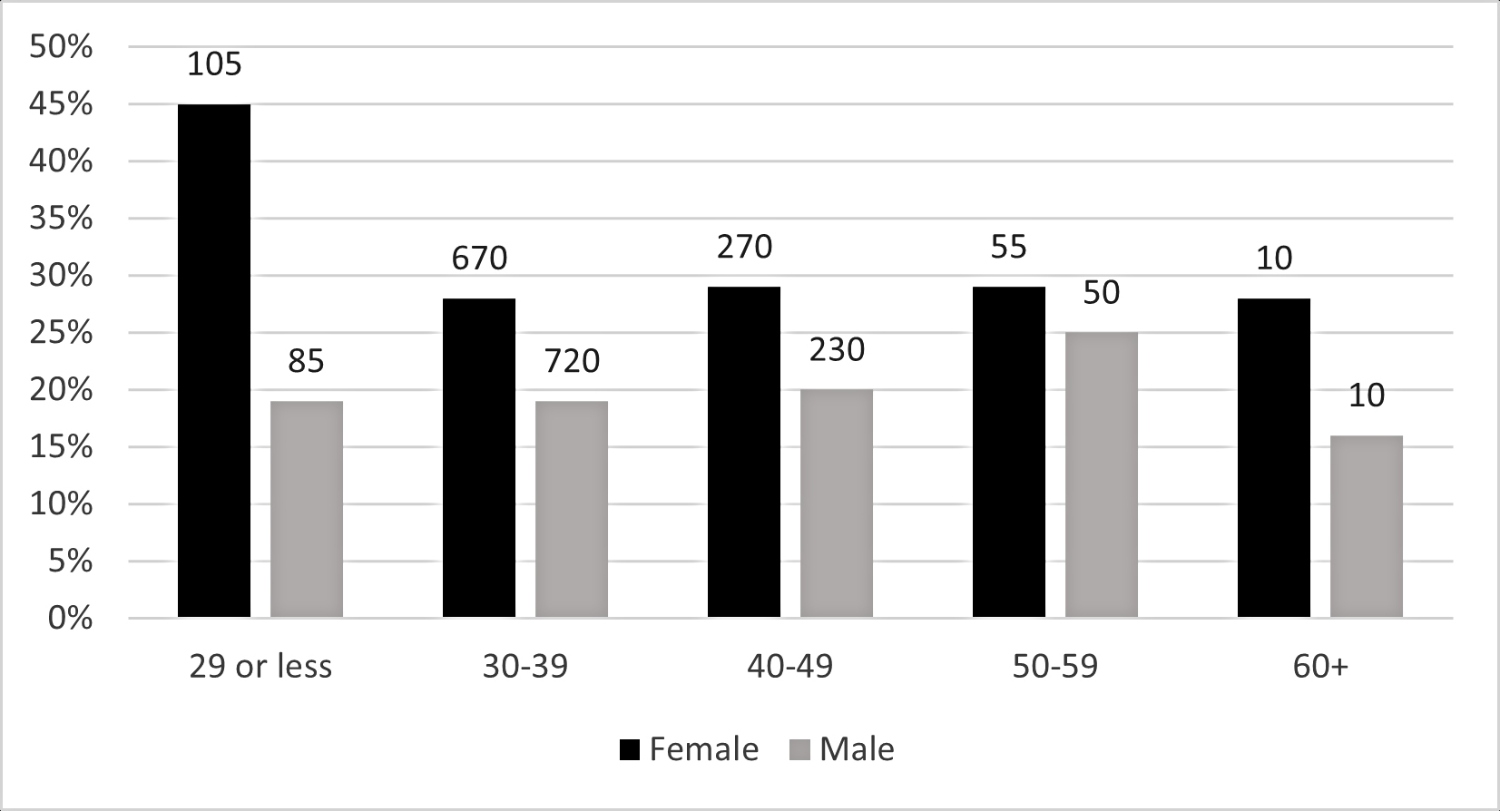
Description of figure 11: This bar chart shows that the award rate for female fellows in the 29-or-less age category is much higher than male fellows in the same age category, and both male and female fellows in all other age categories. Source: UKRI diversity data.
Download the data for figure 11 (ODS, 3KB)
Notes:
- rates for groups comprising fewer than five individuals are not reported
- numbers above the bars represent the number of awardees
Intersectionality of ethnic group with gender
Cumulatively, for principal investigators, White male applicants received over half of awards, at 55%. For fellows, White female applicants received 39% of the awards, and White male applicants 37%.
Since 2014 to 2015, principal investigators have had the lowest proportion of female minority ethnic (excluding White minorities) awardees when compared to the other role types (table 19).
Table 19: fellows generally have a higher proportion of minority ethnic (excluding White minorities)
| Year | Principal investigators | Co-investigators | Researcher co-investigators | Fellows |
|---|---|---|---|---|
| 2014-2015 | 2% | 3% | 3% | 4% |
| 2015-2016 | 3% | 4% | 6% | 4% |
| 2016-2017 | 2% | 4% | 3% | 8% |
| 2017-2018 | 2% | 5% | 6% | 8% |
| 2018-2019 | 2% | 6% | 3% | 8% |
| 2019-2020 | 4% | 6% | 4% | 8% |
| 2020-2021 | 2% | 6% | 3% | 7% |
| 2021-2022 | 4% | 5% | 7% | 9% |
| 2022-2023 | 4% | 4% | 6% | 9% |
| 2023-2024 | 5% | 6% | 10% | 11% |
| Five-year cumulative | 4% | 5% | 6% | 9% |
Note: UKRI overall proportion of female minority ethnic (excluding White minorities) awardees for principal investigators, co-investigators, researcher co-investigators and fellows. From the 2012 to 2015 financial year to the 2023 to 2024 financial year, and five year cumulative.
Intersectionality of disability with gender
For the five years to 2023 to 2024, 1% of female and 1% of male principal investigator awardees were disabled. This is lower than the 4% of male principal investigator awardees and 2% of female principal investigator awardees who chose not to share their disability status.
In the five years to 2023 to 2024, disabled and non-disabled female principal investigators had the same award rate: 28% (figure 12). Male principal investigators reporting no disability had a higher award rate than male principal investigators reporting a disability. Male applicants also had a higher award rate than female awardees, regardless of disability status (figure 12).
Figure 12: award rate by disability status and gender for principal investigators (five-year cumulative)
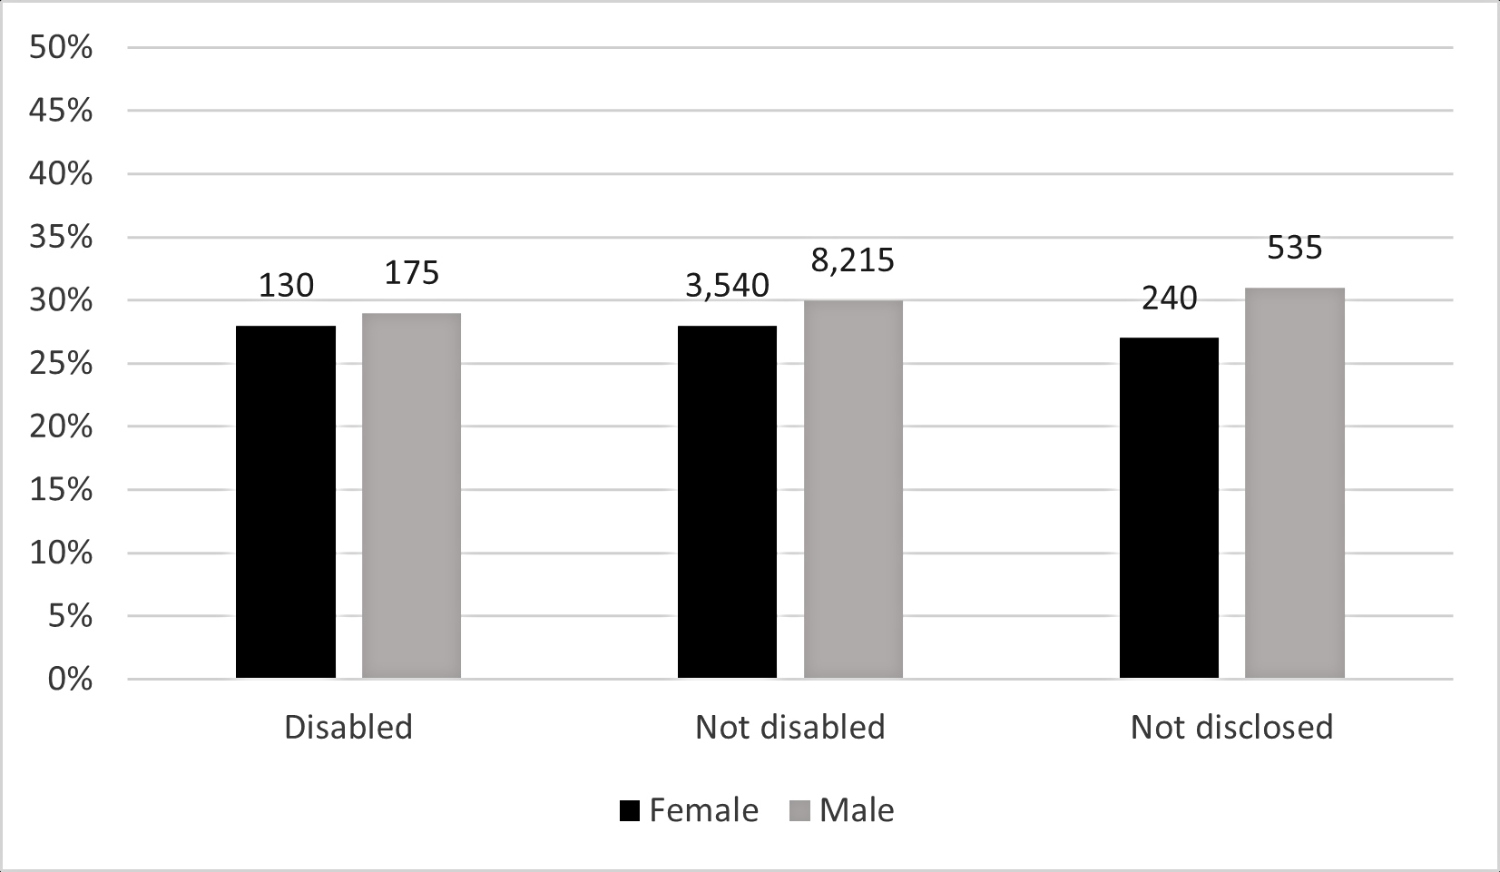
Description of figure 12: This bar chart shows that the award rate for male principal investigators is higher than female principal investigators for both those who declared a disability, and those who did not. Source: UKRI diversity data.
Download the data for figure 12 (ODS, 3KB)
Notes:
- rates for groups comprising fewer than five individuals are not reported
- numbers above the bars represent the number of awardees
Panel members
This report introduces, for the first time, exploratory high-level data on the composition of UKRI’s peer review panels. A peer review panel is group of individuals who review the relative quality of research proposals competing for funding. The review panels are responsible for placing the proposals in a funding priority order. From this list, the final decision is made on funding. The methods for inviting and recording panel members differs across research councils, resulting in data not readily comparable by council.
We present data for UKRI overall. There are larger proportions of unknown data than we have in our applicant and awardee data. This is because where a panel member does not already have a Joint Electronic Submission (Je-S) account, one is assigned to them, and all characteristics are filled out as ‘unknown’. It is then not mandatory for the panel members to update it. This group represents around 7% of panel members.
Age
In 2023 to 2024, 35% of panel members are aged 50 to 59 (figure 13). This represents a slightly older composition compared to our applicant and awardee data, in which most principal and co-investigators are aged 40 to 49.
Figure 13: UKRI grant panel members composition by age, 2023 to 2024
Description of figure 13: These four stacked bar charts show the highest proportion of panel members are aged 50 to 59. Source: UKRI diversity data.
Download the data for figure 13 (ODS, 3KB)
Notes:
- labels represent the number of applicants
- counts in groups with less than 2% of the annual role total are not labelled
Disability
In 2023 to 2024, 2% of panel members were disabled. This is less than 6% of panel members who chose not to disclose their disability status (figure 14).
Figure 14: UKRI grant panel members composition by disability, 2023 to 2024
Description of figure 14: these four stacked bar charts show the highest proportion of panel members are not disabled. Source: UKRI diversity data.
Download the data for figure 14 (ODS, 3KB)
Notes:
- labels represent the number of applicants
- counts in groups with less than 2% of the annual role total are not labelled
Ethnicity
73% of panel members were White in 2023 to 2024. The highest proportion of minority ethnic (excluding White minorities) panel members was in the Asian ethnic group (9%, figure 15).
Figure 15: UKRI grant panel members composition by ethnicity, 2023 to 2024
Description of figure 15: these four stacked bar charts show the highest proportion of panel members are White. Source: UKRI diversity data.
Download the data for figure 15 (ODS, 3KB)
Notes:
- labels represent the number of applicants
- counts in groups with less than 2% of the annual role total are not labelled
Gender
56% of panel members were male in 2023 to 2024 (figure 16). This compares with 66% of principal investigators and 63% of co-investigator applications in the same year.
Figure 16: UKRI grant panel members composition by gender, 2023 to 2024
Description of figure 16: these four stacked bar charts show the highest proportion of panel members are male. Source: UKRI diversity data.
Download the data for figure 16 (ODS, 3KB)
Notes:
- labels represent the number of applicants
- counts in groups with less than 2% of the annual role total are not labelled
Studentships
Results for studentships are discussed separately from the other role types, as the source data differs from the data that is used for UKRI’s research grants and fellowships, and the mechanism for funding is different (see annex for more details). As a result, UKRI does not publish data on application and award rates for studentship starts. Instead, the findings below focus on the distribution of awards as reported by holders of our PhD training grants.
As mentioned in the introduction, comparisons to the Higher Education Statistics Agency (HESA) student data were included in this section of our 2021 to 2022 report, however, the discrepancies in reporting windows mean that HESA data for 2023 to 2024 was not available when this report was written, so we cannot provide benchmarks in this report.
In the 2023 to 2024 financial year 5,165 new studentship starts were reported with UKRI funding. The number of studentship starts across research councils varied greatly (table 20). EPSRC had 43% of all new studentships starts, while the share ranges from 13% to 6% for all other councils.
Table 20: Most new studentship starts in 2023 to 2024 were at EPSRC
| Council | Number of awards | Proportion of studentship starts |
|---|---|---|
| AHRC | 520 | 10% |
| BBSRC | 560 | 11% |
| EPSRC | 2,230 | 43% |
| ESRC | 695 | 13% |
| MRC | 380 | 7% |
| NERC | 490 | 9% |
| STFC | 285 | 6% |
| Total UKRI | 5,165 | 100% |
Notes: The number and proportion of studentship starts by council, and UKRI overall, in 2023 to 2024.
Age
In 2023 to 2024, for all councils, most students were in the 29-or-less age category. The proportion ranged from 93% of students at STFC to 50% of students at AHRC.
Disability
The proportion of students with a reported disability has been increasing since 2014 to 2015 (figure 17).
In 2023 to 2024, the proportion of disabled students receiving UKRI funding varied from 15% AHRC (80 studentships) to 8% at EPSRC and BBSRC (175 and 45 studentships, respectively), with 10% of students declaring a disability at aggregated UKRI level (500 studentships).
Figure 17: The percentage of UKRI students reporting a known disability by year from 2014 to 2015, to 2023 to 2024
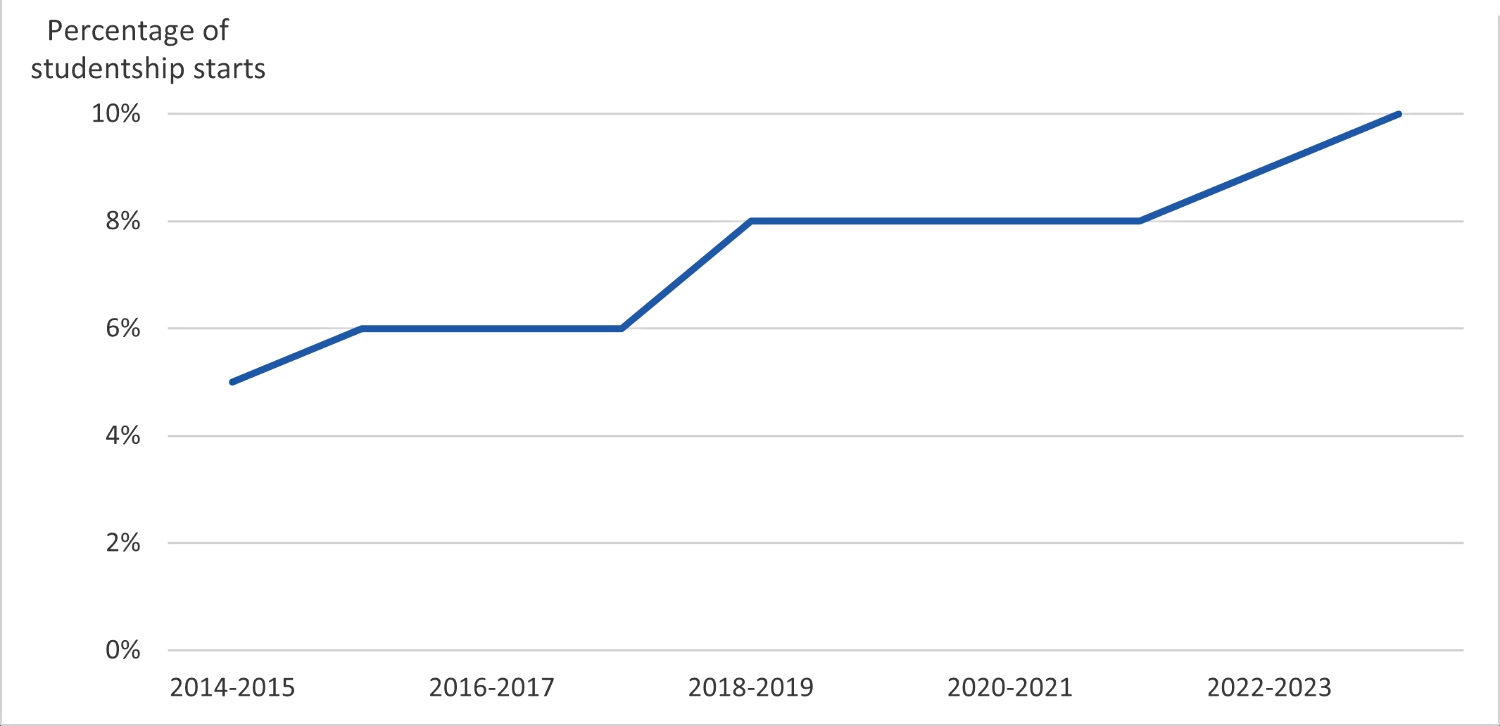
Description of figure 17: This line chart shows that the proportion of students declaring a disability increased in the years since 2014 to 2015. Source: UKRI diversity data.
Download the data for figure 17 (ODS, 3KB)
Notes:
- rates for groups comprising fewer than five individuals are not reported
- percentages are rounded to the nearest 1%
Ethnicity
The percentage of studentship starts whose ethnicity was not disclosed or unknown has been consistently high since 2014 to 2015. In 2023 to 2024 ethnicity was not disclosed for 26% of studentship starts, and unknown for another 9%, so our understanding of ethnicity for studentships is partial (table 21).
After the White ethnic group, excluding non-disclosed and unknown, the highest proportion of studentship starts in 2023 to 2024 were from the Asian ethnic group for all councils (table 21).
Table 21: There were high levels of ethnicity non-disclosure for studentship starts in 2023 to 2024 across all councils
| Council | Asian | Black | Mixed | Not Disclosed | Other | Unknown | White |
|---|---|---|---|---|---|---|---|
| AHRC | 7% | 1% | 5% | 30% | 1% | 10% | 45% |
| BBSRC | 10% | 3% | 3% | 21% | [c] | 12% | 50% |
| EPSRC | 14% | 2% | 3% | 29% | 1% | 7% | 43% |
| ESRC | 10% | 5% | 5% | 29% | 1% | 9% | 41% |
| MRC | 12% | 3% | 3% | 18% | [c] | 12% | 50% |
| NERC | 9% | 2% | 4% | 13% | [c] | 10% | 60% |
| STFC | 13% | [c] | 2% | 32% | [c] | 7% | 46% |
| UKRI overall | 12% | 2% | 4% | 26% | 1% | 9% | 46% |
Notes:
- the percentage of studentship starts in each ethnic group, by research council, and aggregated for UKRI overall (2023 to 2024)
- rates for groups comprising fewer than five individuals are not reported
- the symbol ‘[c]’ means the value has been suppressed
Gender
The percentage of studentship starts reporting their gender as female has increased from 40% in 2014 to 2015 to 47% in 2023 to 2024.
Intersectionality with gender
We include data on the intersection of age, disability, and ethnicity with gender for studentship starts. As intersectionality per financial year produces very small numbers which are likely to be suppressed, we present intersectionality as a five-year cumulative.
In the five years to 2023 to 2024, for UKRI overall, 44% of studentship starts are males under the age of 29 (figure 18), 27% of studentships starts are White males (figure 19), and 47% of studentship starts are males without a declared disability (figure 20).
Figure 18: percentage of studentship starts by age group and gender, UKRI, five-year cumulative (excluding unknown and non-disclosed gender)
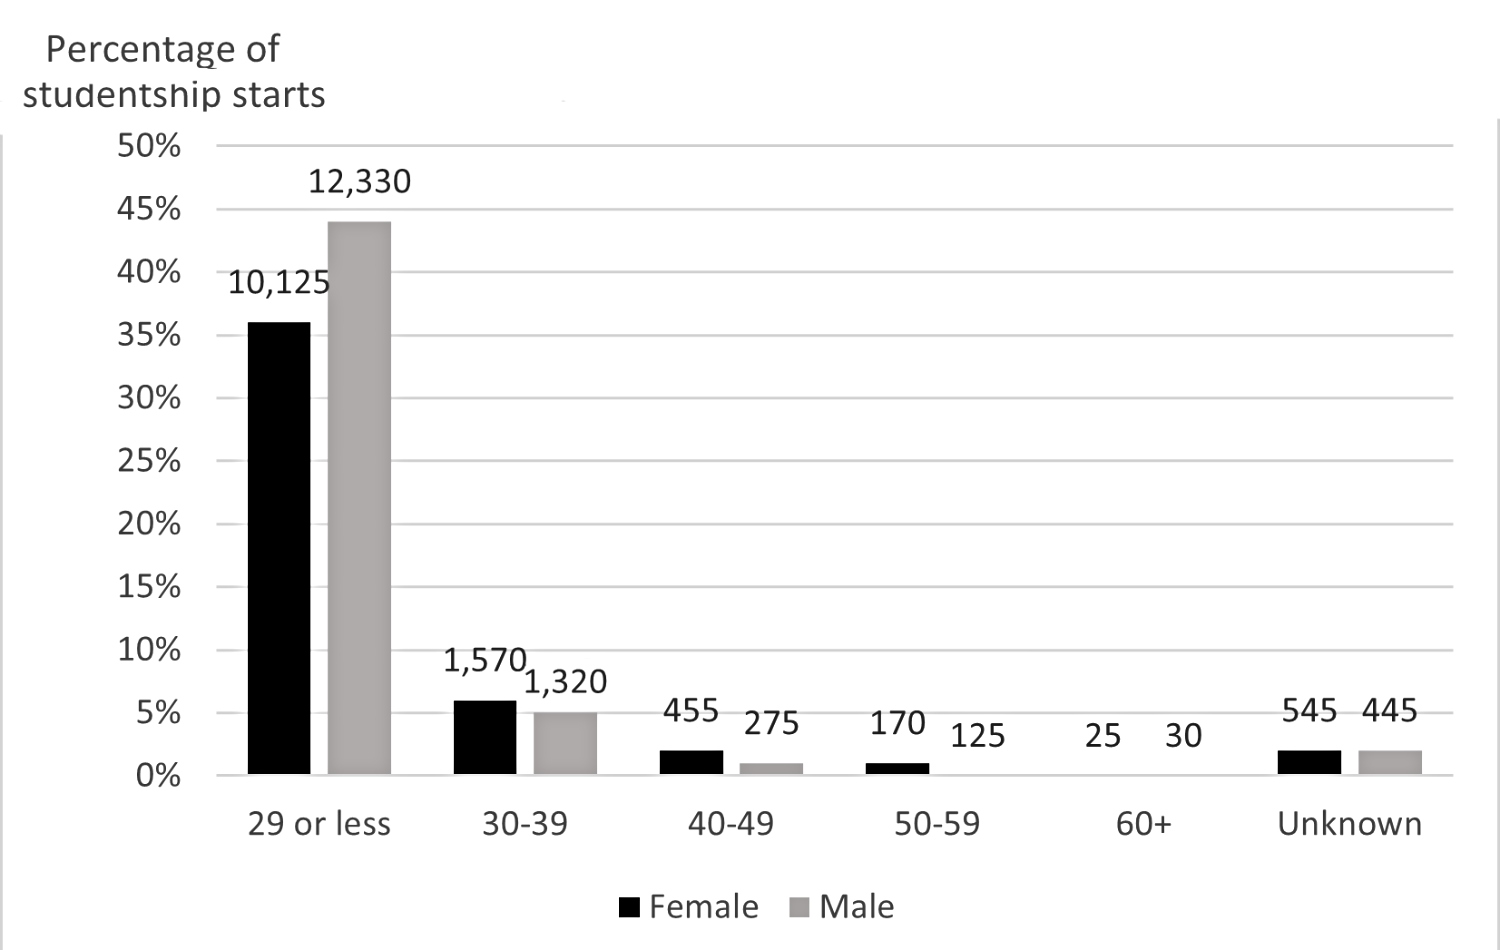
Description of figure 18: This bar chart shows that the largest proportion of students are males in the 29-or-less category. Source: UKRI diversity data.
Download the data for figure 18 (ODS, 3KB)
Notes: numbers above the bars represent the number of students.
Figure 19: percentage of studentship starts by ethnic group and gender, UKRI, five-year cumulative (excluding unknown and non-disclosed gender)
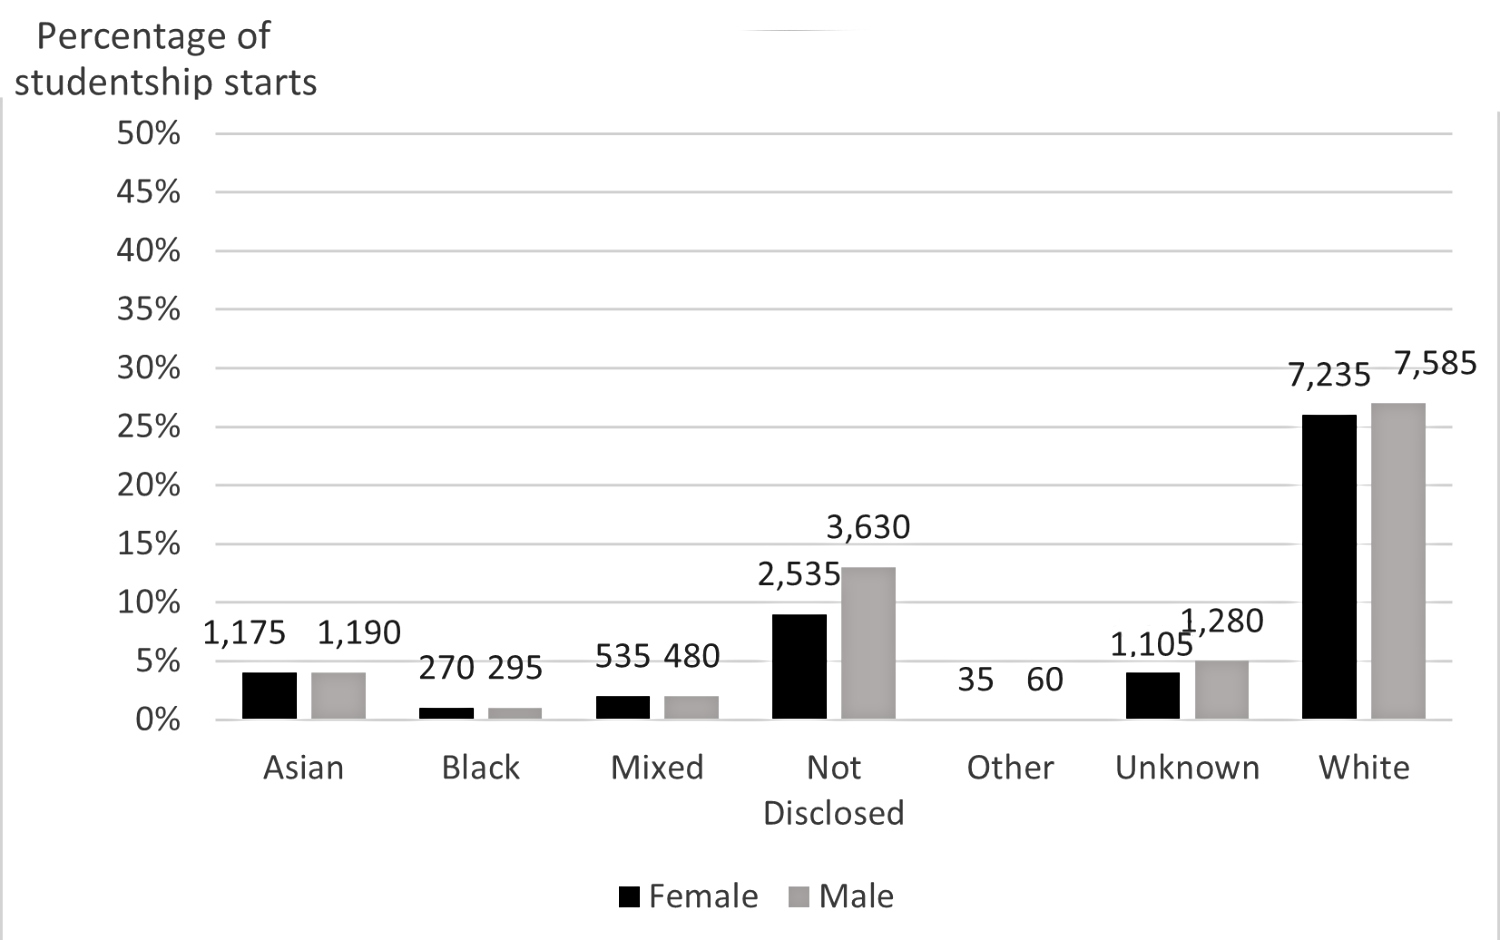
Description of figure 19: This bar chart shows that the largest proportion of students are White males, and that a large proportion of students choose not to disclose their ethnicity. Source: UKRI diversity data.
Download the data for figure 19 (ODS, 4KB)
Notes: numbers above the bars represent the number of students.
Figure 20: percentage of studentship starts by disability status and gender, UKRI, five-year cumulative (excluding unknown and non-disclosed gender)
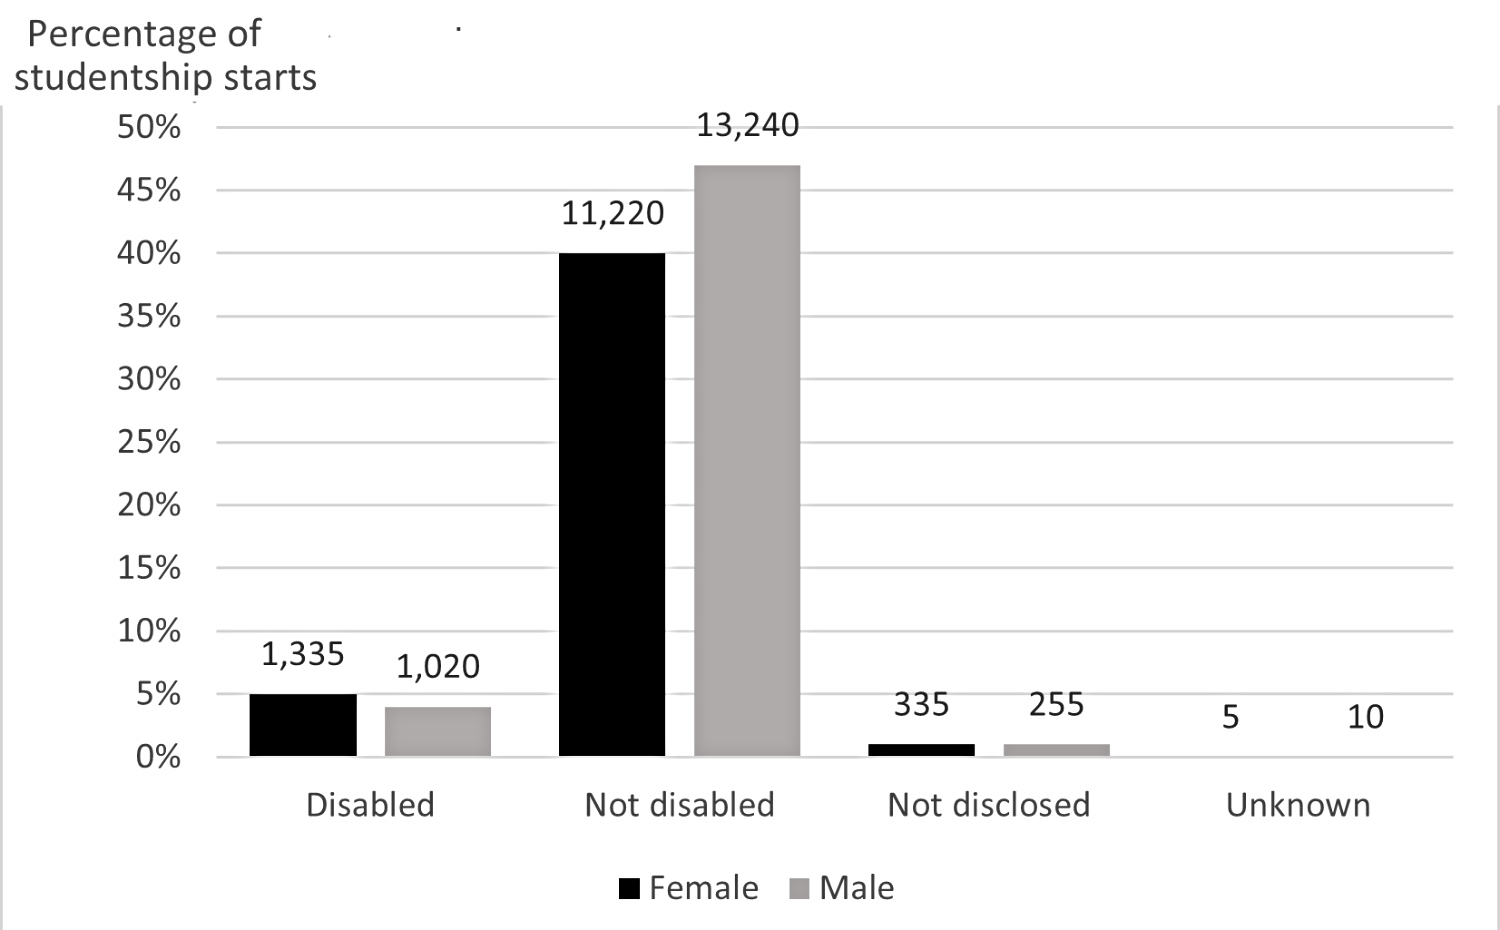
Description of figure 20: This bar chart shows that the largest proportion of students are males who did not have a disability. Source: UKRI diversity data.
Download the data for figure 20 (ODS, 3KB)
Notes: numbers above the bars represent the number of students.
Technical annex
Rounding and suppression
Results for groups with between one and four individuals are suppressed. Counts of five or more are rounded to the nearest multiple of five. Counts of 0 are shown.
Proportions and award rates are calculated based on unrounded numbers and rounded to the nearest 1%.
Award values are rounded to the nearest £1,000.
Guidance on interpreting data
Our analysis is based on applications, not unique applicants. An applicant can submit multiple applications in the same year and be counted more than once.
Applications are grouped into financial years based on when a funding decision was made and not when the application was made.
Fellowships with multiple fellows and research grants with multiple principal investigators are excluded from the data as identifying the original recipient is not possible.
For studentship funding, ethnicity data is not disclosed for approximately 30% of awardees in all years. Without further analysis of the data, the extent of unknown data limits the strength of the conclusions that can be drawn about the ethnicity profile of studentship starts.
Panel members are counted per meeting. A panel member can attend multiple meetings in the same year and be counted more than once.
Diversity characteristics
The Joint Electronic Submission (Je-S) system gathers data on four protected characteristics: age, disability, ethnicity and gender. Description of variables and modification below describes how the data is collected and presented.
Applications to most funding opportunities are now hosted on our new UKRI Funding Service. The Funding Service collects all nine protected characteristics for the project lead throughout the application process. The Funding Service is being built iteratively, gradually introducing functionality. UKRI is committed to expanding its data collection and analysis capabilities on our funding applicants and recipients.
We have made changes to encourage all applicants, reviewers and panel members to complete their diversity profile.
Applicants, reviewers and panellists using the Funding Service may notice that when they next log onto the service they are asked to complete their diversity Profile. We have also updated the guidance to help users when answering the questions.
Where the numbers within ethnicity categories are small, we aggregate ethnicities into Asian, Black, Mixed, Other and White ethnic groups following the Government Statistical Service harmonised ethnicity standard.
We recognise that aggregation of data in this way can mask the experiences of individual groups, but this is as granular as we are able to present the data without risking disclosure of information or the robustness of conclusions.
Description of variables and modification
Age
For applicants, this is based on date of birth and date of decision. For panel members, this is based on date of birth and meeting date.
Results are presented as:
- 29 or lower
- 30 to 39
- 40 to 49
- 50 to 59
- 60 plus
- unknown
Disability
The following options are presented to applicants:
- an unseen disability
- autistic spectrum disorder
- blind or partially sighted
- Deaf or hearing impairment
- dyslexia
- mental health difficulties
- wheelchair user or mobility difficulties
- multiple disabilities
- a disability not listed above
- no known disability
- not disclosed
- unknown
Results are presented by disability status:
- known disability
- no known disability
- not disclosed
- unknown
Ethnicity
How ethnicities are presented (with the options in brackets):
- Asian (Bangladeshi, Chinese, Indian, Pakistani, any other Asian background)
- Black (African, Caribbean, any other Black/African/Caribbean background)
- Mixed (White and Asian, White, and Black African, White and Black Caribbean, any other Mixed or multiple ethnic background)
- Other
- White (White British, White Irish, any other White background)
- unknown
- not disclosed
Gender
The options were male, female or not disclosed.
The current Funding Service asks applicants to provide information on gender with male, female or not disclosed as response options. For this reason, we use the terminology male and female to describe gender categories throughout this document.
We realise this is not in alignment with data reporting categories for equality monitoring data, and that gender and sex terminology is more nuanced and highly personal. We have reflected this in data collection through the new funding system.
Not disclosed and unknown
‘Not disclosed’ refers to when respondents have consciously chosen to not disclose their personal information and selected the ‘not disclosed’ option.
‘Unknown’ is where individuals have not provided their details and therefore, we have no usable information.
Data sources and limitations
Research grants and fellowships (principal investigators, co-investigators, fellows)
Time period: 2014 to 2015, to 2023 to 2024.
Awardees are grouped into financial year based on the date on which UKRI decided on the application, not the date the application was submitted.
Data source: source data used is the same as the competitive funding decision data used in UKRI’s annual reports, but with Innovate UK and Research England applications and awards removed.
Sources included are:
- the Joint Electronic Submissions System (Je-S) for the research councils
- additional funding decisions captured outside of Je-S such as rapid response funding (including ‘UKRI response to COVID’), opportunities administered by funders outside of UKRI and grants awarded to MRC institutes, units and centres
Note that grants where we cannot link to person-level data are removed from the dataset (less than 1% of grants).
Panel members
Time period: 2019 to 2020, to 2023 to 2024.
For a meeting to be assigned to a particular financial year, the meeting start date is after 1 April of that year, and before 1 April the following year. Age is calculated as age on the meeting date. Only members and chairs of meetings are included.
Studentship starts
Time period: 2014 to 2015, to 2023 to 2024.
Student starts are based on the first financial year that the studentship award was active, a time stamp that typically represents a student’s intake year.
Data source: Individual studentship information submitted by research organisations to research councils via the cross-council Je-S studentship detail functionality.
Funding for studentships is mainly provided to research organisations as a block grant. They then select candidates for specific studentship projects or fund an independent project proposal.
Limitations: UKRI does not collect equality, diversity and inclusion data for studentships through the application process. Instead, it is provided by the research organisation through the Je-S studentship detail functionality.
Data provided in this way only covers studentship starts and does not include application data. Data is provided to UKRI annually through a summary annual report completed by each research organisation.
However, inconsistencies between organisations in the way that this data is collected and provided to UKRI mean that it cannot currently be collated and analysed at UKRI-level. Data is therefore only included on awards for studentship starts and award rates cannot be calculated.
UKRI is reviewing its data collection process for studentships and endeavours to improve the quality of application data collected through this annual report. Therefore, award rates are not included for studentship starts.
Ethnicity data is not disclosed or unknown for approximately 30% of studentships in all years.
Statistical testing
Permutation-randomisation tests
To better support interpretation of the data, we have included statistical analyses, specifically permutation or randomisation testing for significant differences in award rates between groups. This involved calculating the observed difference between award rates of each characteristic and comparing them with a random distribution of values generated from permutations.
Ronald A. Fisher lay the groundwork for permutation tests and related ideas through his work on randomisation tests (Fisher, R.A. 1935). Permutation tests have a wide range of real-world applications and can be applied to complete populations rather than samples, as is the case with the data used in this analysis (Good, 2000; Welch, 1990).
Each permutation works by randomly re-assigning each applicant to a protected characteristic group, recalculating the award rate of each group, and then estimating the differences between groups. The results of these permutations show what we would see if an applicant’s characteristic had no association with their chance of receiving an award. We performed 5,000 permutations (replications).
If the absolute value is greater than the highest 5% randomised values, the difference in award rate is considered significantly different than what you would expect by chance. There are a lot of comparisons made so the chance of a false positive goes up under the null hypothesis, therefore the significance values are also corrected for multiple testing.
In studies using permutation tests, Morazzi (2004) concluded that in actual applications, 5000 permutations are enough for testing at the significance level of 5%.
References
The design of experiments. Fisher RA.
Permutation Tests: A Practical Guide to Resampling Methods for Testing Hypotheses. Good P.
Some remarks about the number of permutations one should consider to perform a permutation test. Marozzi M.
Construction of Permutation Tests. Welch WJ.
Calculation of p-value
The p-value is calculated by counting how many times the permutations produce results from random generation that are at least as extreme as the observed values. This number is then divided by the number of permutations + 1 (adding 1 to the number of permutations ensures that the actual observed difference is also included in the set of permutations samples). For example, if 500 permutations gave an absolute value that is the same of higher than the observed value, the p value would be 500/5001 = 0.10.
Significance value threshold of 0.05
The p-value is the probability of obtaining the observed result when the null hypothesis, that there is no association between the characteristic and the outcome, is true. A p-value of 0.05 is an arbitrary, though commonly used, threshold to determine statistical significance in many research fields. The use of a p-value of 0.05 has become a convention over time. This uniformity helps comparing results across studies.
By comparing the p-value to a pre-defined significance level, we can decide whether to reject or fail to reject the null hypothesis. If the p-value is less than or equal to the significance level, we reject the null hypothesis and conclude that the difference is statistically significant. Otherwise, we fail to reject the null hypothesis. By setting a 0.05 threshold for significance we allow for a 5% probability of having a false positive (accepting the alternative hypothesis when the null hypothesis is true).
Use of False Discovery Rate to adjust for multiple testing
When multiple hypothesis tests are performed, the likelihood of observing at least one significant result by chance increases, leading to an inflated false positive rate (Type I error). To address this issue, multiple testing correction methods are employed, one of them being False Discovery Rate (FDR).
If performed manually, this is how FDR works:
- rank the non- adjusted p-values from lowest to highest
- create a column with the ranks of the p-values, lowest is 1, second lowest 2 and so on
- multiply the non-adjusted p-value by the number of tests and then divide that number by the rank
Example: lowest p-value in a group of 6 tests is 0.0008, the rank will be 1 because it’s the lowest, the adjusted p-value would be 0.0008*6/1 = 0.0048
Limitations
The results must be interpreted with caution, due to the complex nature of equality, diversity and inclusion (EDI) data. There is high level of intersectionality across EDI characteristics and between EDI characteristics and other variables (for instance, socio-economic background). Interpreting a statistically significant difference between two groups as the result of direct discrimination or bias against the less successful group could be misleading because of variables not accounted for.
In addition, this method is not appropriate to look at the relative importance of each EDI characteristic in explaining differences in award rates, as it only compares differences between groups within each characteristic.
The data is based on application count rather than individuals, so if the same individual applies more than once or in different role capacities, they are counted multiple times. In addition, each application is treated as an independent data point even though in reality some applicants might be on the same grant application, meaning their success is not independent from the success of other applicants on the same grant. This does not apply to fellows, as there is only one fellow per fellowship, and only very rarely to principal investigators, but happens often in grants with multiple co-investigators and researcher co-investigators.
Results
Tables 22 to 24: results from the permutations testing for financial years 2022 to 2023, and 2023 to 2024.
Note that only significant interactions are shown. The award rates for the characteristic in category 1 are compared to the award rates for category 2, and the difference and the ranges expected under the null calculated. All values are adjusted for multiple testing. Disability is not shown, as there were no significant interactions in either financial year.
Table 22a: results from the permutations testing for financial year 2022 to 2023, roles and age groups
| Role | Category 1 | Category 2 | Recorded award rate difference | Upper range | Lower range | Adjusted significance |
|---|---|---|---|---|---|---|
| Co-investigator | 30-39 | 29-or-less | 7% | 0.06 | -0.06 | 0.05 |
| Co-investigator | 40-49 | 29-or-less | 9% | 0.06 | -0.06 | 0.02 |
| Co-investigator | 50-59 | 29-or-less | 9% | 0.06 | -0.06 | 0.02 |
| Co-investigator | 60+ | 29-or-less | 8% | 0.06 | -0.06 | 0.05 |
| Fellow | 40-49 | 30-39 | 8% | 0.06 | -0.06 | 0.03 |
| Fellow | 60+ | 30-39 | -12% | 0.09 | -0.09 | 0.03 |
| Fellow | 60+ | 40-49 | -20% | 0.08 | -0.08 | <0.01 |
| Fellow | 60+ | 50-59 | -14% | 0.09 | -0.09 | 0.01 |
| Principal investigator | 50-59 | 30-39 | 4% | 0.03 | -0.03 | 0.02 |
| Principal investigator | 60+ | 30-39 | 8% | 0.04 | -0.04 | <0.01 |
| Principal investigator | 60+ | 40-49 | 5% | 0.03 | -0.03 | 0.02 |
| Researcher co-investigator | 60+ | 30-39 | 13% | 0.10 | -0.10 | 0.05 |
| Researcher co-investigator | 60+ | 50-59 | 13% | 0.10 | -0.10 | 0.05 |
Table 22b: results from the permutations testing for financial year 2023 to 2024, roles and age groups
| Role | Category 1 | Category 2 | Recorded award rate difference | Upper range | Lower range | Adjusted significance |
|---|---|---|---|---|---|---|
| Co-investigator | Unknown | 29-or-less | -15% | 0.11 | -0.10 | 0.05 |
| Co-investigator | Unknown | 30-39 | -11% | 0.09 | -0.09 | 0.05 |
| Co-investigator | Unknown | 40-49 | -11% | 0.09 | -0.09 | 0.05 |
| Co-investigator | Unknown | 50-59 | -12% | 0.09 | -0.09 | 0.05 |
| Co-investigator | Unknown | 60+ | -11% | 0.09 | -0.09 | 0.05 |
| Principal investigator | Unknown | 29-or-less | -26% | 0.18 | -0.17 | 0.04 |
| Researcher co-investigator | 60+ | 30-39 | -17% | 0.11 | -0.12 | 0.04 |
Table 23a: results from the permutations testing for financial year 2022 to 2023, roles and ethnicity
| Role | Category 1 | Category 2 | Recorded award rate difference | Upper range | Lower range | Adjusted significance |
|---|---|---|---|---|---|---|
| Co-investigator | Not Disclosed | Asian | 9% | 0.03 | -0.03 | <0.01 |
| Co-investigator | Not Disclosed | Black | 14% | 0.05 | -0.05 | <0.01 |
| Co-investigator | Not Disclosed | Mixed | 8% | 0.04 | -0.04 | <0.01 |
| Co-investigator | Unknown | Black | 23% | 0.17 | -0.16 | 0.02 |
| Co-investigator | White | Asian | 7% | 0.02 | -0.02 | <0.01 |
| Co-investigator | White | Black | 13% | 0.05 | -0.05 | <0.01 |
| Co-investigator | White | Mixed | 7% | 0.04 | -0.04 | <0.01 |
| Fellow | White | Asian | 13% | 0.08 | -0.08 | 0.04 |
| Principal investigator | Not Disclosed | Asian | 12% | 0.05 | -0.05 | <0.01 |
| Principal investigator | Not Disclosed | Black | 15% | 0.08 | -0.08 | <0.01 |
| Principal investigator | Not Disclosed | Mixed | 9% | 0.06 | -0.06 | 0.02 |
| Principal investigator | Unknown | Asian | 29% | 0.25 | -0.22 | 0.04 |
| Principal investigator | Unknown | Black | 32% | 0.25 | -0.23 | 0.03 |
| Principal investigator | White | Asian | 10% | 0.03 | -0.03 | <0.01 |
| Principal investigator | White | Black | 13% | 0.07 | -0.07 | <0.01 |
| Principal investigator | White | Mixed | 7% | 0.05 | -0.06 | 0.03 |
Table 23b: results from the permutations testing for financial year 2023 to 2024, roles and ethnicity
| Role | Category 1 | Category 2 | Recorded award rate difference | Upper range | Lower range | Adjusted significance |
|---|---|---|---|---|---|---|
| Co-investigator | Not Disclosed | Asian | 7% | 0.04 | -0.03 | <0.01 |
| Co-investigator | White | Asian | 6% | 0.02 | -0.02 | <0.01 |
| Principal investigator | Black | Asian | -12% | 0.08 | -0.08 | 0.01 |
| Principal investigator | Mixed | Black | 17% | 0.09 | -0.09 | <0.01 |
| Principal investigator | Not Disclosed | Asian | 11% | 0.05 | -0.06 | <0.01 |
| Principal investigator | Not Disclosed | Black | 23% | 0.08 | -0.08 | <0.01 |
| Principal investigator | White | Asian | 9% | 0.03 | -0.03 | <0.01 |
| Principal investigator | White | Black | 21% | 0.07 | -0.07 | <0.01 |
Table 24: results from the permutations testing for financial years 2022 to 2023 and 2023 to 2024, roles and gender
| Year | Role | Category 1 | Category 2 | Recorded award rate difference | Upper range | Lower range | Adjusted significance |
|---|---|---|---|---|---|---|---|
| 2022-2023 | CI | Male | Female | 4% | 0.01 | -0.01 | <0.01 |
| 2022-2023 | Fellow | Male | Female | -15% | 0.05 | -0.05 | <0.01 |
| 2022-2023 | RCI | Male | Female | 7% | 0.06 | -0.06 | 0.05 |
| 2023-2024 | Fellow | Male | Female | -8% | 0.05 | -0.05 | <0.01 |